
Research Article
Austin J Clin Neurol 2021; 8(1): 1147.
TLR2, SOCS1 and IL1R1 but not Legionella Play a Potential Role in the Pathogenesis of Bell’s Palsy Revealed by Competitive Endogenous RNA Network Study
Li X1,2#, Zhao Y3#, Zhao C1,2, Chen C1,2, Li Z1,2, Huo W1,2, Liang W1,2 and Liu Z1,2*
¹Department of Acupuncture, Baoshan Branch of Shuguang Hospital, Shanghai University of Traditional Chinese Medicine, Shanghai 201999, China
²Department of Acupuncture, Baoshan Hospital of Integrated Traditional Chinese Medicine and Western Medicine, Shanghai 201999, China
³Pathogen biology laboratory, Wuhan Center for Disease Control & Prevention, Wuhan 430010, Hubei Province, China
#Contributed Equally to this Work
*Corresponding author: Zhidan Liu, Associate Professor, Department of Acupuncture, Baoshan Branch of Shuguang Hospital, Shanghai University of Traditional Chinese Medicine, Shanghai, China
Received: April 20, 2021; Accepted: May 07, 2021; Published: May 14, 2021
Abstract
Background: The present study aimed to identify the key long noncoding RNAs (lncRNAs) and determine their potential etiological factors of Bell’s palsy using RNA-Seq data based on bioinformatics tools.
Methods: Serum from fifteen patients with Bell’s palsy and fifteen healthy individuals were collected. Differentially Expressed Genes (DEGs)-Differentially Expressed lncRNAs (DELs) in two groups were identified. The competing endogenous RNAs (ceRNAs) regulatory network was constructed by integrating lncRNA-mRNA pairs, miRNA-mRNA regulatory pairs, and miRNA-lncRNA pairs using Cytoscape. The Gene Ontology (GO) functions and Kyoto Encyclopedia of Genes and Genomes (KEGG) pathways analyses of key lncRNAs in the ceRNA network were evaluated to explore the effects of lncRNA during the occurrence of Bell’s palsy. Finally, pathogen culture, ELISA or q-PCR were applied to verify the presence of the pathogen and relevant cytokines or proteins.
Results: In the present study, hub proteins such as TLR2 (degree=25), ITGAM (degree=14), SOCS1 (degree=13), IL1R1 (degree=11) were identified in PPI network based on DEGs. Subsequently, 2761 lncRNA-mRNA coexpression pairs including RP11-415J8.3-TLR2, 5629 miRNA-lncRNA interaction pairs, and 51 miRNA-mRNA interactions were obtained. Finally, 9 miRNAs, 5 DEGs, 6 DELs, and 9 miRNA-mRNA pairs, 10 miRNA-lncRNA pairs, and 7 mRNA-lncRNA co-expression pairs were including in ceRNA regulatory network. Meanwhile, RP11-415J8.3 were mainly enriched to legionellosis (pathway), cytokine receptor activity (GO: 0004896), and phospholipid binding (GO: 0005543). Subsequently, validation of neuroinflammation relevant TLR2, ITGAM, SOCS1, IL1R1 and legionella through another forty-five BP patients and thirty healthy individuals showed that TLR2, ITGAM, IL1R1 expressions were upregulated in the serum of patients with Bell’s palsy while SOCS1 was down-regulated, while legionella was not found among them.
Conclusions: We hypothesized that the etiological factor of Bell’s palsy correlate to a complex miRNA-lncRNA-mRNA interacting network and IL1R1, SOCS1 and TLR2 may involve in the onset of Bell’s palsy rather than legionella.
Keywords: Bell’s palsy; microRNAs; Long non-coding RNA; Competing endogenous RNAs; IL1R1; SOCS1; Legionellosis
Introduction
Bell’s palsy is a type of facial paralysis due to damage to facial nerve, results in the facial muscles on the affected side become weak or paralyzed [1]. Epidemiological report suggests a high annual incidence of 23-37 per 100,000 per year in UK [2], and most commonly affects people of 15-45 years old [3]. The cause of Bell’s palsy is not clear; however, diabetes and recent viral infection have been determined as risk factors [4,5]. Therefore, anti-inflammatory and anti-viral drug therapy such as corticosteroids and aciclovir has been used to improve outcomes [6]. However, the benefit of drugs alone or in combination is also unclear. A double blind randomized clinical trial has reported that the combination of steroid and antiviral treatment has good recovery in moderately severe to complete acute Bell’s palsy compared with steroid alone [6]. A metastudy shows no additional benefit from the combination of antivirals and corticosteroids treatment compared to corticosteroids alone [3]. Obviously, the revelation of the cause of the disease will help to develop more effective treatment strategies.
In the present study, we aimed to identify the key long noncoding RNAs (lncRNAs) and determine their potential mechanisms in the occurrence of Bell’s palsy using RNA-Seq data based on bioinformatics tools. The competing endogenous RNAs (ceRNAs) regulatory network was constructed by integrating the Differentially Expressed Genes (DEGs)-Differentially Expressed lncRNAs (DELs) (DELs-DEGs) coexpression pairs, miRNA-mRNA regulatory pairs, and miRNA-lncRNA pairs using Cytoscape. The key lncRNAs in the ceRNA network, which were enriched in Gene Ontology (GO) functions and Kyoto Encyclopedia of Genes and Genomes (KEGG) pathways were evaluated to explore the role of lncRNA in the disease onset. It will be helpful to reveal the underlying etiological factor.
Methods
RNA extraction and Illumina sequencing
Serum from fifteen patients with Bell’s palsy (case group) and fifteen healthy individuals (control group) were collected. The total RNA was extracted from samples in the two groups using Trizol reagent following the manufacturer’s instructions (Invitrogen, 15596- 018, USA). After the quality control of RNA, mRNA was enriched by oligo (dT) magnetic beads (Dynabeads® oligo dT, Thermo Fisher Scientific, USA), and then broke into shot fragments by fragmentation buffer (Agilent Technologies, California, USA). Afterwards, the RNA fragments were reverse transcribed into the first strand cDNA with random hexamers. The second strand cDNA was compounded by adding into buffer, dNTPs, RNase H and DNA polymerase I. The final cDNA library was constructed after double strands cDNA were purified and repaired. The concentration of cDNAs in the library was attenuated into 1ng/μL with a Qubit 2.0 fluorometer, and then cDNAs were detected using the Agilent Bioanalyzer 2100 (Agilent Technologies, California, USA). The bioanalyzer software automatically generates the value of RNA Integrity Number (RIN, 1 to 10) based on the ratio of the 18S to 28S ribosomal subunits to determine the level of RNA degradation in gel electrophoresis, which removed individual interpretation in RNA quality control. RNAs with RIN ≥8.0 were used in the study. The libraries were pooled according to the data size and effective cDNA concentration. Finally, the cDNA libraries were sequenced on an Illumina HiSeqTM 3500. The raw sequencing data have been uploaded to the public database NCBI.
Identification of DEGs and DELs
The DEGs and DELs between Bell’s palsy patients (case group) and healthy individuals (control group) were identified using the limma package in R software (version 3.26.9, http://bioconductor. org/packages/release/bioc/html/limma.html) [7]. Thresholds of DEGs and DELs were defined as |Log fold-change (FC)|>0.585 and P value<0.05. Subsequently, heatmap and volcano plot of these DEGs and DELs was drawn using pheatmap (version 1.0.8, https://cran.rproject. org/web/packages/pheatmap) in R software.
Function and pathway analyses for DEGs
The GO function and KEGG pathway of DEGs were enriched by clusterProfiler package (version 3.2.11, http://www.bioconductor. org/packages/release/bioc/html/clusterProfiler.html) in R software [8]. P<0.05 was defined as the cut-off value, indicating that these GO Biological Process (BP) terms and KEGG pathways for DEGs were significant.
Constructing PPI network based on DEGs
STRING (version: 10.0, http://www.string-db.org/) was used to analyze PPI according to DEGs under the cut-off value of Required Confidence (combined score)>0.4 [9]. Then PPI network was visualized by Cytoscape software (version 2.1.6, http://apps.cytoscape. org/apps/cytonca). Subsequently, CytoNCA plug-in (version 2.1.6, http://apps.cytoscape.org/apps/cytonca) was used for topological analysis of PPI network. Parameter was set as ‘without weight’, and the results including Degree Centrality (DC), Betweenness Centrality (BC), and Closeness Centrality (CC) were output. At last, the hub protein was identified according to their degree ranking.
Co-expression analysis between DEGs and DELs
Firstly, Person’s correlation coefficient of each DEG and DEL was calculated. Then, thresholds of P<0.05 and |correlation coefficient (r)|>0.9 were used to identify significantly co-expressed lncRNAmRNA pairs. When r>0.9, lncRNA-mRNA pairs had a cis-interaction; when r<-0.9, lncRNA-mRNA pairs had a trans-interaction.
Function and pathway analyses for DELs
The GO function and KEGG pathway of DELs were enriched by clusterProfiler package (version 3.2.11, http://www.bioconductor. org/packages/release/bioc/html/clusterProfiler.html) in R software [8,9]. P<0.01 was defined as the cut-off value, indicating that these GO BP terms and KEGG pathways for DELs (count of co-expressed pairs>50) were significant.
Identification of miRNA-lncRNA and miRNA-mRNA interaction pairs
The miRNA-lncRNA pairs were predicted using lnCeDB database based on miranda tool. In addition, miRWALK2.0 (http:// zmf.umm.uni-heidelberg.de/apps/zmf/mirwalk2/miRretsys-self. html, including miRWalk, mirbridge, miRDB, miRanda, RNAhybrid, RNA22, Targetscan databases) was used to identify target genes based on the above miRNAs (species: Homo). Finally, shared miRNAmRNA interactions in at least 7 databases were used.
Comprehensive analysis of ceRNA regulatory network
The ceRNA regulatory network was constructed by integrating the lncRNA-miRNA interaction pairs, miRNA-mRNA pairs, and lncRNA-mRNA co-expressed pairs using Cytoscape (version, 3.6.0). Generally, ceRNAs act as molecular sponges of miRNA through their miRNA response elements, following by regulating the target genes. Subsequently, key lncRNAs in ceRNA regulatory network were enriched to the BP terms.
Legionella culture
Blood samples from another forty-five patients with Bell’s palsy and thirty healthy individuals were collected and distribute to plates on which pathogenic bacteria strain was set to grow on Buffered Charcoal Yeast Extract (BCYE) agar (BD BBLTM, New Delhi, India) medium for 3-7 days at 37°C under 5% CO2. Legionella observed no growth after subculture to blood agar were presumptively identified as none infection.
IL1R1, SOCS1, ILR, ITGAM analysis by q-PCR and ELISA
Total RNA was extracted using the Ultraspec Phenol Kit (Biotecx, Houston, TX, USA) according to the manufacturer’s instructions. Then, cDNA was synthesized from total RNA using the cDNA Synthesis Kit (Roche, Mannheim, Germany) and TaqMan MicroRNA Reverse Transcription Kit (bought from Applied Biosystems, USA). Quantitative PCR (q-PCR) detected the levels of IL1R1, SOCS1, ILR, ITGAM using an SYBR-green detection system on an ABI-7500 Real-time PCR System (Applied Biosystems, Foster City, CA, USA). The mRNA expression was expressed relative to Glyceraldehyde-3-Phosphate Dehydrogenase (GAPDH) as an internal control, while miRNA expression was expressed relative to U6 as an internal control. The mRNA expression was expressed relative to Glyceraldehyde-3-Phosphate Dehydrogenase (GAPDH) as an internal control, while miRNA expression was expressed relative to U6 as an internal control. The relative expression levels of miRNAs were evaluated using the 2-△△ct method and expression levels were normalized relative to those of U6. The PCR amplification reaction was carried out in a 20μl system, including 1μl cDNA, as well as 1μl forward primer and 1μl reverse primer. The primer sequences used were listed in as followed, all PCR assays were performed in triplicate. IL1R1 (261 bps): Primer F 5’ CTGTCACCAGCCACTAAG 3’; Primer R 5’ TTCCCAAGCCCTCTACTC 3’; SOCS1 (265 bps): Primer F 5’ CACGCACTTCCGCACATTCC 3’, Primer R 5’ GCTGCCATCCAGGTGAAAGC 3’; TLR2 (247 bps): Primer F 5’ TGTCCTACCTAGCTGTCACTTC 3’, Primer R 5’ CTGTACCTTGCACTGTGTACTC 3’; ITGAM (223 bps): rimer F 5’ GTGCTGTTTACCTGTTTC 3’, Primer R 5’ ATGATTGCCTTGACTCTC 3’; GAPDH (218bps): Primer F 5’ AATCCCATCACCATCTTC 3’, Primer R 5’ AGGCTGTTGTCATACTTC 3’.
The presence of IL1R1, SOCS1, ILR, ITGAM were detected using ELISA kit (eBioscience, USA) according to the manufacturer’s instruction. Cut-off was defined with positive and negative control serum that were included in each assay, according to the manufacturer’s instruction.
Results
Differentially expressed DEGs and DELs
As shown in Figure 1, the samples were significantly divided into case and control groups according to the DEGs and DELs, indicating that these genes and lncRNAs were significantly differentially expressed between two groups. In total, 201 DEGs were identified in case group, including 9 up-regulated DEGs and 192 down-regulated DEGs. In addition, a total of 82 DELs were identified in case group, including 4 up-regulated DELs and 78 down-regulated DELs.
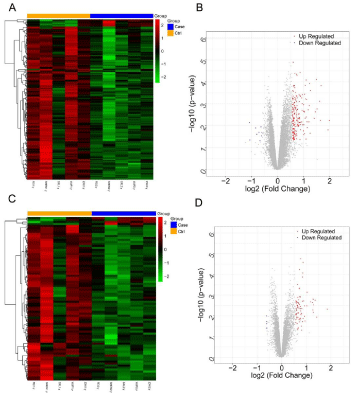
    Figure 1: Heatmap and volcano plot of Differentially Expressed Genes
(DEGs), Differentially Expressed lncRNAs (DELs). A,C) Heatmap of DEGs
(A) and DELs (C); Orange in the header (Ctrl) indicates samples in healthy
controls; Blue in the header (Case) indicates samples in BP patients; Green
indicates down-regulated DEGs or DELs; Red indicates up-regulated DEGs
or DELs; B,D) Volcano plot of DEGs (B) and DELs (D); Blue indicates downregulated
DEGs or DELs; Red indicates up-regulated DEGs or DELs.
GO terms and KEGG pathways for DEGs
Down-regulated DEGs were mainly enriched to 3 pathways such as hsa05134: legionellosis, hsa04213: longevity regulating pathwaymultiple species, and hsa04640: hematopoietic cell lineage, and 15 GO terms such as GO:0004896: cytokine receptor activity, GO:0005543: phospholipid binding, and GO:0008235: metallopeptidase activity. In addition, up-regulated DEGs were mainly enriched to 3 pathways such as hsa05164: influenza A, hsa05165: human papillomavirus infection, and hsa04927: Cortisol synthesis and secretion, and 7 GO terms such as GO:0043621: protein self-association, GO:0004879: RNA polymerase II transcription factor activity, ligand-activated sequence-specific DNA binding, and GO:0003707: steroid hormone receptor activity (Figure 2).
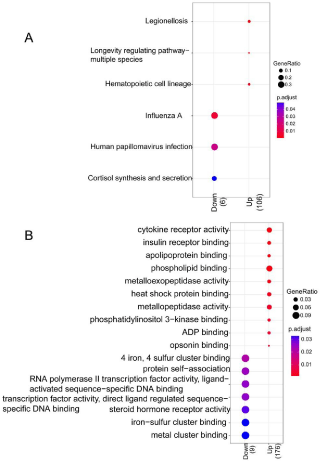
    Figure 2: Results of GO function and KEGG pathway for DEGs. A) Annotated
map of KEGG pathway; B) Annotated map of GO terms. X-axis indicates the
count of genes in the function terms and pathways; Y-axis indicates the GO
terms and pathways.
Hub proteins in PPI network
In PPI network, there were 108 nodes and 226 interaction pairs (e.g. TLR2- SOCS1), including 99 up-regulated DEGs and 9 downregulated DEGs (Figure 3). Hub proteins such as toll like receptor 2 (TLR2, degree = 25), integrin subunit alpha M (ITGAM, degree = 14), suppressor of cytokine signaling 1 (SOCS1, degree = 13), interleukin 1 receptor, type I (IL1R1, degree = 11), solute carrier family 11 member 1 (SLC11A1, degree = 11), formyl peptide receptor 1 (FPR1, degree = 11), C-X-C motif chemokine receptor 2 (CXCR2, degree = 11), heat shock protein family A (Hsp70) member 1A (HSPA1A, degree = 10), insulin like growth factor 1 receptor (IGF1R, degree = 9), and ISG15 ubiquitin-like modifier (ISG15, degree = 9) were identified.
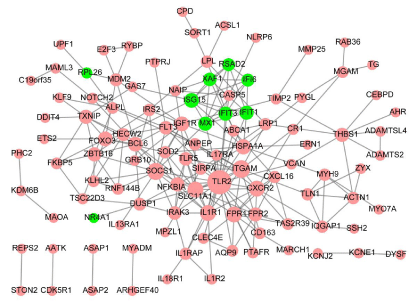
    Figure 3: Protein-protein interaction network. Pink triangle indicates upregulated
DEGs; Green arrow indicates down-regulated DEGs; the greater
nodes, the higher degree.
LncRNA-mRNA coexpression pairs
Overall, 2761 lncRNA-mRNA pairs (e.g. lncRNA RP11-415J8.3- TLR2) were identified after the lncRNA-mRNA coexpression analysis, including 182 DEGs and 77 DELs. Additionally, there were 24 lncRNAs with more than 50 interactions in the miRNA-mRNA regulatory network. In addition, 24 lncRNAs were enriched to 18 pathways and 96 GO terms (Table 1).
![]()
    Cluster
    ID
    Description
    P. adjust
    Count


    AC078889.1
    hsa04658
    Th1 and Th2 cell differentiation
    0.004811
    3


    AC078889.1
    hsa05202
    Transcriptional misregulation in cancer
    0.004864
    4


    AC078889.1
    hsa05215
    Prostate cancer
    0.005578
    3


    AC078889.1
    hsa01522
    Endocrine resistance
    0.005739
    3


    AC078889.1
    hsa04625
    C-type lectin receptor signaling pathway
    0.006769
    3


    AC078889.1
    hsa04919
    Thyroid hormone signaling pathway
    0.009142
    3


    AL513327.1
    hsa05134
    Legionellosis
    0.000148
    4


    AL513327.1
    hsa00061
    Fatty acid biosynthesis
    0.001818
    2


    AL513327.1
    hsa04060
    Cytokine-cytokine receptor interaction
    0.003008
    6


    AL513327.1
    hsa04920
    Adipocytokine signaling pathway
    0.004752
    3


    AL513327.1
    hsa05140
    Leishmaniasis
    0.00578
    3


    LINC00676
    hsa05202
    Transcriptional misregulation in cancer
    0.004251
    4


    LINC00676
    hsa04658
    Th1 and Th2 cell differentiation
    0.004334
    3


    LINC00676
    hsa05215
    Prostate cancer
    0.005027
    3


    LINC00676
    hsa01522
    Endocrine resistance
    0.005173
    3


    LINC00676
    hsa04625
    C-type lectin receptor signaling pathway
    0.006105
    3


    LINC00676
    hsa04151
    PI3K-Akt signaling pathway
    0.007906
    5


    LINC00676
    hsa04919
    Thyroid hormone signaling pathway
    0.008255
    3


    MKNK1-AS1
    hsa05134
    Legionellosis
    0.000182
    4


    MKNK1-AS1
    hsa04060
    Cytokine-cytokine receptor interaction
    0.003952
    6


    MKNK1-AS1
    hsa04920
    Adipocytokine signaling pathway
    0.005516
    3


    MKNK1-AS1
    hsa05418
    Fluid shear stress and atherosclerosis
    0.005808
    4


    MKNK1-AS1
    hsa05140
    Leishmaniasis
    0.006703
    3


    RBMS1P1
    hsa05134
    Legionellosis
    0.00179
    3


    RBMS1P1
    hsa05321
    Inflammatory Bowel Disease (IBD)
    0.002891
    3


    RP11-153M7.5
    hsa05134
    Legionellosis
    0.000379
    4


    RP11-153M7.5
    hsa00061
    Fatty acid biosynthesis
    0.002922
    2


    RP11-153M7.5
    hsa05215
    Prostate cancer
    0.003168
    4


    RP11-415J8.3
    hsa05134
    Legionellosis
    0.000693
    4


    RP11-61I13.3
    hsa05134
    Legionellosis
    0.002125
    3


    RP11-61I13.3
    hsa05418
    Fluid shear stress and atherosclerosis
    0.003916
    4


    RP11-668G10.2
    hsa04640
    Hematopoietic cell lineage
    3.17E-05
    5


    RP11-668G10.2
    hsa05134
    Legionellosis
    5.56E-05
    4


    RP11-668G10.2
    hsa05140
    Leishmaniasis
    0.000178
    4


    RP11-668G10.2
    hsa05146
    Amoebiasis
    0.000485
    4


    RP11-668G10.2
    hsa05152
    Tuberculosis
    0.00483
    4


    RP11-668G10.2
    hsa05215
    Prostate cancer
    0.006163
    3


    RP11-676B18.2
    hsa05134
    Legionellosis
    2.71E-06
    5


    RP11-676B18.2
    hsa05146
    Amoebiasis
    0.00063
    4


    RP11-676B18.2
    hsa05150
    Staphylococcus aureus infection
    0.00157
    3


    RP11-676B18.2
    hsa04520
    Adherens junction
    0.003229
    3


    RP11-676B18.2
    hsa05140
    Leishmaniasis
    0.00349
    3


    RP11-676B18.2
    hsa04640
    Hematopoietic cell lineage
    0.00744
    3


    RP11-676B18.2
    hsa00500
    Starch and sucrose metabolism
    0.009718
    2


    RP11-701P16.2
    hsa05134
    Legionellosis
    0.000119
    4


    RP11-701P16.2
    hsa04060
    Cytokine-cytokine receptor interaction
    0.002244
    6


    RP11-76E17.3
    hsa04060
    Cytokine-cytokine receptor interaction
    0.001163
    6


    RP11-7F17.8
    hsa05215
    Prostate cancer
    0.000307
    5


    RP11-7F17.8
    hsa01522
    Endocrine resistance
    0.003039
    4


    RP11-7F17.8
    hsa05150
    Staphylococcus aureus infection
    0.004895
    3


    RP11-7F17.8
    hsa04068
    FoxO signaling pathway
    0.008725
    4


    RP11-7F17.8
    hsa04920
    Adipocytokine signaling pathway
    0.008749
    3


    RP11-7F17.8
    hsa05214
    Glioma
    0.009462
    3


    RP11-7F17.8
    hsa03320
    PPAR signaling pathway
    0.009832
    3


    RP11-7F17.8
    hsa05218
    Melanoma
    0.009832
    3


    RP11-946L16.2
    hsa05134
    Legionellosis
    0.001353
    3


    RP4-673D20.3
    hsa05146
    Amoebiasis
    0.001523
    4


    RP4-673D20.3
    hsa05134
    Legionellosis
    0.002905
    3


    RP4-673D20.3
    hsa05150
    Staphylococcus aureus infection
    0.003059
    3


    RP4-673D20.3
    hsa04010
    MAPK signaling pathway
    0.004018
    6


    RP4-673D20.3
    hsa04213
    Longevity regulating pathway - multiple species
    0.004084
    3


    RP5-968J1.1
    hsa05134
    Legionellosis
    0.00032
    4


    RTN3P1
    hsa05134
    Legionellosis
    0.000148
    4


    RTN3P1
    hsa05146
    Amoebiasis
    0.001247
    4


    RTN3P1
    hsa04640
    Hematopoietic cell lineage
    0.001296
    4


    RTN3P1
    hsa05150
    Staphylococcus aureus infection
    0.002628
    3


    RTN3P1
    hsa05140
    Leishmaniasis
    0.00578
    3


    WDFY3-AS2
    hsa05134
    Legionellosis
    0.000411
    4


    WDFY3-AS2
    hsa04060
    Cytokine-cytokine receptor interaction
    0.002581
    7


    WDFY3-AS2
    hsa00061
    Fatty acid biosynthesis
    0.003046
    2


    WDFY3-AS2
    hsa05215
    Prostate cancer
    0.003422
    4
Table 1: Enrichment of function and pathways for DELs in DELs-DEGs coexpression
pairs. DEGs, differentially expressed genes; DELs, differentially
expressed lncRNAs.
![]()
    Cluster
    ID
    Description
    P. adjust
    Count


    AC078889.1
    hsa04658
    Th1 and Th2 cell differentiation
    0.004811
    3


    AC078889.1
    hsa05202
    Transcriptional misregulation in cancer
    0.004864
    4


    AC078889.1
    hsa05215
    Prostate cancer
    0.005578
    3


    AC078889.1
    hsa01522
    Endocrine resistance
    0.005739
    3


    AC078889.1
    hsa04625
    C-type lectin receptor signaling pathway
    0.006769
    3


    AC078889.1
    hsa04919
    Thyroid hormone signaling pathway
    0.009142
    3


    AL513327.1
    hsa05134
    Legionellosis
    0.000148
    4


    AL513327.1
    hsa00061
    Fatty acid biosynthesis
    0.001818
    2


    AL513327.1
    hsa04060
    Cytokine-cytokine receptor interaction
    0.003008
    6


    AL513327.1
    hsa04920
    Adipocytokine signaling pathway
    0.004752
    3


    AL513327.1
    hsa05140
    Leishmaniasis
    0.00578
    3


    LINC00676
    hsa05202
    Transcriptional misregulation in cancer
    0.004251
    4


    LINC00676
    hsa04658
    Th1 and Th2 cell differentiation
    0.004334
    3


    LINC00676
    hsa05215
    Prostate cancer
    0.005027
    3


    LINC00676
    hsa01522
    Endocrine resistance
    0.005173
    3


    LINC00676
    hsa04625
    C-type lectin receptor signaling pathway
    0.006105
    3


    LINC00676
    hsa04151
    PI3K-Akt signaling pathway
    0.007906
    5


    LINC00676
    hsa04919
    Thyroid hormone signaling pathway
    0.008255
    3


    MKNK1-AS1
    hsa05134
    Legionellosis
    0.000182
    4


    MKNK1-AS1
    hsa04060
    Cytokine-cytokine receptor interaction
    0.003952
    6


    MKNK1-AS1
    hsa04920
    Adipocytokine signaling pathway
    0.005516
    3


    MKNK1-AS1
    hsa05418
    Fluid shear stress and atherosclerosis
    0.005808
    4


    MKNK1-AS1
    hsa05140
    Leishmaniasis
    0.006703
    3


    RBMS1P1
    hsa05134
    Legionellosis
    0.00179
    3


    RBMS1P1
    hsa05321
    Inflammatory bowel disease (IBD)
    0.002891
    3


    RP11-153M7.5
    hsa05134
    Legionellosis
    0.000379
    4


    RP11-153M7.5
    hsa00061
    Fatty acid biosynthesis
    0.002922
    2


    RP11-153M7.5
    hsa05215
    Prostate cancer
    0.003168
    4


    RP11-415J8.3
    hsa05134
    Legionellosis
    0.000693
    4


    RP11-61I13.3
    hsa05134
    Legionellosis
    0.002125
    3


    RP11-61I13.3
    hsa05418
    Fluid shear stress and atherosclerosis
    0.003916
    4


    RP11-668G10.2
    hsa04640
    Hematopoietic cell lineage
    3.17E-05
    5


    RP11-668G10.2
    hsa05134
    Legionellosis
    5.56E-05
    4


    RP11-668G10.2
    hsa05140
    Leishmaniasis
    0.000178
    4


    RP11-668G10.2
    hsa05146
    Amoebiasis
    0.000485
    4


    RP11-668G10.2
    hsa05152
    Tuberculosis
    0.00483
    4


    RP11-668G10.2
    hsa05215
    Prostate cancer
    0.006163
    3


    RP11-676B18.2
    hsa05134
    Legionellosis
    2.71E-06
    5


    RP11-676B18.2
    hsa05146
    Amoebiasis
    0.00063
    4


    RP11-676B18.2
    hsa05150
    Staphylococcus aureus infection
    0.00157
    3


    RP11-676B18.2
    hsa04520
    Adherens junction
    0.003229
    3


    RP11-676B18.2
    hsa05140
    Leishmaniasis
    0.00349
    3


    RP11-676B18.2
    hsa04640
    Hematopoietic cell lineage
    0.00744
    3


    RP11-676B18.2
    hsa00500
    Starch and sucrose metabolism
    0.009718
    2


    RP11-701P16.2
    hsa05134
    Legionellosis
    0.000119
    4


    RP11-701P16.2
    hsa04060
    Cytokine-cytokine receptor interaction
    0.002244
    6


    RP11-76E17.3
    hsa04060
    Cytokine-cytokine receptor interaction
    0.001163
    6


    RP11-7F17.8
    hsa05215
    Prostate cancer
    0.000307
    5


    RP11-7F17.8
    hsa01522
    Endocrine resistance
    0.003039
    4


    RP11-7F17.8
    hsa05150
    Staphylococcus aureus infection
    0.004895
    3


    RP11-7F17.8
    hsa04068
    FoxO signaling pathway
    0.008725
    4


    RP11-7F17.8
    hsa04920
    Adipocytokine signaling pathway
    0.008749
    3


    RP11-7F17.8
    hsa05214
    Glioma
    0.009462
    3


    RP11-7F17.8
    hsa03320
    PPAR signaling pathway
    0.009832
    3


    RP11-7F17.8
    hsa05218
    Melanoma
    0.009832
    3


    RP11-946L16.2
    hsa05134
    Legionellosis
    0.001353
    3


    RP4-673D20.3
    hsa05146
    Amoebiasis
    0.001523
    4


    RP4-673D20.3
    hsa05134
    Legionellosis
    0.002905
    3


    RP4-673D20.3
    hsa05150
    Staphylococcus aureus infection
    0.003059
    3


    RP4-673D20.3
    hsa04010
    MAPK signaling pathway
    0.004018
    6


    RP4-673D20.3
    hsa04213
    Longevity regulating pathway - multiple species
    0.004084
    3


    RP5-968J1.1
    hsa05134
    Legionellosis
    0.00032
    4


    RTN3P1
    hsa05134
    Legionellosis
    0.000148
    4


    RTN3P1
    hsa05146
    Amoebiasis
    0.001247
    4


    RTN3P1
    hsa04640
    Hematopoietic cell lineage
    0.001296
    4


    RTN3P1
    hsa05150
    Staphylococcus aureus infection
    0.002628
    3


    RTN3P1
    hsa05140
    Leishmaniasis
    0.00578
    3


    WDFY3-AS2
    hsa05134
    Legionellosis
    0.000411
    4


    WDFY3-AS2
    hsa04060
    Cytokine-cytokine receptor interaction
    0.002581
    7


    WDFY3-AS2
    hsa00061
    Fatty acid biosynthesis
    0.003046
    2


    WDFY3-AS2
    hsa05215
    Prostate cancer
    0.003422
    4
Table 1 of 1:
ceRNA regulatory network
Totally, 5629 miRNA-lncRNA interaction pairs were identified after InCeDB, including 1436 miRNAs and 38 lncRNAs. Additionally, 51 miRNA-mRNA interactions were obtained, including 48 miRNAs and 24 DEGs. In ceRNA regulatory network, we identified 20 nodes (including 9 miRNAs, 5 DEGs, and 6 DELs) and 26 interaction pairs (including 9 miRNA-mRNA pairs, 10 miRNA-lncRNA pairs, and 7 mRNA-lncRNA co-expression pairs) (Figure 4). In ceRNA regulatory network, has-miR-520a-3p and lncRNA RP11-415J8.3 were key nodes. Additionally, 6 up-regulated lncRNAs such as LINC00482, RP11-415J8.3, CTB-111H14.1, RP11-575L7.4, RP11-153M7.5, and RP11-76E17.3 were defined as the key DCLs in ceRNA regulatory network. These key DELs were enriched to 7 pathways and 18 GO terms such as legionellosis (hsa05134, pathway), cytokine receptor activity (GO:0004896), and phospholipid binding (GO:0005543) (Table 2).
![]()
    KEGG Pathway


    Cluster
    ID
    Description
    P. adjust
    Gene Count
    gene


    CTB-111H14.1
    hsa04621
    NOD-like receptor signaling pathway
    0.00344
    3
    CASP5/NAIP/TXNIP


    LINC00482
    hsa05221
    Acute myeloid leukemia
    0.006602
    2
    FLT3/ZBTB16


    RP11-153M7.5
    hsa05134
    Legionellosis
    0.000379
    4
    CR1/NFKBIA/TLR2/TLR5


    RP11-153M7.5
    hsa00061
    Fatty acid biosynthesis
    0.002922
    2
    ACSL1/OLAH


    RP11-153M7.5
    hsa05215
    Prostate cancer
    0.003168
    4
    IGF1R/IL1R2/MDM2/NFKBIA


    RP11-415J8.3
    hsa05134
    Legionellosis
    0.000693
    4
    CR1/NFKBIA/TLR2/TLR5


    RP11-76E17.3
    hsa04060
    Cytokine-cytokine receptor interaction
    0.001163
    6
    CXCL16/IL13RA1/IL18R1/IL1R2/IL1RAP/INHBB


    GO Terms


    Cluster
    ID
    Description
    P. adjust
    Count
    gene


    CTB-111H14.1
    GO:0008235
    Metalloexopeptidase activity
    0.002811
    2
    CPM/NUDT16


    CTB-111H14.1
    GO:0035258
    Steroid hormone receptor binding
    0.007325
    2
    FLT3/ZNF366


    CTB-111H14.1
    GO:0004896
    Cytokine receptor activity
    0.008997
    2
    FLT3/IL18R1


    LINC00482
    GO:0005044
    Scavenger receptor activity
    0.002376
    2
    CD163/CXCL16


    LINC00482
    GO:0008235
    Metalloexopeptidase activity
    0.002811
    2
    CPM/NUDT16


    LINC00482
    GO:0038024
    Cargo receptor activity
    0.004748
    2
    CD163/CXCL16


    LINC00482
    GO:0035258
    Steroid hormone receptor binding
    0.007325
    2
    FLT3/ZNF366


    RP11-153M7.5
    GO:0005158
    Insulin receptor binding
    0.000603
    3
    GRB10/IGF1R/IRS2


    RP11-153M7.5
    GO:0004896
    Cytokine receptor activity
    0.001187
    4
    IL13RA1/IL17RA/IL1R2/IL1RAP


    RP11-415J8.3
    GO:0004896
    Cytokine receptor activity
    0.000123
    5
    IL13RA1/IL17RA/IL1R1/IL1R2/IL1RAP


    RP11-415J8.3
    GO:0005543
    Phospholipid binding
    0.000544
    8
    ABCA1/ASAP1/DYSF/KCNJ2/PREX1/PTAFR/VNN1/WDFY3


    RP11-575L7.4
    GO:0004896
    Cytokine receptor activity
    0.000154
    4
    IL13RA1/IL17RA/IL1R2/IL1RAP


    RP11-575L7.4
    GO:0005543
    phospholipid binding
    0.003758
    5
    ABCA1/KCNJ2/PREX1/VNN1/WDFY3


    RP11-575L7.4
    GO:0004693
    Cyclin-dependent protein serine/threonine kinase activity
    0.004257
    2
    CDK5R1/MAK


    RP11-575L7.4
    GO:0097472
    Cyclin-dependent protein kinase activity
    0.004257
    2
    CDK5R1/MAK


    RP11-575L7.4
    GO:0046915
    Transition metal ion transmembrane transporter activity
    0.005365
    2
    SLC11A1/SLC31A2


    RP11-575L7.4
    GO:0005088
    Ras guanyl-nucleotide exchange factor activity
    0.006809
    3
    ARHGEF40/PREX1/RASGRP4


    RP11-76E17.3
    GO:0004896
    Cytokine receptor activity
    1.07E-05
    5
    FLT3/IL13RA1/IL18R1/IL1R2/IL1RAP


    GO: Gene Ontology; KEGG: Kyoto Encyclopedia of    Genes and Genomes.
Table 2: Enrichment of function and pathways for the key DELs in ceRNA regulatory network.
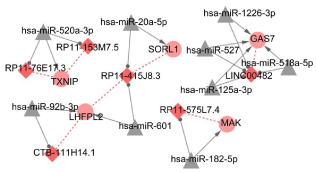
    Figure 4: ceRNA regulatory network. Triangle indicates miRNA; Rhombus
indicates up-regulated lncRNA; circle indicates up-regulated genes. The
greater the degree value, the more important the node.
Legionella culture
Legionella was not found in the samples within any group.
IL1R1, SOCS1, ILR, ITGAM expressions
As shown in Figure 5, the mRNA and protein expressions of SOCS1 was lower in BP patients compared to that in healthy controls (P <0.05). While the mRNA and protein expressions of TLR2, ITGAM and IL1R1 were higher in BP patients (P <0.05).
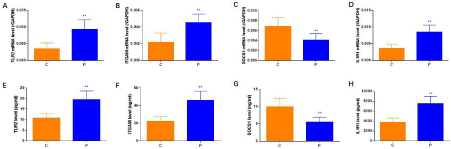
    Figure 5: IL1R1, SOCS1, ILR, ITGAM expressions by q-PCR and ELISA. As shown in A-H, the mRNA and protein expressions of SOCS1 was lower in BP patients
compared to that in healthy controls; while the mRNA and protein expressions of TLR2, ITGAM and IL1R1 were higher in BP patients.
Discussion
In the present study, hub proteins such as TLR2 (degree = 25), ITGAM (degree = 14), SOCS1 (degree = 13), IL1R1 (degree = 11) were identified in PPI network based on DEGs. Subsequently, 2761 lncRNA-mRNA coexpression pairs including 182 DEGs and 77 DELs, 5629 miRNA-lncRNA interaction pairs including 1436 miRNAs and 38 lncRNAs, and 51 miRNA-mRNA interactions including 48 miRNAs and 24 DEGs were obtained. Finally, 9 miRNAs, 5 DEGs, 6 DELs, and 9 miRNA-mRNA pairs, 10 miRNA-lncRNA pairs, and 7 mRNA-lncRNA co-expression pairs were including in ceRNA regulatory network. Among them, has-miR-520a-3p and lncRNA RP11-415J8.3 were key nodes, as well as 6 up-regulated lncRNAs such as LINC00482, RP11-415J8.3, CTB-111H14.1, RP11-575L7.4, RP11-153M7.5, and RP11-76E17.3 were defined as the key DCLs in ceRNA regulatory network. These key DELs were mainly enriched to legionellosis (hsa05134, pathway), cytokine receptor activity (GO:0004896), and phospholipid binding (GO:0005543).
Given that TLR2, ITGAM, SOCS1 and IL1R1 were the core proteins in the network, we validated their expression through q-PCR and Elisa, in which it is showed that the SOCS1 was lower in BP patients while other three were higher in BP patients. It was indicated that TLR2, ITGAM, SOCS1 and IL1R1 interacting network might play an important role during the occurrence of Bell’s palsy.
As one of the toll-like receptors, TLR2 was a membrane protein and had a role in the recognition and inflammatory response [10]. Toll-Like Receptors (TLRs) are prominent as cellular sensors of extracellularly encountered whole microbes or viruses, or pathogen associated molecular patterns among Pattern Recognition Receptors (PRRs). Targeting of PRRs such as CD14, TLR4, and TLR2 in models of acute infection within which deliberate short term antagonism is achieved by systemic application of neutralizing monoclonal antibodys has been shown to effectively inhibit unwanted immune responses [11,12]. The generated anti-TLR2 scFv intrabody inhibits specifically and very efficiently TLR2 ligand-driven cell activation in vitro and ex vivo. This indicates a therapeutic potential of alphaT2ib in microbial or viral infections [13].
Although there were no direct evidence to identify the relationship between TLR2 and Bell’s palsy, a previous study reported that nasal bacterium-like particles mixed with split influenza vaccine induced influenza A virus-specific T-cell and B-cell responses via TLR2 [14]. Whereas, this kind of immunization enhanced the appearance of Bell’s palsy through the use of Escherichia coli heat-labile toxin or mutants thereof [15].
Meanwhile, Toll-Like Receptor 2 (TLR2) is expressed on immune cells in the periphery and the CNS and mediates both innate and adaptive immune responses. Recent studies have implicated TLR2 in systemic pathogenesis of adaptive immunity in Experimental Autoimmune Encephalomyelitis (EAE) and CNS TLR2 activation affects the innate but not adaptive brain immune responses [16].
In the present study, lncRNA RP11-415J8.3 and TLR2 have a co-expressed interaction, and also been enriched in Legionellosis (hsa05134, pathway). Legionella pneumophila is an intracellular gram-negative aerobic bacillus survived in the human macrophages phagosomes. Rogers et al. [17] found that live L. pneumophila infection upregulated expression of TLR2/4 when transfection into bone marrow-derived dendritic cells which had a critical role in linking innate to adaptive immunity. Moreover, L. pneumonia associated with cerebellar dysfunction and Bell’s palsy [18]. Although it has been reported that Legionella has been isolated from the facial nerve tissue of some patients with facial paralysis [19], our preliminary results also point to Legionella; however, the verification results showed that no pathogen was found in blood Legionella culture neither among patients with facial paralysis nor healthy controls. This means that we cannot conclude that Legionella pneumophila was a cause of the disease.
In addition, RP11-415J8.3 was enriched to GO:0004896: cytokine receptor activity. In the hub proteins, SOCS1 was a negative regulator in cytokine signaling, could be stimulated by a subset of cytokines, including IL2, and interferon (IFN)-γ [20]. SOCS1 acted as a modulator of IFN-γ in SOCS1-/-- mice, which is required for regulator of sensory neuron responses [21]. Moreover, SOCS1 can regulate TLR-mediated signal transduction in murine macrophages thereby down-regulating inflammatory cytokine production [22]. Importantly, during Mycobacterium tuberculosis infection, stimulating TLR2 reduced SOCS1 expression in dendritic cells [23]. Thus, SOCS1 associated with TLR2 during virus infection. Similarly, TLR2-SOCS1 interaction pairs were identified in PPI network. Therefore, TLR2-SOCS1 interactions might have a crucial role on BP of cytokine receptor activity for the occurrence of Bell’s palsy.
Interestingly, IL1R1 was a cytokine receptor from the Interleukin-1 (IL-1) receptor family, and had a key role in many cytokine induced immune and inflammatory responses [24]. Similarly, IL1R1 interacted with lncRNA RP11-415J8.3, which were enriched to GO:0004896: cytokine receptor activity. A previous study confirmed that IL-1, IL-6, and TNF-α levels were increased in serum samples from patients with Bell’s palsy compared with that of healthy populations [25].
It was reported that the expression of SOCS1 has a negative correlation with IL-1β in inflammation [26], intestinal mucositis model [27], and the decrease of SOCS1 may lead to the upregulation of TNF-α and IL-1β [28]. Therefore, it can be further speculated that there may be a correlation between SOCS1 and IL-1 receptor, IL1R1.
The last but not least, Integrin Subunit Alpha M (ITGAM) was also found high-expressed in BP patients. Integrin ITGAM/ ITGB2 is implicated in various adhesive interactions of monocytes, macrophages and granulocytes as well as in mediating the uptake of complement-coated particles and pathogens. According to the results of literature analysis, there was no obvious evidence to prove the correlation with BP and ITGAM. On the contrary, it has a more significant correlation with cancer or tumor [29], lupus erythematosus [30], rheumatoid arthritis [31], etc. Therefore, it can be concluded that ITGAM is not significantly associated with the occurrence of facial paralysis.
Conclusion
According to the data from this study, we hypothesized that the etiological factor of Bell’s palsy correlate to a complex miRNAlncRNA- mRNA interacting network and IL1R1, SOCS1 and TLR2 may involve in the onset of Bell’s palsy rather than legionella.
Although the cause of Bell’s palsy was still unclear, the present study revealed the potential pathogenesis of this disease.
Acknowledgement
This study was supported by Shanghai Municipal Health and Family Planning Commission (grant number 201840303); Shanghai Talent Development Fund (grant number 2020086); Key discipline construction found of Baoshan Hospital of Integrated Traditional Chinese Medicine and Western Medicine, Shanghai (grant number BSYYZDZK-2019-03, BSYYZDZK-2019-04).
Ethics Approval
The Institutional Ethics Committee, Baoshan Hospital of Integrated Traditional Chinese Medicine and Western Medicine, Shanghai approved the study (Approval No. 201809-03). This study has been registered at the Chinese Clinical Trials Registry (ChiCTR1800018972).
Authors’ Contributions
Conception and design: Zhidan Liu, Wei Liang; Administrative support: Zhidan Liu; Provision of study materials or patients: Chunlan Chen; Collection and assembly of data: Xiaoyan Li, Chuang Zhao; Data analysis and interpretation: Ying Zhao, Chuang Zhao, Xiaoyan Li, Zunyuan Li, Wenge Huo; Manuscript writing: All authors; Final approval of manuscript: All authors.
References
- Zhang W, Xu L, Luo T, et al. The etiology of Bell’s palsy: a review. J Neurol. 2020; 267: 1896-1905.
- Morales DR, Donnan PT, Daly F, et al. Impact of clinical trial findings on Bell’s palsy management in general practice in the UK 2001-2012: interrupted time series regression analysis. BMJ Open. 2013; 3: e003121.
- Phan NT, Panizza B, Wallwork B. A general practice approach to Bell’s palsy. Aust Fam Physician. 2016; 45: 794-797.
- Brandenburg NA, Annegers JF. Incidence and risk factors for Bell’s palsy in Laredo, Texas: 1974-1982. Neuroepidemiology. 1993; 12: 313-325.
- Tiemstra JD, Khatkhate N. Bell’s palsy: diagnosis and management. Am Fam Physician. 2007; 76: 997-1002.
- Cao J, Zhang X, Wang Z. Effectiveness comparisons of antiviral treatments for Bell palsy: a systematic review and network meta-analysis. J Neurol. 2021.
- Ritchie ME, Phipson B, Wu D, et al. limma powers differential expression analyses for RNA-sequencing and microarray studies. Nucleic Acids Res. 2015; 43: e47.
- Yu G, Wang LG, Han Y, et al. ClusterProfiler: an R package for comparing biological themes among gene clusters. OMICS. 2012; 16: 284-287.
- Szklarczyk D, Franceschini A, Wyder S, et al. STRING v10: protein-protein interaction networks, integrated over the tree of life. Nucleic Acids Research. 2014; 43: D447-D452.
- Kéri S, Szabó C, Kelemen O. Antipsychotics influence Toll-Like Receptor (TLR) expression and its relationship with cognitive functions in schizophrenia. Brain Behavior & Immunity. 2017; 62: 256-264.
- Meng G, Rutz M, Schiemann M, et al. Antagonistic antibody prevents tolllike receptor 2-driven lethal shock-like syndromes. J Clin Invest. 2004; 113: 1473-1481.
- Kanzler H, Barrat FJ, Hessel EM, et al. Therapeutic targeting of innate immunity with Toll-like receptor agonists and antagonists. Nat Med. 2007; 13: 552-559.
- Kirschning CJ, Dreher S, Maass B, et al. Generation of anti-TLR2 intrabody mediating inhibition of macrophage surface TLR2 expression and TLR2- driven cell activation. BMC Biotechnol. 2010; 10: 31.
- Keijzer C, Haijema BJ, Meijerhof T, et al. Inactivated influenza vaccine adjuvanted with bacterium-like particles induce systemic and mucosal influenza A virus specific T-cell and B-cell responses after nasal administration in a TLR2 dependent fashion. Vaccine. 2014; 32: 2904-2910.
- Mutsch M, Zhou W, Rhodes P, et al. Use of the inactivated intranasal influenza vaccine and the risk of Bell’s palsy in Switzerland. N Engl J Med. 2004; 350: 896-903.
- Luz A, Fainstein N, Einstein O, et al. The role of CNS TLR2 activation in mediating innate versus adaptive neuroinflammation. Exp Neurol. 2015; 273: 234-242.
- Rogers J, Hakki A, Perkins I, et al. Legionella pneumophila infection upregulates dendritic cell Toll-like receptor 2 (TLR2)/TLR4 expression and key maturation markers. Infect Immun. 2007; 75: 3205-3208.
- Basani SR, Ahmed SM, Habte-Gabr E. Legionnaires’ disease with facial nerve palsy. Case Rep Med. 2011; 2011: 916859.
- Chang B, Wei X, Wang X, et al. Metagenomic next-generation sequencing of viruses, bacteria, and fungi in the epineurium of the facial nerve with Bell’s palsy patients. J Neurovirol. 2020; 26: 727-733.
- Naka T, Tsutsui H, Fujimoto M, et al. SOCS-1/SSI-1-deficient NKT cells participate in severe hepatitis through dysregulated cross-talk inhibition of IFN-gamma and IL-4 signaling in vivo. Immunity. 2001; 14: 535-545.
- Turnley AM, Starr R, Bartlett PF. SOCS1 regulates interferon-gamma mediated sensory neuron survival. Neuroreport. 2001; 12: 3443-3445.
- Prêle CM, Woodward EA, Bisley J, et al. SOCS1 regulates the IFN but not NFkappaB pathway in TLR-stimulated human monocytes and macrophages. J Immunol. 2008; 181: 8018-8026.
- Srivastava V, Manchanda M, Gupta S, et al. Toll-like receptor 2 and DCSIGNR1 differentially regulate suppressors of cytokine signaling 1 in dendritic cells during Mycobacterium tuberculosis infection. J Biol Chem. 2009; 284: 25532-25541.
- Dinarello CA. Introduction to the interleukin-1 family of cytokines and receptors: Drivers of innate inflammation and acquired immunity. Immunol Rev. 2018; 281: 5-7.
- Yilmaz M, Tarakcioglu M, Bayazit N, et al. Serum cytokine levels in Bell’s palsy. J Neurol Sci. 2002; 197: 69-72.
- Wu R, Zhang F, Cai Y, et al. Circ_0134111 knockdown relieves IL-1β-induced apoptosis, inflammation and extracellular matrix degradation in human chondrocytes through the circ_0134111-miR-515-5p-SOCS1 network. Int Immunopharmacol. 2021; 95: 107495.
- Ha YJ, Choi YS, Kang EH, et al. SOCS1 suppresses IL-1β-induced C/EBPβ expression via transcriptional regulation in human chondrocytes. Exp Mol Med. 2016; 48: e241.
- Li X, Tian F, Wang F. Rheumatoid arthritis-associated microRNA-155 targets SOCS1 and upregulates TNF-α and IL-1β in PBMCs. Int J Mol Sci. 2013; 14: 23910-23921.
- Mazurek M, Mlak R, Homa-Mlak I, et al. Polymorphism of the Regulatory Region of the ITGAM Gene (-323G>A) as a Novel Predictor of a Poor Nutritional Status in Head and Neck Cancer Patients Subjected to Intensity- Modulated Radiation Therapy. J Clin Med. 2020; 9: 4041.
- Gupta V, Kumar S, Pratap A, et al. Association of ITGAM, TNFSF4, TNFAIP3 and STAT4 gene polymorphisms with risk of systemic lupus erythematosus in a North Indian population. Lupus 2018; 27: 1973-1979.
- Ramírez-Bello J, Sun C, Valencia-Pacheco G, et al. ITGAM is a risk factor to systemic lupus erythematosus and possibly a protection factor to rheumatoid arthritis in patients from Mexico. PLoS One. 2019; 14: e0224543.