Abstract
Red tides are becoming more common in aquatic ecosystems, particularly the coastal habitats which are highly influenced by climatic and anthropogenic activities. We provide the first report of a red tide event in Meda creek, west coast of India. Light and scanning electron microscopy were used to identify the bloom forming organism, while physicochemical, biological and biooptical parameters were determined to characterize the aquatic body of the Meda Creek. The dominant bloom forming organisms were observed as unarmored, spherical, dorsoventrally compressed flagellate with truncated apex, notched and rounded hypocone, displaced premedian cingulum and extending sulcus. The length wise size of the cell varied from 20 to 30.83μM, whereas, the width varied from 14 to 27.5μM. The organisms was identified as Gymnodinium sp. High Performance Liquid Chromatography (HPLC) and spectral profile of the bloom indicatedeleven major peaks corresponding to that of 19-but-fucoxanthin (52.75%), astaxanthin (9.62%), fucoxanthin (8.81%), Mgdv (6.45%), prasinoxanthin (3.35%), chlorophyll C2 (3.22%), neoxanthin (3.12%), antheraxanthin (3.14%), diadinoxanthin (2.63%) and diatoxanthin (1.38%). Chlorophyll a concentration in the bloom sample was 38.8μg/L. Water temperature, salinity, NH3-N, NO2-N, NO3-N, PO4-Pwere higher during the bloom period than the non-blooming ones, while metals including Fe, Zn, Cr, Mn and Co were lower. No death of aquatic biota was observed. We propose that eutrophication along with the warm and saline conditions provided enabling conditions for occurrence the bloom. Also, most of the pigments expressed have antioxidant role and might be purposeful for the survival of the organism in the extreme condition of temperature and salinity recorded. Proper management and monitoring measures might help mitigate further occurrences of this bloom in the light changing climate and increasing anthropogenic impacts.
Keywords: Gymnodinium sp.; Red tide; Pigment; Optical spectra; Meda creek; Indian coast
Introduction
Red tide is a natural phenomenon in which species of phytoplankton rapidly accumulate into large biomass or high concentration and discolor a body of water into red, brown, green, or other color depending on the pigment composition of the causative organism [19]. Dinoflagellates like Gymnodinium are linked with this event in fresh, brackish and marine waters of temperate, subtropical and tropical regions [8,42] where events can be sometimes associated with water quality degradation, massive fish and aquaculture kills and toxic effect on humans [4,25,26]. Such blooms have been reported [5,7,12,17,18,36,38,41].
Evidences also exist on increasing incidence and occurrence in new areas where such has not been previously reported [14,17]. Some of these occurrences are attributed to changing hydrogeological conditions associated with climatic change and increasing anthropogenic activities like nutrient enrichment and ballast water discharge [16,34]. Increasing water temperature, salinity and nutrients have been correlated with positive growth rate of Gymnodinium [30,31,36]. Physiological characteristics like high mobility, diurnal vertical migration, mixotrophy and antioxidants e.g., pigments provide ability to survive in some of these conditions [35].
Blooms of Gymnodinium are common in coastal waters like the estuaries, bays and lagoons which are characterized by sudden and wide variations in environmental conditions [3]. These ecosystemshowever provide habitat for diverse biological resources and also grounds for trade and commerce [33]. Considering such functions, occurrences of these blooms could have socio-economic impacts. Meda creek is an estuarine habitat along the west coast of India which serves important functions like fishing, irrigation and minerals. It also provides coastal geomorphic forms like geomorphic forms like beaches, spit, bars, coastal dunes, tidal channels, tidal flats, coastal cliffs, etc. which house various organisms like bivalves, gastropods, corals, algae, fishes, etc. [23].
Meda creek records varying hydrological conditions with influence from freshwater input from Vartu, Sorti, Sindhi, Falku and Kaman rivers during raining season. A dam (Medhakrik dam) constructed along its path in the south provides barrage conditions, hence reducing freshwater inflow, increasing salinity regimes and reducing nutrient availability and movement of aquatic biota. It also receives discharge from famous temples like the ancient Harshad Mata temple and other adjoining areas. Fishing activities are well evident along it [23]. On the 6th of June, 2018, we observed a red tide of Gymnodinium sp. along the creek around Miyani area (Lat. 21.84784oN, Long. 69.36975oE) when we visited for sampling.
Here, we give a first report on the occurrence of red tide of Gymnodinium sp. along the creek and attempt to compare physicochemical parameters in the water body during and outside the period of bloom in other to understand likely factors which could have contributed to bloom. We also examine the pigment profile of the bloom with view to complementing microscopy findings on identity, and to understand physiological status of blooming organism in relation to the environment.
Materials and Methods
Phytoplankton and Water Sample Collection
20 litres of water sample was filtered through a 10 micron mesh size phytoplankton net using a one Liter capacity bowl and subsequently transferred into labelled 100ml phytoplankton bottle. Samples were brought to the laboratory for study. Water samples for the determination of physicochemical parameters were also collected into appropriately labelled plastic containers, and kept in ice packed box for transport to the laboratory. Upon reaching the laboratory, the water samples (with the exception of those for pigment analysis) were stored in 4oC until further analysis. Physicochemical parameters including temperature and salinity were determined at the period of sampling in the field using a portable multi parameter refractometer.
Identification of Causative Species of Red Tide
Light microscopy and scanning electron microscopy was employed for the identification of the causal organism. In the case of light microscopy, aliquot of bloom sample was placed on a glass slide and observed at 40X magnification under a 1X70 inverted Olympus microscope. Morphological features observed were noted and photographs were taken using attached camera [44]. For scanning electron microscopy, 2mL of bloom sample was centrifuged at low speed (2,000 rpm) for 10 minutes, and the supernatant carefully discarded. 1mL of 2% osmium tetraoxide was and then incubated in 4oC for 4 hours. Cells were subsequently washed with filtered seawater, cleaned with hydrogen peroxide and incubated for 24 hours at 30oC. Afterwards, they were filtered on a 25mm diameter 0.45μM pose size membrane under low pressure and rinsed twice with distilled water to remove excess salts. The filter paper was dried in oven at 30oC, after which a small portion was cut from the center, mounted on aluminum stub and coated with gold before viewing under the scanning electron microscope [43].
Physicochemical Analysis of Water Samples
Orthophosphate (PO43-) content: Analysis of orthophosphate in water sample was carried out according to Murphy and Riley (1962). Briefly, 20μL each of ascorbic acid mixture (comprising 1g ascorbic acid dissolved in 5mL MQ water and 9N H2SO4 respectively) and mixed reagent (containing 3.6ml of 10% ammonium molybdate, 10ml 9N H2SO4 and 0.6mL potassium antimony tartrate) were added to 1mL of blank/sample/standard solution of K2HPO4 in 1.5mL Eppendorf tube. Standard solutions of K2HPO4 prepared were 0μM, 2μM, 4μM, 6μM, 8μM and 10μM. Each Eppendorf tube was vortexed to ensure proper mixing, and afterwards incubated for about 20 minute. 200μL aliquot was transferred from each tube into a 96 well plate and optical density was measured against the blank at 880nm wavelength using an Epoch 2 microplate reader. A standard calibration curve of PO43- concentration in known/standard samples against absorbance values was plotted and the relative concentration in the unknown samples was determined.
Nitrate (NO3-) content: 50μL of Gueiss reagent (containing 1 sulphanilamide: 1NED solution) was added to 1mL of blank, water sample and standard solutions of NaNO3 (comprising 0μM, 5μM, 15μM, 20μM, 25μM and 30μM concentration) in 1.5mL tube. Afterwards, all the tubes were vortexed and for 20 minutes at 65oC. Hereafter, 200μL aliquot from each tube was transferred unto a 96 well plate and absorbance was read against blank sample at 540 nm using Epoch 2 microplate reader. The relative concentration of NO3- in the water sample was calculated from the calibration curve of NO32- concentration against absorbance values of the standard solutions [15].
Nitrite (NO2-) content: To each of one milliliter of blank, water sample and standard solutions (0μM, 5μM, 15μM, 20μM, 25μM and 30μM) of NaNO2, 50μL of Guiess reagent was added in a 1.5mL tube. The mixture was vortexed and incubated for 20 minutes. 200μL aliquot was taken from each tube into a 96 well plate, and absorbance was read against the blank at 540nm using Epoch 2 microplate reader. Standard calibration curve was plotted and the unknown concentration in the sample was determined [15].
Ammonia (NH3) content: 5ml of reagent A (Phenol-sodium nitroprusside solution) and B (Alkaline hypochlorite) were respectively added 100μL of blank/water sample/ standard solutions of NH4Cl; 0μM, 10μM, 20μM, 40μM, 60μM, 80μM and 100μM. Each mixture was vortexed and placed in the incubator at 37oC for 15 minutes. After cooling, 200μL aliquot of each transferred into a 96 well plate and absorbance was read at 625nm against the blank. Calibration curve was also constructed and unknown concentration in the sample was obtained [47].
Dissolved oxygen content: Water sample was collected into 150mL reagent bottles, and 2ml each of MnSO4 (winkler A) solution and alkali-iodide-azide (winkler B) agent was added using separate syringe. The bottles were stoppered and inverted a few times to ensure proper mixing. The samples were brought to the laboratory for further analysis. 2mL of conc. H2SO4 was slowly added to the sample through the neck of the bottle. The bottle was stoppered and inverted several times until dissolution of precipitate formed in the previous step was complete and golden to pale yellow colouration was observed. 50mL aliquot was taken and 2 drops of starch solution was added. The mixture was titrated against 0.0125M Na2S2O3 solution until a colorless end point was reached [1,2]. The volume of titrant used was recorded in mg/l, and the dissolved oxygen calculated as thus;

Where; M = molarity of the thiosulphate solution, V = volume of thiosulphate used for titration,
V1= volume of the bottle with stopper in place, V2= volume of aliquot taken for titration.
Elemental Analysis
0.6mL of conc. HNO3 was added to 29.4mL of water sample in conical flasks which have been pre-soaked in 10% nitric acid. The mixture was shaken, incubated at least overnight. Prior to analysis, whole as well as one-tenth and one-hundredth dilutions were made and filtered through 0.22μM syringe into separate new 15mL falcons before analysis by ICP-OES. 15mL of sample was used for the analysis. Analysis of Fe, Co, Cu, Mo, Zn, Mn and Sr concentration was carried out on the filtered whole sample, while that of B was carried out on the one-tenth dilution, and Na, K, Mg and Ca on the one-hundredth dilution [10].
Determination of Chlorophyll A
100mL of sea water was filtered through whatman GF/F glass fibre filter paper (25mm). The filter paper was transferred into 90% methanol (40mL) in amber falcon tube, covered tightly and kept in the freezer at -20oC overnight. The tube was hereafter centrifuged at 8500rpm for 20 minutes at 4oC. The supernatant portion containing pigment extract was carefully recovered and transferred into fresh amber colored falcon tube. Absorbance values were read against blank (90% methanol) on UV-3600 Shimadzu spectrophotometer using a cuvette at the wavelength of 630nm, 647nm, 664nm and 750nm. Value obtained at 750nm was subtracted from the other three wavelengths to give turbidity corrected value (Lisha et al. 2012). Chlorophyll a was calculated thus;

Where;
v = volume of 90% methanol used in litre, V = volume of water sample in litre,
L = light path of cuvette in cm, E664 = corrected value of absorbance at 664nm,
E647 = corrected value of absorbance at 647nm, E630 = corrected value of absorbance at 630nm.
Pigment Composition Study Using HPLC
30mL of growing culture was filtered through 0.45μM whatman GF/F glass fibre filter paper (25mm). The filter paper was then transferred into 6mL 90% acetone (HPLC grade) in amber falcon tube and covered tightly. The tubes were kept in the refrigerator at 4oC for 12 hours, and later centrifuged at 8500rpm for 15min at the same temperature. The supernatant was carefully transferred into a fresh amber falcon by means of a pipette. 100μL of the same was mixed with 250μL of 28mM tetra butyl ammonium acetate (pH 6.5) buffer in brown HPLC glass vial and maintained at 4oC till analysis was carried out [27]. Pigments were analyzed using Shimadzu HPLC system (Kyoto, Japan) equipped with LC-9A pump with low pressure gradient unit FCV-9AL, an on-line degasser DGU-3A, a photodiode array UV-vis detector SPD-M10AV fitted with an Eclipse XDB C8 column (150x4.6, with 3.5 micron particle size). A binary solvent system comprising; solvent A: 28mM Tetra butyl ammonium acetate: methanol (70:30) and solvent B: methanol was used for the pigment analysis. Solvent delivery was programmed of four successive linear gradients: (1) solvent A 95%, solvent B 5% at 0 min.; (2) 5% solvent A: 95% solvent B at 22 min.; (3) 5% solvent A: 95% solvent B at 29 min. and (4) 95% solvent and 5% solvent B at 32 min, then isocratically until after appearance of β-carotene. Pigments were identified with Shimadzu Class-VP software and by comparing pigment spectra and retention times with known standards.
Spectral Signature of Gymnodinium sp
UV absorption spectra: 100mL of water sample was filtered through what man GF/F glass fibre filter paper (25mm). The filter paper was transferred into 90% methanol (40mL) in amber falcon tube and covered tightly. Sonication was here after performed for about 20 seconds using a Fisher Scientific Model 60 Sonic Dismembrator and the sample was stored in the freezer at -20oC overnight. Centrifugation was performed at 8,500 rpm for 20mins at 4oC and the supernatant was carefully transferred into new amber falcon tube. Absorption measurement was carried out from 300 to 800nm wavelength using a UV-3600 Shimadzu spectrophotometer [27].
UV reflection spectra: 100mL culture was filtered unto a 0.45μM what man GF/F glass fibre filter paper (25mm). A similar kind of filter paper was soaked with filtered seawater and used as a blank. Triplicate measurement of reflection was carried out from wavelengths 400- 800nm using a UV-VIS spectrophotometer, and average values were used [27].
Results and Discussion
Morphological Description of Causative Bloom Organism
Bloom condition observed in Meda creek is shown in (Figure 1). Light and electron microscopy of the bloom forming organism shows naked, spherical, dorsoventrally flattened, unarmored single cells with the dimensions; length: 20–30.83μM and width: 14-27.5μM.. Cingulum is pre-median, well defined, descending and displaced to about one-fourth of the cell length. Apex is truncated, while the hypocone is notched and rounded. Sulcus is present, deep and extends slightly and narrowly through the epicone (Figure 2). Based on these features observed, the organism responsible for the bloom was identified as belonging to the genus Gymnodinium and named as Gymnodinium sp. [24,39].
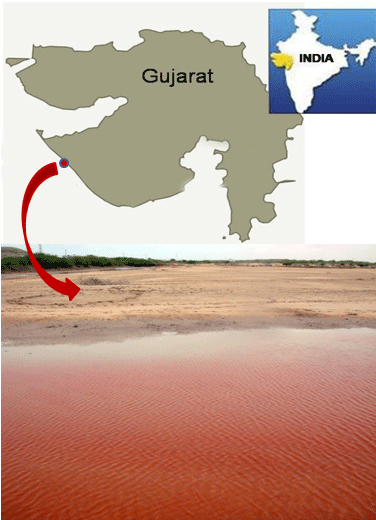
Figure 1: Location of Gymnodinium sp. red tide.
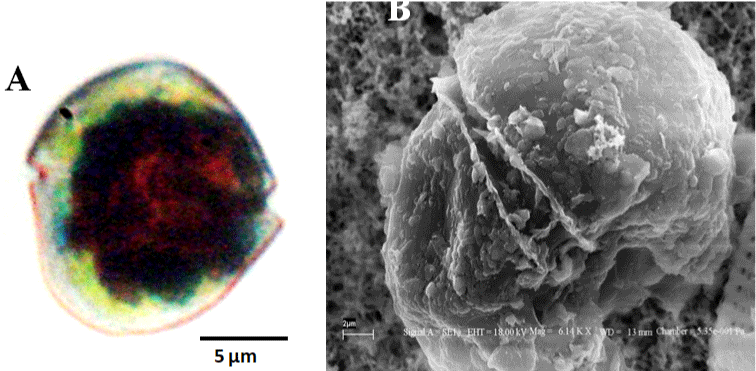
    Figure 2: Red tide forming Gymnodinium sp. A. Light microscopy of the Vegetative cell. Scale = 10 μm. B. Scanning Electron microscopy of the same. Scale =

2 μm.
Physicochemical Characteristics
Water temperature and salinity were observed to be high for all
the periods sampled. However, higher values were recorded during the bloom period (35oC and 54) as compared with before (29oC and
53) and after bloom (30.83oC and 50 respectively) (Figure 3). The high
values recorded could be associated with the shallow nature of the
water body (generally below 0.3m in depth) which makes it easily
susceptible to the effect of heating and surface evaporation. NO2-N,
NO
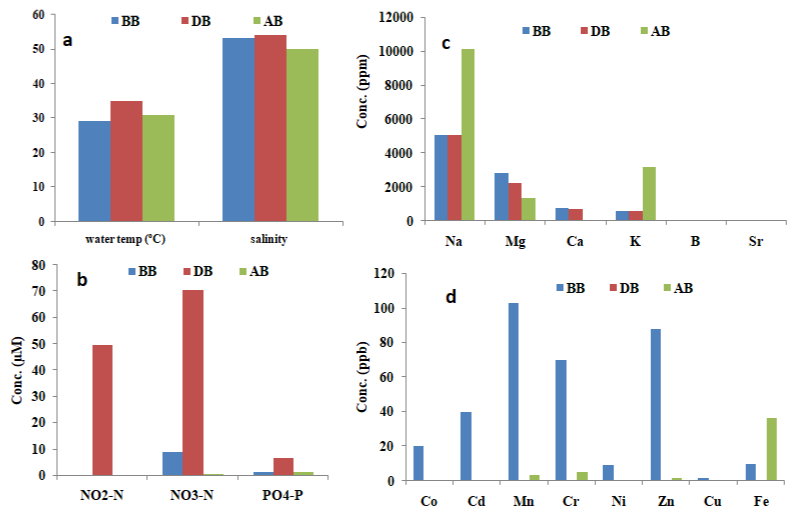
    Figure 3: Physicochemical parameters of Meda creek. BB –Before bloom (Feb., 2018), DB- During bloom (June, 2018), AB- After bloom (Jan., 2019). (a) physical

parameters (b) nutrient parameters (c) major elements (d) trace elements.
Water temperature, salinity, NH3-N, NO2-N and NO3-N values obtained in the current study exceeds those of Labib (2000) reported for G. catenatum bloom in the Eastern Harbour of Alexandria, Egypt (27-28oC, 30-37.5, 36.5μM, 6.12μM, 5.9μM respectively) and Heil et al. [20] for Gymnodinium sp. bloom in Kuwait Bay (26.9-28.6oC and 41.3-42.6 respectively). Trace metal concentration in the bloom water sample was generally observed to be low. Co, Cr, Ni, Pb, Cu and Sr were below detectable limit, while Cd, Mn, Zn and Fe measured 0.002ppb, 0.016ppb, 0.063ppb and 0.04ppb respectively. Na (1162.0ppm), Mg (2273.0ppm), K (623.7ppm), B (10.6ppm) values were moderate (Figure 3).
HPLC Pigment Analysis
HPLC chromatogram of pigments of the bloom water shows 11 distinct peaks comprising mainly of carotenoids including 19-butfucoxanthin, astaxanthin, fucoxanthin, Mgdv, prasinoxanthin, antheraxanthin, neoxanthin, diadinoxanthin, 19-Hex-fuco, diatoxanthin, and chlorophyll C2 (Figure 4). This pigment profile is comparable to those reported for Gymnodinium microreticulatum from the Australian coast [8], Gymnodinium sp. from Chile [11], G. litoralis from the Mediterranean Sea [39] and G. catenatum from Portuguese coast [40]. Mainly, carotenoids function as accessory light harvesting pigments in plants, and also protective from photo oxidative and other stress related damage [13,29,46]. 19-butfucoxanthin (52.75%), astaxanthin (9.62%) and fucoxanthin (8.81%) were the predominant pigments in this study (Table 1), and this agrees with the observation of Carreto et al. [11] during a Gymnodinium sp. bloom in Southern Chile. However, their production in microalgae in relation to high salinity and temperature conditions has not been reported.
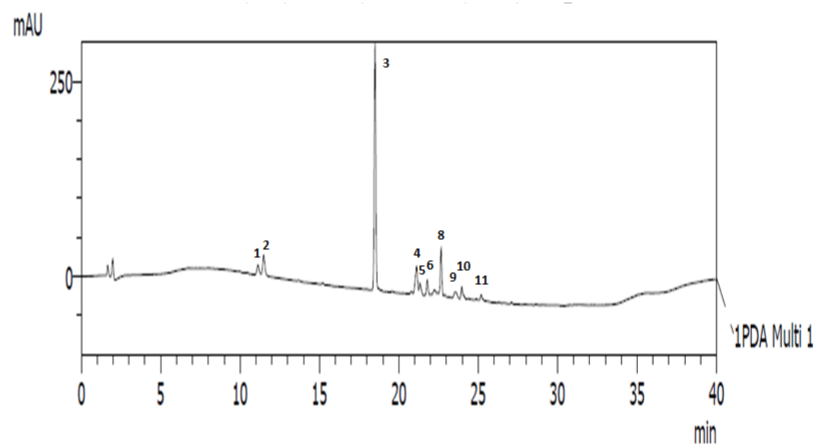
    Figure 4: HPLC chromatogram of extracted pigments from Gymnodinium sp. red tide at 450nm 1- Chl C2, 2- Mgdv, 19-but-fucoxanthin, 4-fucoxanthin, 5-

neoxanthin, 6- prasinoxanthin, 7- 19-Hex-fuco, 8- astaxanthin, 9- diadinoxanthin, 10-antheraxanthin, 11- diatoxanthin.
    S/No.

    Pigments

    Composition (%)


    1

    Chl    C2

    3.22


    2

    Mgdv

    6.45


    3

    19-but-fucoxanthin

    52.75


    4

    Fucoxanthin

    8.81


    5

    Neoxanthin

    3.12


    6

    Prasinoxanthin

    3.35


    7

    19-Hex-fuco

    1.98


    8

    Astaxanthin

    9.62


    9

    Diadinoxanthin

    2.63


    10

    Antheraxanthin

    3.14


    11

    Diatoxanthin

    1.38
Table 1: Pigment composition of Gymnodinium sp. red tide.
Absorption and Reflectance Spectra
Absorption spectrum of the bloom sample extracted in methanol shows two broad peaks centered at 445nm and 670nm respectively (Figure 5). The initial peak at 445nm is linked with the presence of fucoxanthin and its derivatives [45,48]. Likewise, the other prominent absorption feature at 670nm validates the presence of chlorophyll a, as the pigment fluoresces at the red to near infrared wavelengths between 660nm and 680nm [46]. The shoulder recorded in the region of 468 and 480nm of zeoxanthin, diadinoxanthin and or diatoxanthin [28]. As presented in the reflectance spectra (Figure 6), the 481nm peak recorded is characteristic of chlorophyll a, while that of 650nm could be associated with the presence of chlorophyll b [6]. The trough at 448nm, 535nm and 670nm is characteristic of beta carotene, chlorophyll b and a respectively [21].
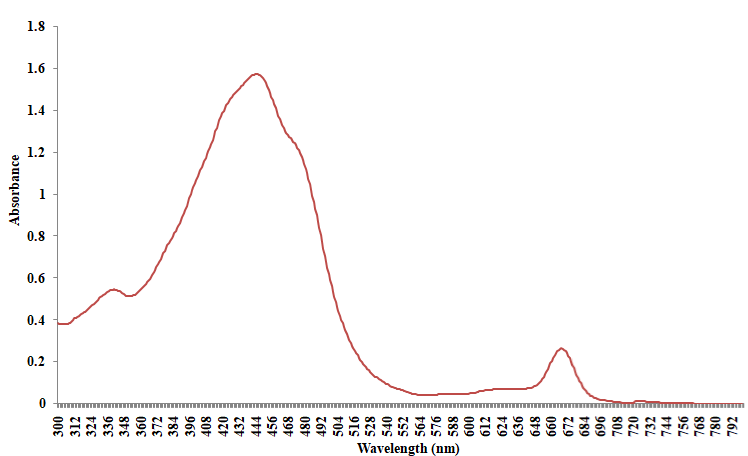
Figure 5: Absorption spectra of Gymnodinium sp red tide (methanol extract).
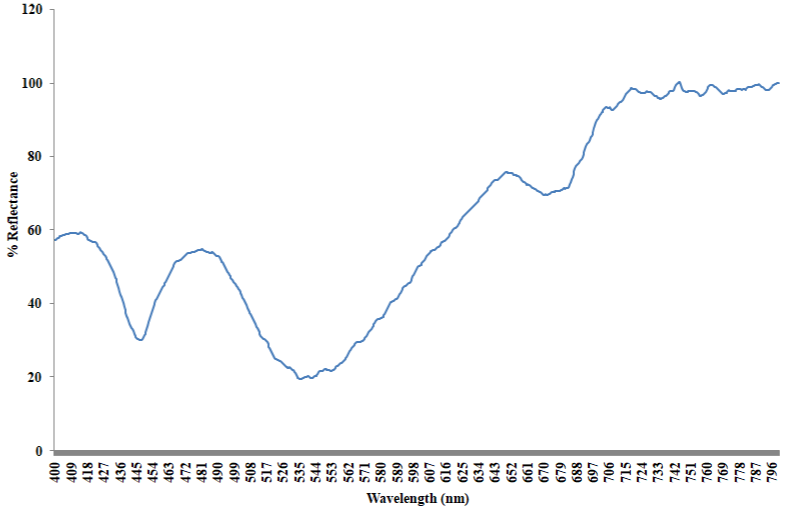
Figure 6: Reflectance spectra of Gymnodinium sp (intact cells).
Conclusion
The findings of this study provide insight that high nutrient levels and water temperature along the creek favored occurrence the red tide of Gymnodinium sp. This is due to the remarked increase in the values recorded during the bloom period, as compared to periods when there was no bloom. It also shows that the organism is thermal and halo tolerant. Abundance of antioxidant pigments like astaxanthin, fucoxanthin, etc.observed might be one of its strategy for coping in these conditions. In the light of climate change and increasing anthropogenic activities, frequent blooms of this organism might occur. Hence, proper management measures to reduce occurrence of such in future would be highly beneficial.
Acknowledgement
The authors are thankful to Mr. Harshad Brahmbhatt, and Dr. Arun Das Analytical Section, CSIR-CSMCRI for helping HPLC standardization and LCMS-MS study. This work is financially supported by the Space Applications Centre (ISRO), Ahmedabad, India. This contribution has CSIR-CSMCRI PRIS registration number 062.
References
- Ademoriti CMA. Standard methods for water and effluent analysis. Ibadan, Nigeria: Foludex Press Ltd. 1996; 40-3.
- American Public Health Association (APHA). Standard methods for the examination of water and waste water. Philadelphia: American society for testing & materials. 1992; 35-6.
- Anderson DM, Cembella AD, Hallegraeff GM. Progress in understanding harmful algal blooms: paradigm shifts progress in understanding harmful algal blooms: paradigm shifts and new technologies for research, monitoring, and management. Annu Rev Mar Sci. 2012; 4: 143-76.
- Band-schmidt CJ, Bustillos-Guzmán JJ, López-Cortés DJ, Gárate-Lizárraga I, Núñez-Vázquez EJ, Hernández-Sandoval FE. Ecological and Physiological Studies of Gymnodinium catenatum in the Mexican Pacific: areview. Mar Drugs. 2010; 8: 1935-61.
- Band-schmidt CJ, Durán-riveroll LM, Bustillos-guzmán JJ, Leyva-Valencia I, López-Cortés DJ, Núñez-Vázquez EJ, et al. Paralytic toxin producing dinoflagellates in Latin America: ecology and physiology. Front Mar Sci. 2019; 6: 1-39.
- Bernardo N, Alcântara E, Watanabe F, Rodrigues T, Carmo A, Gomes A, et al. Glint removal assessment to estimate the remote sensing reflectance in in land waters with widely differint optical properties. Remote Sens. 2018; 10: 1655.
- Bhaskar PV, Roy R, Gauns M, Shenoy DM, Rao VD, Mochemadkar S. Identification of non-indigenous phytoplankton species dominated bloom off Goa using inverted microscopy and pigment (HPLC) analysis. J Earth Syst Sci. 2011; 120: 1145-54.
- Bolch C. Gymnodinium microreticulatum sp. nov. (Dinophyceae): A naked, microreticulate cyst-producing dinoflagellate, distinct from Gymnodinium catenatum and Gymnodinium nolleri Gymnodinium catenatum and Gymnodinium nolleri. 1999. 2019; 38: 301-313.
- Bolch C. Gymnodinium microreticulatum sp. nov. (Dinophyceae): A naked, microreticulate cyst-producing dinoflagellate, distinct from Gymnodinium catenatum and Gymnodinium nolleri Gymnodinium catenatum and Gymnodinium nolleri. 1999. 2019; 38: 301-313.
- Bozkurt E, Eliri O, Kesiktas M. Analysis of heavy metals in seawater samples collected. J Recreat Tourism Reserach. 2014; 1: 39-47.
- Carreto JI, Seguel M, Montoya NG, Clement A, Carignan MO. SHORT COMMUNICATION Pigment profile of the ichthyotoxic dinoflagellate Gymnodinium sp. from a massive bloom in southern Chile. J Plankton Res. 2001; 23: 1171-5.
- Costa PR, Robertson A, Quilliam MA. Toxin Profile of Gymnodinium catenatum (Dinophyceae) from the Portuguese Coast, as Determined by Liquid chromatographytandem mass spectrometry. Mar Drugs. 2015; 13: 2046-62.
- Galasso C, Corinaldesi C, Sansone C. Carotenoids from marineorganisms: biologicalfunctions and industrialapplications. Antioxidants (Basel). 2017; 6: 96.
- Garate-Lizarraga I, Diaz-Ortiz J, Torres-Jaramillo A, Alarcon-Romero MA, Lopez-Silva S. Cochlodinium polykrikoides and Gymnodinium catenatum in Bahía de Acapulco, Mexico (2005-2008). Harmful Algae News. 2009; 40: 8-9.
- García-robledo E, Corzo A, Papaspyrou S. A fast and direct spectrophotometric method for the sequential deter- mination of nitrate and nitrite at low concentrations in small volumes. Mar Chem. 2014; 162: 30-6.
- Gomez F. The toxic dinoflagellate Gymnodinium catenatum: an invader in the Mediterranean Sea. Acta Bot Croat. 2003; 62: 65-72.
- Gomez F, Claustre H. Spreading of Gymnodinium catenatum Graham in the western Mediterranean Sea. Harmful Algae News. 2001; 22: 1-3.
- Gómez F, Echevarría F, García CM, Prieto L, Ruiz J, Reul A, et al. Microplankton distribution in the Strait of Gibraltar: coupling between organisms and hydrodynamic structures. J Plankton Res. 2000; 22: 603-17.
- Hartigan-go K, Bateman DN. Redtide in the Philippines. Hum Exp Toxicol. 1994; 13: 824-30.
- Heil CA, Glibert PM, Al-Sarawi MA, Faraj M, Behbehani M, Husain M. First record of a fish-killing Gymnodinium sp. bloom in Kuwait Bay, Arabian Sea: chronology and potential causes. Mar Ecol Prog Ser. 2001; 214: 15-23.
- Johnson MP. Photosynthesis. Essays Biochem. 2016; 60: 255-73.
- Labib W. Dinoflagellate ”brown tides” Alexandria, Egypt waters during 1997- 1998. Pakistan. J Mar Sci. 2000; 9: 33-49.
- Lakhmapurkar J, Bhatt N. Geo-environmental appraisal of the Meda Creek, Saurashtra, Gujarat, Saurashtra. J Geol SocIndia. 2010; 75: 695-703.
- Larsen J. Unarmoured dinoflagellates from Australian waters I. The genus Gymnodinium (Gymnodiniales, Dinophyceae). Phycologia. 1994; 33: 24-33.
- Lu S, Hodgkiss IJ. Harmful algal bloom causative collected from Hong Kong waters. Hydrobiologia. 2004; 512: 231-8.
- Mackenzie AL, Mackenzie AL. The risk to New Zealand shellfish aquaculture from paralytic shellfish poisoning (PSP) toxins. NZJ Mar Freshw Res. 2014; 48: 430-65.
- SK, Patel VR, Temkar G, George BM, Raman M. Bio-optic characterization of Discosphaera tubifer bloom occurs in an overcrowded fishing harbour at Veraval, India. Environ Monit Assess. 2015; 187: 597.
- Matsuda O, Tanaka A, Fujita T, Iba K. Hyperspectral imaging techniques for rapid identification of Arabidopsis mutants with altered leaf pigment status. PlantCell Physiol. 2012; 53: 1154-70.
- Mcelroy JS, Kopsell DA. Physiological role of carotenoids and other antioxidants in plants and application to turf grass stress management. NZJ Crop Hortic Sci. 2009; 37: 327-33.
- Montoya NG, Akselman R, Carignan MO, Carreto JI. Pigment profile and toxin composition during a red tide of Gymnodinium catenatum Graham and Myrionecta rubra (Lohman) Jankowski in coastal Pigment profile and toxin composition during a red tide of Gymnodinium catenatum Graham and Myrionecta rubra. Afr J Mar Sci. 2006; 28: 199-202.
- Moreira-gonzález A, Seisdedo-losa M, Munoz-Caravaca A, Comas-Gonzalez A, Alonso-Hernandez C. Spatial and temporal distribution of phytoplankton as indicator of eutrophication status in the Cienfuegos Bay, Cuba. J Integr Coast Zone Manag. 2014; 14: 597-609.
- Murphy J, Riley JP. A modified determination single solution method for the of phosphate in natural waters. Anal Chim Acta. 1962; 27: 31-6.
- Nayak S. Coastal zone management in India - present status and future needs. Geo pat Inf Sci. 2017; 5020: 1-10.
- Okolodov YB, Merino-Virgilio FC, Herrera-Silveira JA, Espinosa-matias S, Parsons ML. First record of Gymnodinium cf. catenatum and other potentially toxic planktonic dinoflagellates in southern Cuba. Harmful Algae. 2009; 40: 14.
- Pitcher GC, Figueiras FG, Hickey BM, Moita MT. The physical oceanography of upwelling systems and the development of harmful algal blooms. Prog Oceanogr. 2011; 85: 5-32.
- Quijano-scheggia S, Olivos-ortiz A, Bustillos-guzmán JJ, Garcés E, Hernández-sandoval FJ, López-cortés DJ. Bloom of Gymnodinium catenatum in Bahía Santiago and B. Bloom of Gymnodinium catenatum in Bahía Santiago and B. Manzanillo, Colima, Mexico. Rev Biol Trop. 2012; 60: 173-86.
- Quijano-scheggia S, Olivos-ortiz A, Bustillos-guzmán JJ, Garcés E, Hernández-sandoval FJ, López-cortés DJ. Bloom of Gymnodinium catenatum in Bahía Santiago and B. Bloom of Gymnodinium catenatum in Bahía Santiago and B. Manzanillo, Colima, Mexico. Rev Biol Trop. 2012; 60: 173-86.
- Rangel I, Silva S. First Records of Gymnodinium catenatum, Gambierdiscus toxicus and Pyrodinium bahamense on nothern Luanda coast, Angola. Harmful Algae News. 2006; 32: 10-11.
- Reñé A, Satta CT, Garcés E, Massana R, Zapata M, Anglès S, et al. Gymnodinium litoralis sp. nov. (Dinophyceae), a newly identified bloomforming dinoflagellate from the NW Mediterranean Sea. Harmful Algae. 2011; 12: 11-25.
- Ruivo M, Amorim ANA, Cartaxana P. Effects of growth phase and irradiance on phytoplankton pigment ratios: implications for chemotaxonomy in coastal waters. J Plankton Res. 2011; 33: 1012-22.
- Smith KF, Rhodes LL, Selwood AI, Marfell MJ, Zeewoldt CM. First record of dinoflagellate Gymnodinium catenatum Graham (1943) from Lakes Entrance, Gippsland Lakes, Australia. Harmful Algae News. 2007; 34: 1-16.
- Thessen AE, Patterson DJ, Murray SA. The taxonomic significance of species that have only been observed once: the genus Gymnodinium (Dinoflagellata) as an example. PLOS ONE. 2012; 7: e44015.
- Thomas CR. Identifying marine phytoplankton. In: Hasle R, Syvertsen EE, editors, Diatoms, marine. San Diego: Harcourt Brace & Company. Academic Press. 1996; 5-361.
- Verlencar XN, Desai S. Phytoplankton identification manual, first National Institute of Oceanography Disclaimer, Paula D, Goa, editors; 2004.
- Wang LJ, Fan Y, Parsons RL, Hu GR, Zhang PY, Li FL. A rapid method for the determination of fucoxanthin in diatom. Mar Drugs. 2018; 16: 33.
- Warner RA, Fan C. Optical spectra of phytoplankton cultures for remote sensing applications: focus on harmfulalgal blooms. Int J Environ Sci Dev. 2013; 4: 94-8.
- Weatherburn MW. Phenol-hypochlorite reaction for determination of ammonia. Anal Chem. 1967; 39: 971-4.
- Zapata M, Fraga S, Rodríguez F, Garrido JL. Pigment-based chloroplast types in dinoflagellates. Mar Ecol Prog Ser. 2012; 465: 33-52.
