
Research Article
J Plant Chem and Ecophysiol. 2016; 1(1): 1005.
Seasonal Variation of Mono-, Di- and Polysaccharides in British Bluebells (Hyacinthoides non-scripta)
Dotsha Raheem1,2 and Vera Thoss¹*
¹School of Chemistry, Bangor University, Bangor, UK
²College of Science, Salahaddin University, Erbil, Kurdistan, Iraq
*Corresponding author: Vera Thoss, School of Chemistry, Bangor University, Bangor, LL57 2UW, Wales, UK
Received: March 21, 2016; Accepted: April 29, 2016; Published: May 02, 2016
Abstract
British bluebells (Hyacinthoides non-scripta (L.) Chouard ex Rothm.) were studied for their carbohydrate content, phenology and biomass allocation and the associated physiological changes. Carbohydrate content of different parts of the plant, including roots, bulbs, leaves, scapes and flowers, were studied as total non-structural carbohydrates. Biomass and carbohydrate analysis results showed greater allocation to bulbs compared to any other vegetative part. Analysis of fructans in the bulbs showed the presence of large proportions of the polysaccharide comprising about 77% DW in mid-June 2014. The lowest fructan content of 41% DW was found at the start of re-growth in January- February 2015. The mono- and disaccharide pool in the bulbs showed high concentrations at the start of the growth period suggesting depolymerisation of fructans at this stage and their mobilisation to the growing shoots. MALDI-TOF analysis of bulb fructans showed the dominance of DP3 and DP4 chain fructans with the presence of other longer chains up to DP9 at the end of the vegetative stage in July until shoot emergence in March.
Keywords: Bluebells (Hyacinthoides non-scripta); Seasonal variation; Fructans; Mono- and disaccharides
Introduction
Carbohydrates are the starting materials for the bio-economy as the current reliance of petroleum as feedstock for the chemical industry needs to reduce in order to dampen climate change [1]. Hence a better understanding of carbohydrates in plants, particularly the production and allocation of carbohydrates and their specific chemical form, such as fructans, starch or cellulose, are important knowledge that underpins the sustainable use of renewable resources. This study investigate a perennial bulbous plant British bluebells (Hyacinthoides non-scripta (L.) Chouard ex Rothm.) For its carbohydrate content and composition [2,3]. Compared with most temperate zone plants, bluebells are unusual in their phenology with growth beginning in late summer, above ground emergence in winter and flowering in early spring. Dormancy is during the summer months. Reproduction is predominantly through seeds and the seeds were already identified as a potential feedstock for the supply of oil [4].
Throughout their life, plants are challenged by competition from other plants, herbivory, climate and availability of resources. The survival, success and dominance of a plant in a specific ecological niche has evolved through the adaptation of its physiological traits that is reflected in its chemical makeup. The effects of environmental parameters, such as the availability of sunlight, nutrient supply, habitat and competition, on British bluebells were studied by Blackman and Rutter in their paper series [5-9]. Sunlight was identified as the limiting factor that influences the growth, function and uptake of N, P and K nutrients. The effect of competition from other plants reflected the amount of sunlight available for bluebells in the different habitats. Bluebells are woodland species where they exploit sunlight available in early spring, and most of the annual growth is achieved before the tree canopy is closed and light intensity decreases [2]. The open tree canopy can provide protection from heat loss during the cold nights in spring [10]. In the south - west of England and Wales bluebells are also found accompanied by bracken [9]. The rate of assimilation and hence the growth of bluebell in bracken communities is often higher than it is in woodlands [11]. The co-existence of the two plants might be down to a number of factors including that the active growth phase of bluebell is completed before the formation of the bracken canopy, which means more availability and higher intensities of light during active growth. Additionally, the heavy shade cast by the bracken canopy will suppress the growth of other species and hence decreases competition on resources [9]. Temperature, as another major factor controlling the start of different phenological phases of the plantâs life [12,13], triggers change and interconversion of carbohydrates [14] for regrowth, leaf emergence, flowering and seed production and germination [15]. One successful survival strategy adapted by perennial plants is the availability of secure reserves of carbohydrates represented as either starch or fructan in underground storage organs, such as rhizomes, tubers or bulbs. While starch or sucrose is most often stored, a smaller proportion of flowering plants (about 15%) are found to store fructans as their main reserve [16,17]. Bluebell bulbs contain 50% of dry weight as fructan. In addition, fructans were found to comprise 73% of the vacuolar carbohydrate concentration in the shoots with no significant presence of starch [18]. Hence bluebells belong to the small proportion of plants that store fructan as the main reserve carbohydrate.
Besides being a source of carbon and energy during growth, fructans offer a number of other benefits. Vacuolar fructan synthesis, that entails the addition of fructose units to a terminal glucose, lowers sucrose concentration in the cell and thus reduces osmotic pressure and prevents sugar-induced feedback inhibition of photosynthesis [19]. Fructans are mainly present in plants in regions exposed to seasonal drought or frost, therefore its accumulation has been linked to stress resistance [16]. When fructans and starch coexist in a plant it is found that starch is mainly consumed during growth while the fructan reserves undergo much less change. This has been interpreted as that the plant mainly uses up the starch as a source for carbon and energy during re-sprouting and early growth, while fructans can be involved in additional functions such as osmotic regulators and controlling water flux and in stress tolerance [16,20,21].This work assesses the content and composition of carbohydrates in bluebells in a bluebell-bracken dominated plant community by identifying and quantifying the different types of sugars present, following their allocation to different organs and their variation in response to different physiological changes throughout the plantâs life cycle.
Materials and Methods
Chemicals
Formic acid, HCl (both analytical reagent grade), and methanol, acetonitrile, hexane and water (HPLC grade) were purchased form Fisher Chemical, UK. 1-Kestose â„99%, pyridine 99.8%, fructose â„99%, glucose â„99.5%, fructose â„99%, sucrose â„99.5% and hydroxylamine hydrochloride 99% (reagent plus grade) were from Sigma-Aldrich. The silylation reagent was N, O-bis (trimethylsilyl) trifluoroacetamide: trimethylchlorosilane (BSTFA: TMCS (99:1)) and obtained from Supelco. Ethyl palmitate â„95% was from SAFC, USA.
Sample collection
Bluebell plants were collected in an area located at 250m above sea level in the Snowdonia National Park (Llanberis, United Kingdom). The site is classified as rough grazing for agricultural purposes, with well-drained and infertile soils, and falls under the upland vegetation type U20a (Pteridium aquilinum-Gallium saxatile community U20, Anthoxanthumodoratum sub-community U20a) [22]. It forms part of a Manod Association (Cranfield University 2015). On the site a grid measuring approximately 40 x 25m and divided in 144 quadrants was applied. At each sampling occasion, alternate quadrants were sampled in duplicate by using a stainless steel (5mm thick) square hollow section measuring 20cm by 20cm wide and 30cm long. The collection scheme followed the plantâs growth pattern and thus weekly from the start of above ground growth to end of flowering (March- June), fortnightly at the end of the flowering season until dormancy (June-August) and once a month during the subterranean phase of the plantâs life (September- December). Samples were collected always at the same time, between 9:00 am and 11:00 am to minimise the effect of diurnal variation.
In the laboratory, the bluebell plants were separated, washed with deionised water to remove dirt and soil. The plants were then divided into roots, bulbs, leaves, scapes and flowers for Total Non-Structural Carbohydrate (TNC) analysis or divided into shoots (leaves, scapes and flowers) and bulbs (bulbs and roots) for mono-, disaccharides and fructan analysis. Samples were then freeze-dried using CHRIST Alpha 1-2 LD plus freeze-dryer connected to Vaccubrand, Germany, vacuum pump. The difference between Fresh Weight (FW) and Dry Weight (DW) was used to calculate the dry matter content. The freeze-dried samples were finally ground into a fine powder using a porcelain mortar and stored at -20°C until further analysis.
Total Non-structural Carbohydrates (TNC)
All plant parts were analysed in duplicate for total non-structural carbohydrates. Approximately 20 mg of powdered freeze-dried sample was placed in a 25 mL glass vial and mixed with 5 mL of 2M HCl prepared in 50% methanol (MeOH). The vials were closed and heated on a block heater (Stuart, SBH130D/3) at 95°C for 2 h. The reaction mixture was then filtered (Qualitative filter papers, Fisherbrand) and made up to 10 mL with 50% MeOH. Carbohydrate content was measured as Hydroxymethylfurfurals (HMF) after injecting (20 μL) into a Dionex Ultimate 3000 High Performance Liquid Chromatography system equipped with a UV-VIS diode array variable wavelength detector and an Intersil ODS-3 column (5μm, 4.6mm x 150mm). A gradient elution scheme was applied using water and acetonitrile (MeCN) both acidified with 0.1% formic Acid (FA) from 0 to100% MeCN in 30 min. Samples were monitored at 280 nm. A series of 1-kestose solutions with concentrations ranging from 0.125 - 2.0 mg mL-1 were hydrolysed under the same conditions and used to construct the calibration curve. The software Chromeleon7 was used for system operation and data analysis.
Mono- and disaccharides
Mono and disaccharides were analysed following the methods described by [23] and [24] whereby, mono- and disaccharides are converted into oxime-trimethyl silyl ethers and analysed by Gas Chromatography Mass Spectrometry (GC-MS). The method was optimized for bluebell samples in terms of initial sample processing and preparation, reaction time and temperature and finally the extraction and clean-up of the product.
Duplicate samples of approximately 5 mg of freeze-dried powdered bulbs were mixed in 2 mL glass vials with 100 μL of pyridine containing 0.5 mg mL-1 of fructose as procedural standard, followed by 100 μL of a solution containing 50 mg mL-1 of NH2OH. HCl in dry pyridine. The vials were heated on a block heater at 60°C for 3 h with occasional gentle mixing and then left to cool to room temperature (~20°C) before 100 μL of BSTFA: TMCS (99:1) was added. The resulting solution was left to react at room temperature for 30 min. Thereafter the reaction product was extracted by adding 700 μL of hexane containing 0.1 mg mL-1 of ethyl palmitate as internal standard, vortex-mixed for 1 min then 500 μL de-ionised water was added to wash off inorganic salts and decompose any excess unreacted reagents. The solution was vortex-mixed for another minute and submitted for GC-MS analysis.
The GC-MS instrument used in the study was a Thermo Scientific 1300 Chromatograph equipped with a TriPlus RSH autosampler and an ITQ 900 MS detector. The sample was injected onto a TR-5 column (30 m x 0.25 mm ID x 0.25 μm). The following instrumental parameters were used: inlet temperature 250°C, split flow 30 mL min- 1, split ratio 20 and carrier flow rate 1.5 mL min-1. The temperature program started at 172°C (1 min hold) up to 210°C with a step of 10°C min-1(1 min hold), then increased to 220°C with a step of 20°C min-1 (1 min hold) and finally up to 280°C with a ramp of 10°C min-1 and 1.5 min holding time. As the sample vials contained both organic (hexane) and aqueous layers, the injector needle was set to draw 1.0 μL sample at a depth of 17mm from the vial cap in order to avoid reaching the aqueous layer. Peaks were identified by comparison with reference compounds. The calibration standards used were glucose (0.005 -0.1 mg mL-1), fructose (0.025 - 0.5 mg mL-1) and sucrose (0.0125 - 0.25 mg mL-1). Relative response (area of peak/ internal standard) was used in constructing the calibration curve and calculating analyte concentrations.
Fructans
MALDI-TOF analysis: Bluebell bulbs were analysed using MALDI-TOF spectrometry for the numbers, chain length and ratios of the fructooligosaccharides. Matrix preparation: 18 mg mL-1 of 2, 5-Dihydroxybenzoic acid (DHB) dissolved in a solution of water: MeCN (3:1). Another solution of 16 mg mL-1 of 2,4,6-Trihydroxyacetophenone monohydrate (THAP) was prepared in a mixture of 0.1 μL Trifluoroacetic acid (TFA): MeCN (1:1) to be used as seeding layer.
Sample preparation: To 10 mg of freeze-dried and powdered bulb samples, 1000 μL of water was added, the mixture was vortexmixed for 1 min then centrifuged at 6000 rpm for 10 min. the supernatant was analysed for fructooligosaccharides by mixing an aliquot of it with an equal volume of DHB. Prior to applying the samples to the metal target, (1 μL) of THAP was applied as a seeding layer, allowed to dry at room temperature, then the sample: matrix mixture (0.5 μL) was dispensed onto it. Using THAP as a seed layer enhanced the formation of a homogenous crystalline bed that helped better distribution of the sample: matrix mixture. Samples were analysed using Reflex IV MALDI-TOF mass spectrometer Bruker Daltonics. The automatic collection (AutoX) feature was used and 240 laser shots were taken per spot.
Quantification using enzymatic assay: In order to analyze fructans, Duplicate 20 mg aliquots of freeze-dried powdered bluebell bulbs and leaves were mixed with 8 mL of hot deionised water, stirred and heated at 80°C for 15 min. The solution was allowed to cool to room temperature (20°C) and made up to 10 mL with distilled water. The analysis of fructans was performed using a fructan HK enzyme kit (Megazyme International, Ireland). An aliquot of 20 μL of centrifuged sample was incubated with 20μL of sucrase/maltase enzyme mixture in order to allow hydrolysis of sucrose and low DP maltosaccharides (if present) into glucose and fructose. After incubation, 50 μL of 100mM sodium acetate buffer solution (pH 4.5) was added and vortex-mixed. The resulting mixture was denoted solution A. Two 20 μL aliquots were taken from this solution and transferred into a 96-well quartz microplate (Falcon, UK). 10 μL of fructanase and indo-inulinase mixture was added to the first and 10 μL of buffer pH 4.5 solution to the second. The microplate was wrapped with cling film and incubated in an oven at 40°C for 30 min so as to assist the hydrolysis of fructans into glucose and fructose. After the incubation period, 200 μL of de-ionised water, 20 μL of buffer pH 7.6 and 10 μL of NADP+/ATP were added to both aliquots. The absorbance of the plate was recorded after 3-5 min (A1), then the reaction was started by adding 10 μL of a mixture of hexokinase, phosphoglucose isomerase and glucose-6-phosphate dehydrogenase (HK/PGI/G-6-PDH) previously diluted 1:4 with a buffer solution (pH 7.6). The plate was left to stand at room temperature for 15 min and the absorbance was then recorded (A2). The sample absorbance (A1 and A2) at 340 nm wavelength was recorded using a BioTek Power Wave TM XS Microplate Spectrometer operated by Gen5Âź software. Path length correction was applied during the analysis to correct for the solution depth. The values for fructans were calculated as the differences between concentrations of A1 and A2 which were calculated according to the formula:
Where:
V = final volume (mL)
MWt = molecular weight of glucose or fructose (180.16 g mol-1)
Δ = extinction coefficient of NADPH at 340 nm (6300 L mol-1 cm-1)
d = light path (cm)
v = sample volume (mL)
0.09/0.02 = volumes of solution A (0.09 mL) from which 0.02 mL aliquot was incubated with fructanase and indo-inulinase
Results
Phenology
Figure 2 illustrates phenological changes in all bluebell plant parts. For 2014, the first sample was collected in March where the average shoot height was 10cm above ground. Flower primers were also visible during this week. Plant heights slowly increased in the following two weeks and reached up to 13.2 cm after which the plants exhibited a rapid growth and on April 16th the leaves length was 21.6 cm and scapes became visible at a height of 9.7 cm. The average weight of the total vegetative growth per bulb increased from 2.13 to 7.74 g. Over the next month the leaves and scapes grew up to an annual average height of 30 and 40 cm respectively and total weight averaging around 8 g per bulb. Anthesis started on May 1st and by the first week in June fruits had formed while seeds were ripe in mid-July. Senescence started in the first week of June with the leaves beginning to turn yellow. The leaves disappeared completely by the end of the month followed by the scapes two weeks later, thus ending the above-ground growth stage. Re-sprouting started in December of the following year and shoots grew to an average under-ground height of 1.4 cm. The subterranean growth continued at a slow rate and over the following two months shoots grew up to 5 cm.
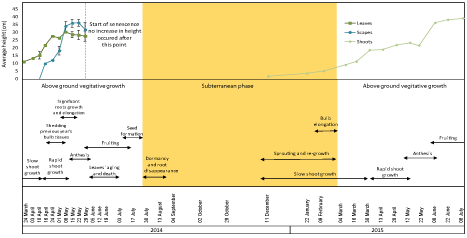
Figure 2: The phenology of bluebells observed during 2014-2015. A, Leaf and stalks heights for 2014, and shoots heights for 2015 samples. Error bars are SEM,
n=2. B, the different phenological stages of the plantâs life with the most significant characteristics.
The bulbs showed changes during different stages of the plantâs annual life represented by variations in the percentage of Dry Weight (DW), shape and texture of the bulbs. DW was less than 10% in March 24th, increased slightly in the following week and remained around 12% for 3 weeks. In mid-April, with the start of rapid growth, the previous yearâs tissues of the bulbs started to become wrinkly and pale indicating that the reserves had been consumed and the tissues that contained them were ready to be shed. Concurrent with shedding old bulb tissues, the current yearâs bulb started its growth and build-up of reserve. This was seen as an increase in DW from 12% in mid-April to a maximum of 29.6% over a period of 4 weeks. The DW remained more or less constant over the following month then it started to decrease gradually around the end of the vegetative growth. The bulbs entered a short period of dormancy for 2-3 weeks from the end of July until mid-August characterized by the disappearance of roots. (Figure 2) shows the onset and duration of different phenological stages, dry weight of bulbs over the period of the experiment and average vegetative growth represented by leaf and scapes height.
Total non-structural carbohydrates
The TNC content of the bulbs was found to be always higher than the other plant parts (Figure 3 and 4). The minimum values measured were at the start of growth 654 mg g-1 DW, while a maximum value of 824 mg g-1 DW was reached on 8th May with the value remaining constant for the following week then starting to decrease gradually towards the end of the growth season. The roots showed a pattern similar to that of the bulbs featuring low TNC at the start of growth followed by an increase to reach a maximum of 189 mg g-1 DW in mid-May then a gradual decrease in the following month. The maximum TNC content in the roots 320 mg g-1 DW was measured on July 17th (the last week before dormancy). Amongst the above ground vegetative organs (Figure 4), the scapes showed relatively higher TNC values at the start of growth at 224 mg g-1 DW compared to 64 and 75 mg g-1 DW for leaves and flowers respectively. The TNC of scapes remained higher than that of leaves until the start of anthesis in the first week of May then decreased sharply afterwards towards the end of the vegetative growth. The flowers showed a pattern characterized by two distinctive maxima: one at the time of peak anthesis in mid- May and the second during seed ripening when it reached a maximum on June 12th. The high similarity between the TNC patterns in both bulbs and roots is evident from the results, which could be due to the proximity of the two tissues.
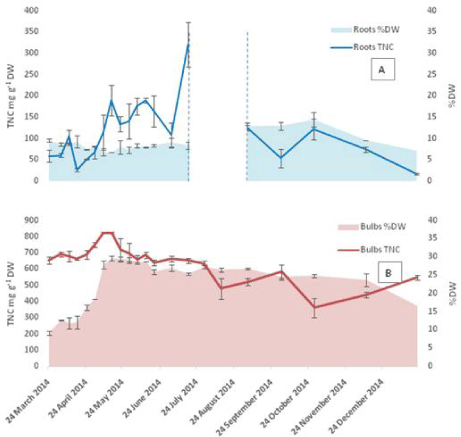
    Figure 3:  TNC in underground organs (A: roots and B: bulbs) calculated per dry weight basis for 2014 samples. The area between the dashed lines represents
the time of root death during dormancy. The Error bars are SEM, n=2 each analysed in triplicates. The % DW of each part is plotted on the secondary axis. Error
bars are SEM for n=2.
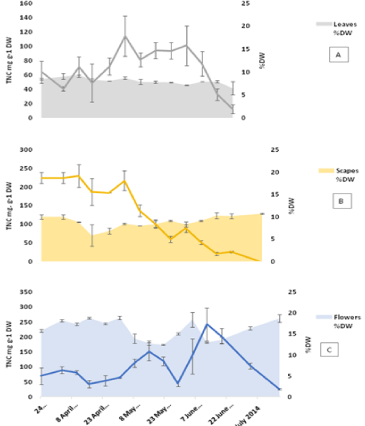
    Figure 4:  TNC in above ground organs (A: leaves, B: scapes and C: flowers)
calculated per dry weight basis for 2014 samples. Error bars are SEM,
n=2 each analysed in triplicates. The %DW of each part is plotted on the
secondary axis with SEM bars of n=2.
Mono and disaccharides
Analysis of the mono and disaccharides using GC MS (Figure 5) showed the presence of the three sugars: fructose, glucose and sucrose. The most abundant sugar of this pool in the bulbs during the start of the season and up to the middle of April was fructose followed by sucrose. The highest fructose concentration detected was 100 mg g-1 DW in March 24th. Only small amounts (about 2 mg g-1 DW) of glucose were detected at the same time. The high amounts of fructose dropped quickly to 6 mg g-1 DW by the start of May leaving sucrose as the main carbohydrate in the bulbs throughout the season. Fructose concentrations raised again by the end of October in preparation for re-sprouting. In the leaves, Glucose was the major sugar present and both fructose and sucrose were of relatively equal and much lower quantities. The only exception of this was during the first two weeks when sucrose was higher than both glucose and fructose. Glucose concentrations in the leaves showed an increase proportional to the increase in the tissue weight. April 24th which was the point in time that characterized the fast growth in leaves was also the point where glucose amounts changed from 29 -107 mg g-1 DW in only two weeks. Furthermore it coincided with the transition of fructose from being the dominating sugar in the bulbs to its first low value at 16 mg g-1 DW.
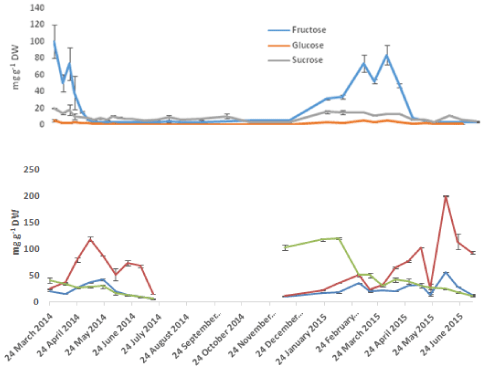
    Figure 5:  Seasonal variation of mono- and disaccharides in A, bluebell bulbs
and B, Bluebell shoots. Error bars are SEM of n=2.
Fructans
MALDI-ToF analysis of the fructan fraction in bulbs revealed the dominance of short-chain fructooligosaccharides. Shorter chain DP3 (Degree of Polymerization) and DP4 were the most common oligomers in all the samples tested (Figure 6). Longer chains up to DP9 were found at the start of growth in March-April and disappeared in April-May to be detected again in the later stages of the growth season and after shoot death. Trace amounts of DP11- DP13 were also detected.
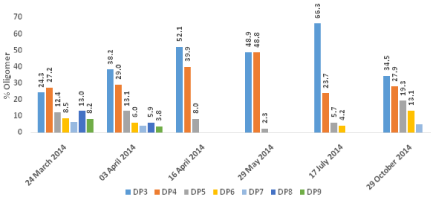
    Figure 6:  The percentage content of fructan oligomers in bluebell bulbs
analysed by Maldi-ToF spectrometry.
Dry weight based calculations of the amount of fructans in the bulbs revealed changes in their profile throughout the year (Figure 7). The concentration was relatively low from end of March to end of April. Bulb fructans start to increase concurrently with the growth of the above ground vegetation. Fructan concentrations reached 708 mg g-1 DW in May 8th and this value remained above 700 mg g-1 DW until June 19th after which it started to fluctuate with the general trend being downwards towards the end of the year (Figure 7). Sugar levels started to decrease fructan levels increased again during dormancy probably due to recycling of materials from the other dying organs. The minimum fructan values in the bulbs in December and January coincided with the high values in the newly-emerging, under-ground shoots. Shoot fructans showed a pattern similar to the mono and disaccharides. Fluctuations could be seen during the above-ground phase which could refer to periods of no or little photosynthesis allowing fructan depolymerisation and their translocation from the shoots to the bulbs.
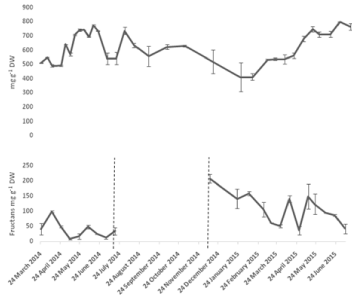
    Figure 7:  Seasonal variation of fructans in A, bluebell bulbs and B, bluebell
shoots. Values are means with SEM for at least n=2.
Discussion
The change in composition and content of carbohydrates over the annual life cycle was determined by the different phenological stages. The resources required for early growth in the shoots (leaves, scapes and flowers) were withdrawn from the reserve carbohydrates in the bulbs. The mobilisation of carbohydrates from the bulbs took place by the depolymerisation of fructans as shown through the increase in fructose (Figure 5) and depolymerised fructan (Figure 6) during slow shoot growth. Hydrolyzing enzymes, Fructan Exo-Hydrolases (FEH)s release terminal fructose units leaving behind shorter chain lengths of fructan. The monosaccharides thus formed are released to the cytoplasm where they are converted into sucrose by sucrose synthase to be exported to the growing organs as the supply of carbon and energy from photosynthesis is not yet sufficient to meet the demand [19,25]. The shoots, on the other hand, reflected the rate of photosynthesis with increasing glucose concentrations at higher biomass periods (Figure 5). Export to bulbs (characterized by buildup of fructans and increase in %DW) started once the leaves reached their highest content of dry matter on 24th April. At this point of time the scapes were at about half their annual heights and anthesis had not started yet. However, the amount of photosynthate seemed to be sufficient to meet the demands from both the growing above ground organs and refilling the underground reserves in bulbs indicated by an increase in bulb TNC, DW and fructan contents.
The flowers showed a pattern characterized by two distinctive maxima: one at the time of peak anthesis in mid-May and the second during seed ripening when it reached a maximum on June 12th (Figure 4). Anthesis is a distinctive stage in bluebell phenology characterized by the formation of a carpet of blue-purple flowers (Figure 1). An increase in simple sugars specifically fructose in the flowers is required to produce the osmotic driving force necessary for petal expansion during anthesis [26,27]. Once the fruits are formed, the petals start to wither and dry down which explains the decrease in TNC and the increase in DW content at this time. Seed capsule expansion was accompanied by an increase in TNC that could also be considered a factor involved in tissue expansion and taking up water as the tissue dry weight decreases at this stage. The final stage is the ripening of seeds which was accompanied by decrease in TNC and desiccation of the seed capsules [28,29]. The leaves start to show aging signs from the start of June to mark leaf death by the end of the month followed by the scapes two weeks later. Based on TNC values, carbohydrate levels in the scapes appear to be lower than those in the flowers in this period. This suggests the utilization of carbohydrates from another source, most likely the bulbs.
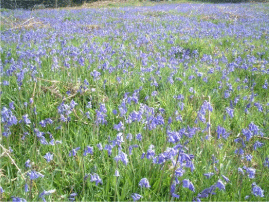
Figure 1: Dense bluebell carpet in flower on field site.
Enzymatic assay of fructans in bulbs showed the presence of fructans in relatively high concentrations reaching over 70% DW in bulbs. MALDI-ToF analysis showed that short chained DP3 and DP4 were the most common fructooligomers. Bluebells sole reliance on fructans gives an ecological advantage as fructans are utilised for multiple functions: Fructan-rich aqueous solutions are viscous and give support for expanding leaves via cell elongation, rather than new cell formation, thus saving energy in two aspects. In addition, bluebell bulbs are contractile, meaning that they descend deeper into the soil during each growth period (up to 30 cm) [2]. The flexibility endowed to bulbs through the high fructan content enables this adaptation. Formation of longer polymers usually takes place in the subterranean stage, while depolymerisation is associated with early growth and the mobilisation of carbohydrates from reserve [19,25,30]. The accumulation of polysaccharides in the leaves is the result of supply from photosynthesis exceeding both cellâs demand of sugars and export rate. The storage is temporary as the polysaccharides accumulated during the day are depolymerised and transported during the next dark period [31].
As the main reserve organ, bulbs contribute significantly to the survival of the plant during the unfavorable cold months and re-growth in spring. Based on fructan analysis results, bluebells consumed about 47% of the reserve during the subterranean stage. The highest decrease occurred at the start of the season prior to shoot emergence and was concurrent with the increase in mono- and disaccharide levels. The amount of reserve consumption by bluebells is relatively low in comparison with Galanthus nivalis L (snowdrops) that store both fructan and starch. The latter was found to use up 40 and 30% of its fructan reserve in addition to the depletion of the starch reserve by 92 and 79% for the same period [32]. Bluebell bulbs accumulate fructans mainly and starch is only found in trace amounts [18], yet the utilization of the reserve is not much higher than in snowdrops. The sole reliance on fructans might impact on the overall ability of bluebells to accumulate biomass, which have been described as having an âextremely slow rate of growthâ even under optimum condition with only doubling their weight in one season [6].
The biosynthesis and accumulation of fructans provides other beneficial characteristics over starch in plants under seasonal periods of stress. Temporarily stored fructans in photosynthetic tissues are not prone to rapid turnover that support fructan metabolism being tailored for plants subjected to cold temperatures and uncertainty of the available sunlight. Carbon stores with short supply lines are advantageous in conditions not favoring photosynthesis. Fructan degradation takes place by the action of one enzyme (FEH) only that targets terminal fructose moieties one at a time. From the plantâs perspective, less energy is required for the synthesis of different enzymes as in the case of starch which is being hydrolysed by multiple enzymes targeting different locations [33].
The high fructan content is associated with the presence of large vacuoles [18]. The existence of such an organelle in the tissue can act as an energetically cheap means of increasing cell size through water absorption and expansion rather than protein building. Similarly, tissue expansion is employed during the early shoot growth. Increasing the cell size in leaves serves to increase the surface area and thus increases the efficiency of photosynthesis [34]. Vacuoles push the cytoplasm contents against the cell wall, which could also facilitate photosynthesis by bringing the green plastids closer to the surface of a leaf cell. They also provide structure and rigidity to the tissues through turgor pressure, which is again, energetically efficient strategy in herbaceous plant requiring only small proportions of lignin in their cell walls [35].
Conclusion
In conclusion, bluebells solely rely on fructans and their comprising monosaccharides at all times during growth and dormancy. Fructans support the phenology of bluebells in view of reducing energetic demands during early growth through utilising cell expansion (instead of new cell formation), access to stored fructose (relying on one enzyme only), and more plasticity to access favourable ecological niches (contractile roots). Thus fructans play a key role in the maintenance of this iconic perennial flowering bulbs that carpets woodland floors for a brief period in early spring on the British Isles.
Acknowledgement
DR would like to acknowledge the Ministry of Higher Education and Scientific Research - Kurdistan Regional Government for her scholarship. VT would like to acknowledge the European Regional Development Fund projects BEACON and WISE Network. David Hughes and Bari Grail are acknowledged for advice and technical assistance. Deri Tomos provided for useful discussion in relation to fructan synthesis and metabolism.
References
- Chatterjee C, Pong F, Sen A. Chemical conversion pathways for carbohydrates. Green Chemistry. 2015; 17: 40-71.
- Blackman G, Rutter A. Endymion nonscriptus (L.) Garcke. The Journal of Ecology. 1954; 629-638.
- Rix M. Plate 481: Hyacinthoides non-scripta-Hyacinthacea. Curtis's Botanical Magazine. 2004; 21: 20-25.
- Thoss V, Murphy PJ, Marriott R, Wilson T. Triacylglycerol composition of british bluebell (hyacinthoides non-scripta) seed oil. Rsc Advances. 2012; 2: 5314-5322.
- Blackman GE, Rutter AJ. Physiological and ecological studies in the analysis of plant environment: 1. the light factor and the distribution of the bluebell (Scilla non-scripta) in woodland communities. Annals of Botany. 1946; 10: 361-390.
- Blackman GE, Rutter AJ. Physiological and ecological studies in the analysis of plant environment: II. The interaction between light intensity and mineral nutrient supply in the growth and development of the bluebell (Scilla non-scripta). Annals of Botany. 1947; 11: 125-158.
- Blackman GE, Rutter AJ. Physiological and ecological studies in the analysis of plant environment: III. The interaction between light intensity and mineral nutrient supply in leaf development and in the net assimilation rate of the bluebell (Scilla non-scripta) Annals of Botany. 1948; 12: 1-26.
- Blackman GE, Rutter AJ. Physiological and ecological studies in the analysis of plant environment IV. The interaction between light intensity and mineral nutrient supply on the uptake of nutrients by the bluebell (Scilla non-scripta). Annals of Botany. 1949; 13: 453-488.
- Blackman GE, Rutter AJ. Physiological and ecological studies in the analysis of plant environment: V. an assessment of the factors controlling the distribution of the bluebell (Scilla non-scripta) in different communities. Annals of Botany. 1950; 14: 487-520.
- Knight GH. Some factors affecting the distribution of Endymion non-scriptus (L.) Garcke in Warwickshire woods. Journal of Ecology. 1964; 52: 405-421.
- Grabham PW, Packham JR. A comparative study of the bluebell Hyacinthoides non-Scripta (L.) Chouard in two different woodland situations in the west midlands, England. Biological Conservations. 1983; 26: 105-126.
- Halevy A. Recent Advances in Control of Flowering and Growth Habit of Geophytes. Acta Horticulturae. 1989; 266: 35-42.
- Kamenetsky R, Shafir IL, Zemah H, Barzilay A, Rabinowitch H. Environmental control of garlic growth and florogenesis. Journal of the American Society of Horticultural Sciences. 2004; 129: 144-151.
- Risser PG, Cottam G. Carbohydrate cycles in the bulbs of some spring ephemerals. Bulletin of the Torrey Botanical Club. 1968; 95: 359-369.
- Thompson PA, Cox SA. Germination of the bluebell (Hyacinthoides non-scripta (L.) Chouard) in relation to its distribution and habitat. Annals of Botany. 1978; 42: 51-62.
- Hendry GA, Wallace RK. The origin, distribution and evolutionary significance of fructans. Michio Suzuki and N Jerry Chatterton, editors. In: Science and Technology of Fructans. CRC Press, Boca Raton, FL. 1993; 119.
- Meier H, Reid J. Reserve polysaccharides other than starch in higher plants. Loewus FA, Tanner W, editors. In: Plant Carbohydrates I. Springer, Berlin. 1982; 418.
- Hendry G. The ecological significance of fructan in a contemporary flora. New Phytologist. 1987; 106: 201-216.
- Pollock C. Tansley review no. 5. Fructans and the metabolism of sucrose in vascular plants. New Phytologist. 1986; 1-24.
- Orthen B. Sprouting of the fructanâand starchâstoring geophyte Lachenalia minima: Effects on carbohydrate and water content within the bulbs. Physiolgia Plantarum. 2001; 113: 308-314.
- Vijn I, Smeekens S. Fructan: More than a reserve carbohydrate? Plant Physiology. 1999; 120: 351-360.
- Averis A, Averis B, Birks J, Horsfield D, Thompson D, Yeo M. An illustrated guide to British upland vegetation. Joint Nature Conservation Committee, UK. 2004.
- Rojas-Escudero E, Alarcón-Jiménez AL, Elizalde-Galvån P, Rojo-Callejas F. Optimization of carbohydrate silylation for gas chromatography. Journal of Chromatography A. 2004; 1027: 117-120.
- Streeter JG, Strimbu CE. Simultaneous extraction and derivatization of carbohydrates from green plant tissues for analysis by GasâLiquid chromatography. Analytical Biochemistry. 1998; 259: 253-257.
- Edelman J, Jefford T. The mechanism of fructosan metabolism in higher plants as exemplified in Helianthus tuberosus L. New Phytologist. 1968; 67: 517-531.
- Le Roy K, Vergauwen R, Cammaer V, Yoshida M, Kawakami A, Van Laere A, et al. Fructan 1-exohydrolase is associated with flower opening in Campanula rapunculoides. Functional Plant Biology. 2007; 34: 972-983.
- Vergauwen R, Van den Ende W, Van Laere A. The role of fructan in flowering of Campanula rapunculoides. Journal of Experimental Botany. 2000; 51: 1261-1266.
- Housley TL, Daughtry CS. Fructan content and fructosyl transferase activity during wheat seed growth. Plant Physiology. 1987; 83: 4-7.
- Pollock C, Lloyd E. The metabolism of fructans during seed development and germination in onion (Allium cepa L.). New Phytologist. 1994; 128: 601-605.
- Jefford T, Edelman J. The metabolism of fructose polymers in plants: II. Effect of temperature on the carbohydrate changes and morphology of stored tubers of Helianthus tuberosus L. Journal of Experimental Botany. 1963; 14: 56-62.
- Wagner W, Wiemken A, Matile P. Regulation of fructan metabolism in leaves of barley (Hordeum vulgare L. cv Gerbel). Plant Physiology. 1986; 81: 444-447.
- Orthen B, Wehrmeyer A. Seasonal dynamics of nonâstructural carbohydrates in bulbs and shoots of the geophyte Galanthus nivalis. Physiologia Plantarum. 2004; 120: 529-536.
- Beck E, Ziegler P. Biosynthesis and degradation of starch in higher plants. Annual Review of Plant Physiology and Plant Molecular Biology (USA). 1989.
- Taiz L. The plant vacuole. Journal of Experimental Biology. 1992; 172: 113-122.
- Wiebe HH. The significance of plant vacuoles. Bioscience. 1978; 28: 327-331.