
Research Article
Austin J Account Audi Financ Manag. 2022; 2(1): 1005.
Machine Learning Model to Predict the Impact of Ukraine Crisis
Firouzjaee JT¹* and Khaliliyan P²
1Department of Physics, KN Toosi University of Technology, and School of Physics, Institute for Research in Fundamental Sciences (IPM), Iran
2Department of Physics, KN Toosi University of Technology, and Qorpi AI Workgroup, Iran
*Corresponding author: Javad T Firouzjaee, Department of Physics, K. N. Toosi University of Technology, P. O. Box 15875-4416, Tehran, Iran and School of Physics, Institute for Research in Fundamental Sciences (IPM), P. O. Box 19395-5531, Tehran, Iran
Received:November 01, 2022; Accepted:November 26, 2022; Published: December 03, 2022
Abstract
Russia’s attack on Ukraine on Thursday 24 February 2022 hitched financial markets and the increased geopolitical crisis. In this paper, we select some main economic indexes, such as Gold, Oil (WTI), NDAQ, and known currency which are involved in this crisis and try to find the quantitative effect of this war on them. To quantify the war effect, we use the correlation feature and the relationships between these economic indices, create datasets, and compare the results of forecasts with real data. To study war effects, we use Machine Learning Linear Regression. We carry on empirical experiments and perform on these economic indices datasets to evaluate and predict this war tolls and its effects on main economics indexes.
Introduction
It is known that Russia’s economy is a mixed economy, with big natural resources, especially oil and natural gas. Russia had 11th rank in nominal GDP in 2021 and is the fifth-largest economy in Europe. The key feature of Russia is vast geography which is important in its economic activity, and some sources estimate that the nation contains over 30% of the world’s natural resources [1]. Having huge energy resources, Russia has the largest natural gas reserves in the world, the second rank on largest coal reserves, the eighth, oil reserves. Russia is the main natural gas exporter, especially to Europe regions, the second-largest natural gas producer after the United States.
In contrast, Ukraine had number 56 in the ranking of GDP of the 196 countries in 2020. Ukraine has experienced critical political, security, and economic situations since 2013. The World Bank reported that Ukraine’s economic growth rate was 2.3% in 2016, thus this was ending the recession [2]. In spite of this progress, the International Monetary Fund reported in 2018, that Ukraine had the lowest GDP per capita of all the countries in Europe. In (Figure 1) you can compare the GDP per capita for Russia and Ukraine in the last decade.
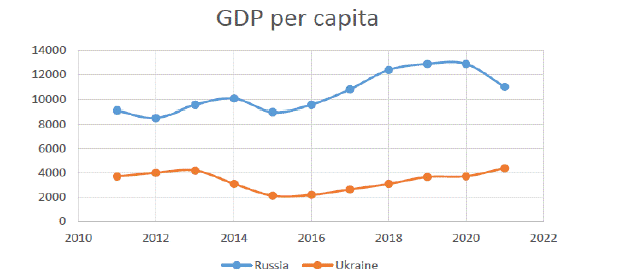
Figure 1: In this picture, we compare the GDP per capita for Russia and Ukraine in the last decade.
To study the Ukraine war economic side-effects, exploring some main economic data indexes and analyzing them can lead us to have better quantitative interpretation. Nowadays, it became common to use the Machine learning and Deep Learning approach to analyze economic events. Machine learning refers to the study of algorithms and statistical models which subdivision of artificial intelligence that gives computers the ability to learn from data and perform tasks without being explicitly given step-by-step instructions, only having the data it uses to train. Applying different approaches in artificial intelligence, there are different ways to approach stock price prediction; some of them include technical Analysis, fundamental Analysis, and time series analysis. For time series analysis, the Recurrent Neural Network known as one of the effective ways refers to attack the sequential problem or temporal aspects of data as time series which is a powerful tool in stock price prediction [3,4,6]. Here, our approach is to use the linear regression method in Machine Learning to study the economic effect of the Ukraine crisis.
The plan of the paper is as follows: Section II is dedicated to an analysis of the correlation between different economic indexes due to the Ukraine war. In Section III, we apply the machine learning approach to predict some main economic indexes involved in this war. The paper ends in Section VI with a brief summary.
Involved Economic Indexes and Their Correlation
In statistics, the dependence of any statistical causal or noncausal ratio between two accidents or data is described by the correlation index. This correlation coefficient value is located between -1 and 1 which negative value or inverse correlation (anticorrelation) expresses a relationship that one value increases as the other decreases. The correlation coefficient is equal to zero if there is no relationship between the two features. In this paper, we select some main economics indexes, such as Gold, Oil (WTI), RUBCNY (RUB/CNY or RUBCNY is the abbreviation for the Russia Ruble and Chinese Yuan pair. It shows how much the RUB (base currency) is worth as measured against the CNY), UAHCNY, and the US dollar index to find out the relationship between features before the Ukraine Crisis and after it. (Figure 2 and Figure 3) use Alpha Vantage API data to analyze these economic indexes.
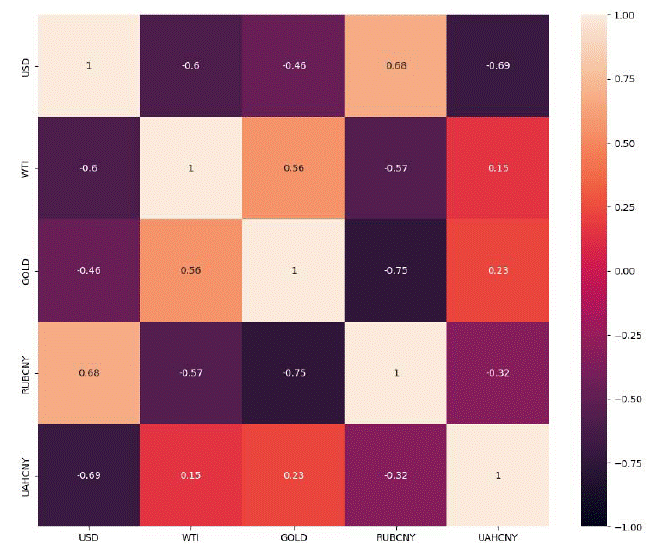
    Figure 2: Correlation between USD, WTI, Gold, RUBCNY, and UAHCNY before start Russia and Ukraine crisis (from 2022/01/01 to 2022/02/01).

We use data from 2022/01/03 to 2022/01/31 to predict economics indexes from 2022/02/01 to 2022-03-01 in the case of no war crisis.
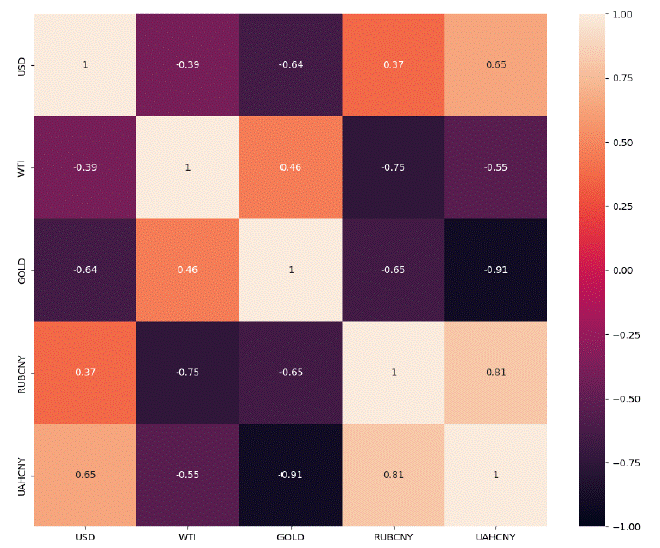
Figure 3: Correlation between USD, WTI, Gold, RUBCNY, and UAHCNY after start Russia and Ukraine crisis (from 2022/02/01 to 2022/03/01).
Data and Features
We use following features to predict each stock indexes as following table:
War Effect Estimation from Machine Learning Approach
Machine Learning
Machine learning is one of the subdivisions of artificial intelligence, in which it examines how the machine learning process is based on mathematical indicators and is known as the correction of implicit calculations. Tom Mitchel defined machine learning [7]:
“A computer program is said to learn from experience E with respect to some class of tasks T and performance measure P, if its performance at tasks in T, as measured by P, improves with experience E.”
Supervised Learning
Machine Learning can be classified to supervised learning, Semisupervised learning, unsupervised learning, and Reinforcement learning. In supervised learning, we give the machine the correct answer for each input, to learn and model based on input and output data which enable us to make our own predictions.
In data science, regression is a statistical process for estimating the relationships between features. This method includes numerous techniques for modeling and analyzing specific variables, which focus on the relationship between the dependent variable and one or more independent variables. Regression is commonly used for prediction. Furthermore, people use Regression analysis to identify the relationship between the independent and dependent variables and the shape of these relationships. In certain circumstances, this analysis can be used to infer excellent relationships between independent and dependent variables.
Linear Regression
Linear regression is a kind of supervised learning algorithm which measures the effect of an independent variable on a dependent variable and examines the correlations between them.
The regression equation which is used to construct a probabilistic model hypothesis can be defined using coefficients w as a linear coefficient and x as an independent variable as follows:
where the E is the error value. The predicted values for the US dollar, WTI, and Gold indexes were depicted in (Figure 4,5 and 6) in the case of no Ukraine conflict (We designed the machine experience based on task which there is no war).
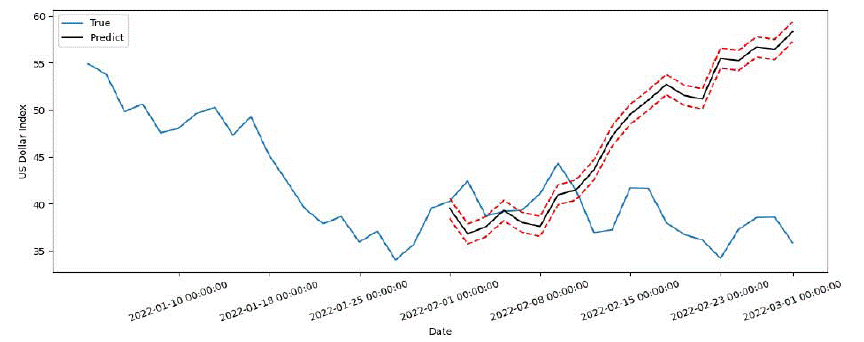
Figure 4: In this graph, we predict the US dollar index in the case of no crisis and compare it with real happened data.
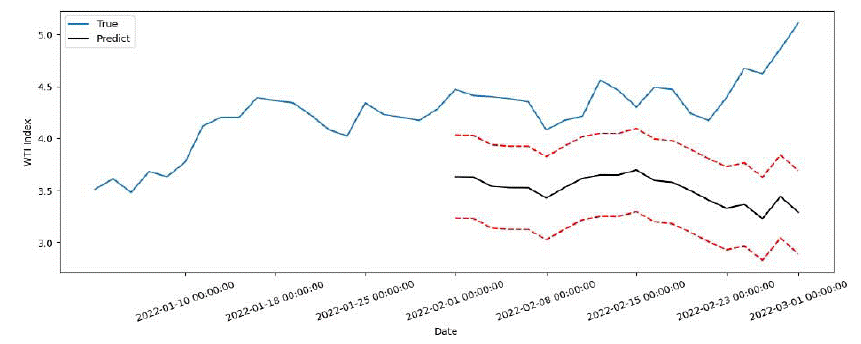
Figure 5: In this graph, we predict the WTI index in the case of no crisis and compare it with real happened data.
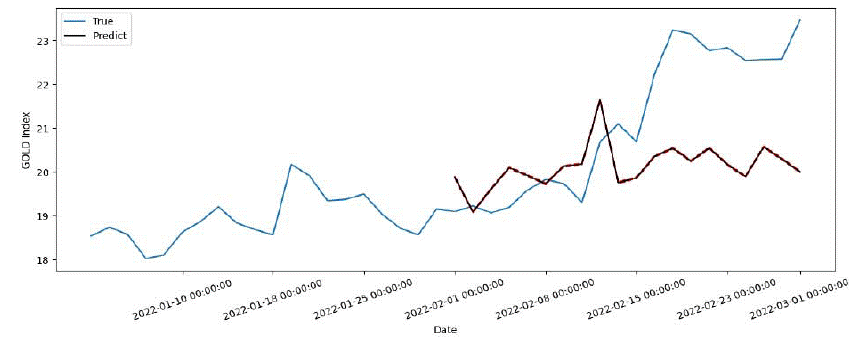
Figure 6: In this graph, we predict the Gold index in the case of no crisis and compare it with real happened data.
NDAQ
NDAQ is an American financial holding company that owns a stock market network and several US-based stock and options exchanges and operates three stock exchanges in the US. NDAQ is headquartered in New York. In (Figure 7), we predicted the NDAQ index in the case that no crisis had happened and compared it with real occurred data.
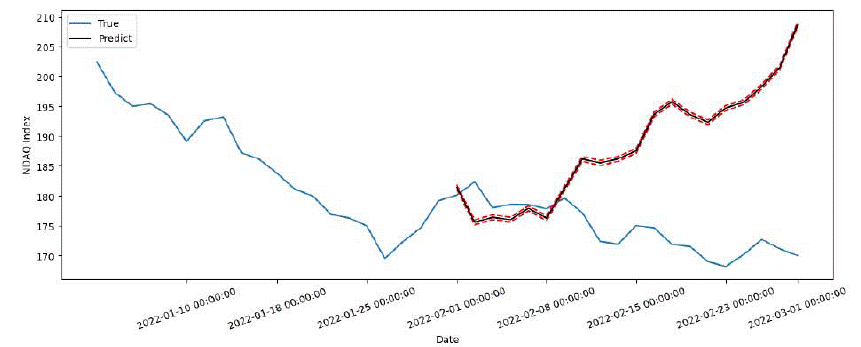
Figure 7: In this graph, we predict the NDAQ index in the case that no crisis and compare it with real happened data.
Evaluation Measures
There is some evaluation measures that people quantify the loss of the model by Mean Square Error (MSE), Root Means Square Error (RMSE), Mean Absolute Error (MAE), and Mean Absolute Percentage Error (MAPE). MSE is defined as below:
The average root of the squares of the errors quantified by RMSE which is defined as:
We measure the average of absolute error and use MAE to calculate errors between pair observations which are defined as:
In last, to measure the size of the error in percentage terms people use MAPE which is calculated for the mean of the absolute percentage errors of prediction. It is defined as the following formula:
Now, one can apply these evaluation measures as error metrics in our prediction as bellow table.
    Feature 1

    Feature 2

    Feature 3

    Feature 4

    Feature 5

    Feature 6

    Feature 7

    Predict feature


    US Dollar index

    Open

    High

    Low

    RUBCNY

    UAHCNY

    WTI

    Gold

    Close


    NDAQ

    Open

    High

    Low

    Gold

    US Dollar

    WTI

    -

    Close


    WTI

    Open

    High

    Low

    RUBCNY

    UAHCNY

    US Dollar

    Gold

    Close


    Gold

    Open

    High

    Low

    RUBCNY

    UAHCNY

    WTI

    US Dollar

    Close


    Our training data is from 2019/05/21 to 2021/06/14, and data from 2021/06/15 to    2021/12/31 is used for testing which extracted from Alpha Vantage API.
Table 1: Experiment Result for Royal Dutch Shell Shares.
    MSE

    RMSE

    MAE

    MAPE


    US Dollar index

    1.0711

    1.03494

    0.04631

    0.000723


    NDAQ

    0.40524

    0.03114

    0.00023

    0.63658


    WTI

    0.39943

    0.632008

    0.48482

    0.1454


    Gold

    0.01686

    0.12984

    0.007183

    0.00033
Table 2: Our Machine Learning model error measurement.
Discussion and Conclusion
Although Russia and Ukraine are responsible for up to 30% of the world’s wheat exports and 80% of sunflower seed production in the world, according to Capital Economics, this crisis can spark higher global inflation but it is not probable to cause a recession. Russia has more than doubled its interest rate to 20% in a bid to stop a collapse in the value of its currency which had about 30% after one week from the war started. Although our prediction showed that we could have the US dollar index growth in no conflict case but analysts estimated each $20 per barrel increase in oil (one week after starting Russia’s attack) would raise core inflation excluding food and energy by 0.035 percentage points and headline inflation by 0.2 percentage points but exacts just a 0.1 percentage point hit to United States GDP [9]. Our correlation analysis shows an increase in the US dollar with RUBCNY which shows non-significant US involvement in this crisis.
European markets break down at the open amid fears over financial stability, but later decreased losses with London’s FTSE 100 closing down 0.4%, Paris fell 1.3%, and Frankfurt 0.7% [8].
In contrast, analysts say that China could have profit from the diversion of Russian exports if sanctions are imposed on Moscow in the long-term [5]. Since during the Ukraine crisis there was no significant change in Chinese currency, we took it as an independent index and normalize the Russia and Ukraine currency to it as RUBCNY and AUHCNY.
We can summaries some results as bellow items:
• Before the crisis there was a weak correlation between UAHCNY and the gold index, but after the war, this correlation changed to anti-correlation and its value increased.
• Similar to the Gold-UAHCNY case, before the crisis there was a weak correlation between UAHCNY and WTI index, but after the war, this correlation changed to anti-correlation and its value increased.
• Before the crisis there was a significant anti-correlation between RUBCNY and the gold index, but after the war, this value did not have a significant change.
• Before the crisis there was a significant anti-correlation between RUBCNY and WTI index, but after the war, this value becomes greater.
• Our Machine Learning model predicted that in the case that no crisis happened, US dollar index and NDAQ would increase and WTI and Gold would get a small decrease. Whereas, the Ukraine crisis causes that the WTI and Gold indexes increase and the US dollar index and NDAQ decrease in their index price.
References
- Kevin M Korabik. Russia’s Natural Resources and their Economic Effects. Penn State College of Earth and Mineral Sciences. 1997.
- Ukraine’s Economy is Recovering Modestly Despite Significant Headwinds. World Bank. 2017.
- Varun Gupta, Ankit Pandey. Crude Oil Price Prediction Using LSTM Networks. International Journal of Information, Control and Computer Sciences. 2018; 11.
- Cen Zhongpei, Jun Wang. Crude oil price prediction model with long short term memmory deep learning based on prior knowledge data transfer. Energy. 2019; 169: 160-171.
- Ukraine crisis: Asia braces for economic fallout. Aljazeera. 2022.
- Firouzjaee Javad T, Pouriya Khaliliyan. LSTM Architecture for Oil Stocks Prices Prediction. arXiv preprint arXiv: 2201.00350. 2022.
- Michalski, Ryszard Stanislaw, Jaime Guillermo Carbonell, Tom M. Mitchell, eds. Machine learning: An artificial intelligence approach. Springer Science & Business Media. 2013.
- Ukraine conflict: Russia doubles interest rate after rouble slumps. BBC. 2022.
- Cox Je. Inflation will go higher, but Ukraine conflict likely wont halt economic growth in the U.S. CNBC. 2022.