
Research Article
Ann Agric Crop Sci. 2021; 6(4): 1082.
Pesticides Analysis in Beans by Gas Chromatography Couplet with Tandem Mass Spectrometry
Mizutani G* and Bustillos O
Centro de Química e Meio Ambiente, Instituto de Pesquisas Energéticas e Nucleares, São Paulo, Brazil
*Corresponding author: Mizutani G, Centro de Química e Meio Ambiente, Instituto de Pesquisas Energéticas e Nucleares, São Paulo, Brazil
Received: May 11, 2021; Accepted: June 07, 2021; Published: June 14, 2021
Abstract
Beans are part of the basic diet alimentation for Brazilian population, as they gather proteins, carbohydrates, vitamins, mineral salts, fibers, amino acids and essential nutrients such as iron and calcium, being a complete food that can be compared with the amount of protein that the meat has. Considering the beans world production, in development countries represent almost 50%, being that Myanmar, India and Brazil the top three position. The use of pesticides is widely spread in these countries to reduce agricultural losses due to pests that interfere with grain production. Therefore the risk that could be generated from foods pesticides residues makes their analyses of quantification mandatory. The purpose of this work was to develop an analytical method to quantitatively characterize fungicides pesticides residues, flutriafol, procymidone and tebuconazole that were used to angular spot control, anthracnose, rust and alternaria spot, white mold fungi, present in beans, by means of gas chromatography coupled with a triple quadrupole mass spectrometer. Samples of beans, Phaseolus vulgaris L, types white, black, string and Vigna angularis, type adzuki, had been bought in grains store and supermarkets at metropolitan São Paulo city. The validation of analytical method was explored for sensitivity, selectivity, precision. The extraction procedure was performed in two different forms, QuEChERS, and solid-liquid extraction with low temperature. Through this methodology, reached below the maximum limit allowed by Brazilian law 0.5mgkg-1 for procymidone and 0.1mgkg-1 for flutriafol and tebuconazole. Several samples of four types of beans were tested and all of them had procymidone identified and 7% of samples higher than the law limit.
Keywords: Beans; GCMSMS; Pesticides
Introduction
In Brazil, beans are the most popular food for general population, they have nutrients and energy that work in health prevention. In their composition there are proteins, carbohydrates, vitamins, mineral salts, fibers and amino acids [1].
Grains producers have been using several pesticides in this vegetable culture to preserve and improve the crop. The fungicides utilization has a function of preventing plant tissues infection by phytopathogenic fungi, currently we can find other concepts such as chemical compounds that are used to control diseases that are caused by fungi, bacteria and algae, in some cases they do not eliminate fungi, but temporarily inhibit spore germination [2].
The procymidone is using in mold-white fungi in a concentration of 500gkg-1 and acts to inhibit the growth of micelles, in the protection, cure [3,4].
The flutriafol and tebuconazole are fungicides that doing inhibit the synthesis of sterols that act in the formation and selectivity of the plasma membrane are used to control angular stain, anthracnose, rust and alternaria stain [3,4].
Fruits, vegetables, cereals are the most matrices that could find some pesticides residues in different classes and method development for this compounds are very important [5].
For these pesticides analyses several extraction are being used to aim these analytes. Acetonitrile is the best solvent to extract the samples because it has the best interaction with the analytes [6].
Therefore sample preparation using the QuEChERS multiresidues method, starts with the sample grind to get the most surface area to be in solvent contact, add magnesium sulfate, sodium chloride or sodium acetate, drying agents and clean up processes [7,8].
Other extraction technique used was solid-liquid with low temperature, in this extraction the sample, liquid or solid, in contact with solvent less dense than water and the less melting point less than 20°C negative, after shaking, rest in freezer about 16 hours, the water phase will be freeze and the organic phase will be liquid, this part has to be transfer to a vial and chromatography analyses [9,10].
This paper developed a method to characterize and quantify the fungicides that is present in vegetable with high protein content, beans specifically, that used a gas chromatography with mass spectrometry triple quadrupole TANDEM.
Methods and Materials
Materials and equipment
The following materials were used in this work:
• Falcon tube 10mL and 50mL;
• Analytical standards, flutriafol, procymidone, tebuconazole;
• Acetronitrile HPLC grade, isopropyl alcohol HPLC grade and ultrapure water;
• Vortex;
• Low temperature freezer -20°C;
• Blender;
• Gas chromatography coupled with Tandem mass spectrometry Bruker-EVOQ.
Method
Extraction: For extraction it was used a two different methods: QuEChERS, the most analytical extraction for pesticides, was used sample crushed, 3g, extraction salt, magnesium sulfate, 4g, and sodium acetate, 1g, with organic solvent, 4mL acetonitrile and 1mL isopropyl alcohol, shake 1 minute, centrifuge transfer 1mL to and clean up vial 150mg magnesium sulfate and 50mg PSA, transfer to 2mL vial and chromatography analyses, the second method solidliquid with low temperature, was used a sample crushed, 3g, in contact with organic solvent less dense than water, 4mL acetonitrile and 1mL isopropyl alcohol, and fusion point less than 20°C negative, the organic phase was liquid, transfer to 2mL vial and chromatography analyses, flowchart should be observe in Figure 1.
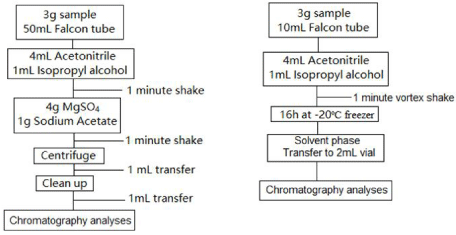
Figure 1: Extraction flowchart.
Analytical method: For analytical method it was used an instrumental analytical, gas chromatograph coupled with Tandem mass spectrometry equipment. It was developed method to separate the analytes. This method had a good sensitivity, accuracy and precision to fungicides compounds. All parameters of this analytical method can be found in Table 1 and 2.
    Auto sampler
    1μL


    Injector
    250°C


    Flow
    1mLmin-1 splitless 0.80min


    Carrier Gas
    Helium


    Column
    5MS - 30m x 0.25mm x 0.25μm


    Oven


    Rate
    Temperature
    Hold


    Initial
    100°C
    0min


    20°C min-1
    220°C
    3min


    40°C min-1
    280°C
    4min
Table 1: Chromatography method.
    Source
    250°C


    Transfer line
    230°C


    MS mode
    MRM - Multiple Reaction Monitoring


    Diuron
    161 > 90 (10eV)


    Flutriafol
    219 > 164.70 (10eV)


    Procymidone
    96 > 67 (10eV)


    Tebuconazole
    250 > 125 (10eV)
Table 2: Mass spectrometry method.
Validation
The analytical method validation has been processed with efficiency; the following parameters were evaluated to suitability guarantee.
These are selectivity, linearity, work range, detection limit, quantitation limit, recovery and accuracy. All validation steps add compound in matrix and follow the INMETRO DOQ-CGCRE-008, Brazilian validation document [11].
Selectivity
An analytical method to quantify the aim analyte in presence with other analytes or interference material was established. To identify the selectivity, standard injection had been done, to evaluate, retention time, fragmentation and column analytes separation. Full scan mode with extraction ions and four multiple reaction monitoring, MRM were done, these are shown in Figure 2.
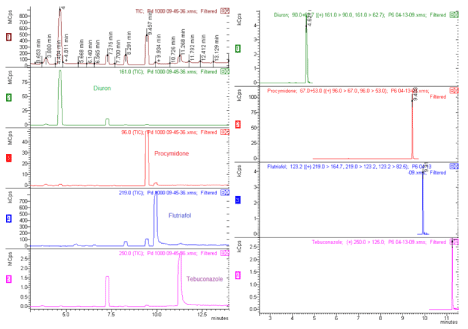
Figure 2: Full scan, left and MRM, right, analyses.
Linearity and work range
Linearity is an analytical procedure that can produce results proportionality to a sample analyte concentration. Work range is the range between the highest and lowest sample concentration, (10ugkg-1, 25ugkg-1, 50ugkg-1, 75ugkg-1, 100ugkg-1, 250ugkg-1, 500ugkg-1) that it has the method with an acceptable precision, accuracy and linearity. In Figure 3 it can see the linearity for four analytical compounds.
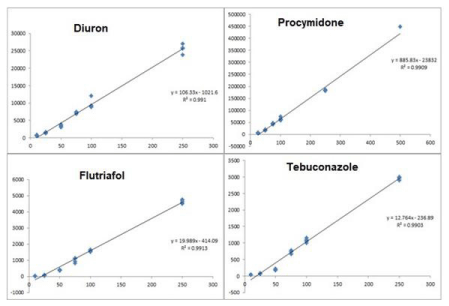
Figure 3: Calibration curve.
Detection and quantitation limit
Detection limit is the lowest concentration that can be found but not necessarily quantified. For this test all spectra compound has a lowest concentration 10ugkg-1 detectable.
Quantitation limit is the less sample quantity that can be quantified with precision and accuracy. For quantitation limit, four compounds used 25ugkg-1. Figure 4 shows a spectrum for detection limit, in the left hand and quantitation limit, in the right hand.
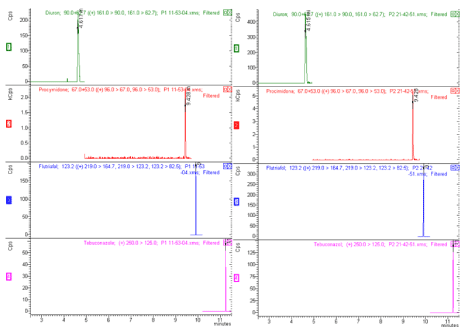
Figure 4: Detection limit, left and Quantitation limit, right.
Recovery
Recovery is estimated by fortified sample analysis with known compound and three different concentrations, low, 25ugkg-1, medium, 75ugkg-1 and high, 250ugkg-1, the recovery range is between 80-110. It was used two different compounds to evaluated recovery, Diuron and Tebuconazole standard in solvent, observe the recovery in Table 3 and Table 4.
    Sample
    Amount
    Reference
    Recovery
    Sample
    Amount
    Reference
    Recovery
    Sample
    Amount
    Reference
    Recovery


    1
    24.915
    25
    99.66
    1
    79.865
    75
    106.486
    1
    251.538
    250
    100.615


    2
    24.117
    25
    96.468
    2
    73.68
    75
    98.24
    2
    241.158
    250
    96.463


    3
    22.005
    25
    88.02
    3
    75.573
    75
    100.764
    3
    247.505
    250
    99.002


    4
    23.789
    25
    95.156
    4
    73.003
    75
    97.337
    4
    244.964
    250
    97.985


    5
    22.809
    25
    91.236
    5
    72.969
    75
    97.292
    5
    243.366
    250
    97.346


    6
    22.933
    25
    91.732
    6
    78.727
    75
    104.969
    6
    241.52
    250
    96.608


    7
    22.242
    25
    88.968
    7
    72.842
    75
    97.123
    7
    233.069
    250
    93.227


    8
    20.983
    25
    83.932
    8
    70.818
    75
    94.424
    8
    245.562
    250
    98.224


    9
    21.965
    25
    87.86
    9
    67.38
    75
    89.84
    9
    244.704
    250
    97.881


    10
    22.064
    25
    88.256
    10
    73.77
    75
    98.36
    10
    246.558
    250
    98.623


    Average
    22.782


    Average
    73.862


    Average
    243.994


    SD
    1.19


    SD
    3.6


    SD
    4.87


    RSD(%)
    5.21


    RSD(%)
    4.87


    RSD(%)
    2
Table 3: Diuron recovery.
    Sample
    Amount
    Reference
    Recovery
    Sample
    Amount
    Reference
    Recovery
    Sample
    Amount
    Reference
    Recovery


    1
    27.017
    25
    108.068
    1
    73.47
    75
    97.96
    1
    236.964
    250
    94.785


    2
    22.18
    25
    88.72
    2
    69.259
    75
    92.345
    2
    252.761
    250
    101.104


    3
    22.711
    25
    90.844
    3
    78.465
    75
    104.62
    3
    252.986
    250
    101.194


    4
    22.265
    25
    89.06
    4
    74.692
    75
    99.589
    4
    238.172
    250
    95.268


    5
    27.209
    25
    108.836
    5
    82.358
    75
    109.81
    5
    248.208
    250
    99.283


    6
    27.036
    25
    108.144
    6
    75.666
    75
    100.888
    6
    252.419
    250
    100.967


    7
    26.548
    25
    106.192
    7
    75.92
    75
    101.226
    7
    252.308
    250
    100.923


    8
    26.634
    25
    106.536
    8
    71.885
    75
    958.466
    8
    254.679
    250
    101.871


    9
    24.045
    25
    96.18
    9
    83.509
    75
    111.345
    9
    240.578
    250
    96.231


    10
    21.121
    25
    84.484
    10
    78.16
    75
    104.213
    10
    240.134
    250
    96.053


    Average
    24.676


    Average
    76.338


    Average
    246.92


    SD
    2.44


    SD
    4.43


    SD
    7.1


    RSD(%)
    9.9


    RSD(%)
    5.81


    RSD(%)
    2.88
Table 4: Tebuconazole recovery.
Accuracy
In the accuracy was not more than 20% and the standard deviation relative was not more than 5%. There are three most common evaluations: repeatability, intermediate precision and reproducibility, usually expressed by standard deviation and coefficient of variation. For this validation it was used repeatability which means that this procedure needs the same requirements, such as operator, preparation conditions, systems, and place. The compounds were added the compounds in the matrix and used different range concentration, low, 25ugkg-1, medium, 50ugkg-1 and high 250ugkg-1 (Table 5-7).
    Sample
    Concentration
    Referencie Concentration
    Accuracy (%)


    Flutriafol
    White beans


    1
    23.671
    25
    -5.316


    2
    23.614
    25
    -5.544


    3
    23.764
    25
    -4.944


    4
    26.196
    25
    4.784


    5
    24.202
    25
    -3.192


    Average
    24.289


    SD
    1.09


    RSD(%)
    4.49


    Sample
    Concentration
    Referencie Concentration
    Accuracy (%)


    Flutriafol
    Adzuki beans


    1
    23.753
    25,000
    -4,988


    2
    24.216
    25,000
    -3,136


    3
    23.171
    25,000
    -7,316


    4
    23.528
    25,000
    -5,888


    5
    23.103
    25,000
    -7,588


    Average
    23.554


    SD
    0.46


    RSD(%)
    1.93
Table 5: Flutriafol low precision.
    Sample
    Concentration
    Referencie Concentration
    Accuracy (%)


    Diuron
    String beans


    1
    58.517
    50
    17.034


    2
    58.606
    50
    17.212


    3
    57.982
    50
    15.964


    4
    54.312
    50
    8.624


    5
    56.627
    50
    13.254


    Average
    57.209


    SD
    1.8


    RSD(%)
    3.15


    Sample
    Concentration
    Referencie Concentration
    Accuracy (%)


    Diuron
    White beans


    1
    49.924
    50
    -0.152


    2
    56.291
    50
    12.582


    3
    54.79
    50
    9.58


    4
    55.175
    50
    10.35


    5
    54.15
    50
    8.3


    Average
    54.066


    SD
    2.44


    RSD(%)
    4.52
Table 6: Diuron medium precision.
    Sample
    Concentration
    Referencie Concentration
    Accuracy (%)


    Tebuconazole
    White beans


    1
    228.017
    250
    -8.793


    2
    244.589
    250
    -2.164


    3
    229.1
    250
    -8.36


    4
    247.478
    250
    -1.009


    5
    234.857
    250
    -6.057


    Average
    236.808


    SD
    8.87


    RSD(%)
    3.75


    Sample
    Concentration
    Referencie Concentration
    Accuracy (%)


    Tebuconazole
    Adzuki beans


    1
    248.837
    250
    -0.4652


    2
    259.327
    250
    3.731


    3
    239.374
    250
    -4.25


    4
    231.291
    250
    -7.484


    5
    255.876
    250
    2.35


    Average
    246.941


    SD
    11.61


    RSD(%)
    4.7
Table 7: Tebuconazole high precision.
Results and Discussion
The analytical method validations were satisfactory for selectivity, sensitivity, linearity and accuracy. Two different extractions were done, for QuEChERS extraction we made a comparative between clean-up and without clean-up. The results showed that cleanup was very effective to matrix effect and reduced the signal to noise chromatogram protein and showed better results than without cleanup, Table 8. The solid- liquid extraction at low temperature had different results for all types of beans, these results may have occurred due to bad interaction of the contact surface or bad organic solvent interaction (Table 9). Therefore, in this comparative extraction method low temperature was not efficient to these fungicides’ compounds.
    Beans


    Black
    White
    String
    Adzuki
    Unit


    QuEChERS
    Without cleanup
    0
    0
    0
    0
    μgkg-1


    0
    0
    0
    0


    0
    0
    0
    0


    0
    0
    0
    0


    0
    0
    0
    0


    With cleanup
    24.171
    24.162
    23.268
    24.546
    μgkg-1


    24.423
    24.072
    25.268
    24.233


    24.28
    23.561
    24.83
    25.963


    23.422
    23.932
    23.814
    26.6


    23.823
    25.142
    22.896
    24.627
Table 8: QuEChERS comparations results.
    Beans


    Black
    White
    String
    Adzuki
    Unit


    Low temperature
    145.117
    77.314
    203.524
    103.577
    μgkg-1


    143.115
    77.61
    199.542
    102.983


    43.567
    31.932
    25.024
    0.000


    40.059
    45.41
    70.903
    30.968


    35.888
    49.25
    59.902
    0.000
Table 9: Low temperature extraction results.
All samples had showed procymidone as identified and their quantitative results are shown at Table 10. Nevertheless the most procymidone samples results are below the Brazilian law regulation limit 0.5mgkg-1 and that means that it is good for consumption but in 7% in all sample showed a lit bit higher than law regulation limit. Flutriafol and tebucanozole don’t appear in spectrum results or above the detection limit (Figure 5).
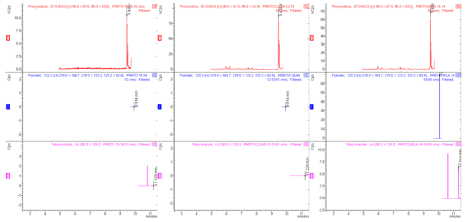
Figure 5: Sample spectrum, left without cleanup, middle with cleanup, right low temperature.
    Sample
    Feijão
    Unit


    Black
    White
    String
    Adzuki


    1
    188.562
    376.87
    39.799
    28.038
    μg kg-1


    2
    81.485
    47.794
    37.58
    46.64


    3
    76.05
    53.36
    41.263
    48.008


    4
    80.736
    47.213
    36.133
    46.229


    5
    80.422
    37.362
    37.039
    49.239


    6
    77.025
    29.606
    37.458
    50.501


    7
    72.305
    28.769
    35.849
    47.078


    8
    295.22
    40.293
    259.189
    31.537


    9
    228.267
    39.446
    264.227
    35.264


    10
    143.115
    40.36
    265.558
    35.286


    11
    43.567
    39.164
    261.514
    35.319


    12
    128.507
    39.388
    274.735
    31.957


    13
    85.193
    39.66
    43.386
    32.938


    14
    83.439
    216.96
    35.667
    31.284


    15
    76.419
    235.209
    35.978
    269.502


    16
    67.355
    252.365
    33.286
    273.641


    17
    64.969
    214.37
    33.251
    264.055


    18
    318.243
    198.962
    31.454
    258.239


    19
    229.906
    203.131
    30.278
    263.66


    20
    230.778
    183.936
    28.689
    427.029


    21
    237.54
    296.371
    34.841
    411.554


    22
    492.752
    286.666
    36.896
    625.149


    23
    515.174
    267.477
    33.919
    283.468


    24
    256.627
    267.268
    34.278
    353.411


    25
    276.036
    260.405
    33.076
    513.987


    26
    467.731
    286.363
    31.281
    311.317


    27
    632.52
    378.321
    584.215
    550.785


    28
    287.996
    670.378
    484.459
    188.446


    29
    126.227
    188.18
    505.939
    174.998


    30
    137.286
    618.594
    295.423
    265.352


    31
    224.257
    415.396
    98.444
    52.011
Table 10: Sample Results.
Conclusion
The methodology developed in this work shows a good agreement due to validation method for linearity, sensibility, accuracy, detection and quantitation limit.
Two different extractions were tested and it was observed that low temperature extraction has a disadvantage, a long time inside low temperature freezer, about 15 hours, to freeze the aqueous phase but was not efficient for these fungicides compounds, but it is not necessarily useless for other pesticides compounds.
In QuEChERS extraction showed that the clean-up extraction was efficient to prevent matrix effect, the signal to noise chromatogram protein is reduced and better results were achieved, but in disadvantage some difficult to buy a extraction salt and a abruptly agitation about 1 minute.
We were analyzed about 30 samples and the fungicides results in the beans stood below the regulation limit, which means that they are good for consumption except for 2 sample in 30, that a lit bit higher than regulation limit, that maybe bought when the store recently receive, this proves that we have a fungicides degradation by time of exposure.
References
- Lemes VRR, Kussumi TA, Nakano VE, Rocha SB, de Oliveira MCC, Rodrigues MP, et al. Avaliação de Resíduos de Agrotóxicos em Arroz e Feijão e sua Contribuição para Prevenção de Riscos à Saúde da População Consumidora. Revista do Instituto Adolfo Lutz. 2011.
- Araújo EJDR. Controle Químico de doenças do feijão. Linkedin SlideShare. 2017.
- Garcia A. Fungicidas I: utilização no controle químico de doenças e sua ação contra os fitopatógenos. EMBRAPA - Empresa Brasileira de Pesquisa Agropecuária. 1999.
- Fidélis MR. MÉTODO VOLTAMÉTRICO PARA A DETERMINAçãO SIMULTÂNEA DE PROCIMIDONA E TEBUTIURON EM ÁGUA. Universidade Federal de Viçosa. 2015.
- de Kok e Ionara R. Pizzutti Mhcwodpmbarza. Validação de métodos multirresíduos para determinação de resíduos de 52 pes-ticidas em soja utilizando GC-MS (SIM) e GC-MS/MS (EI+ E CI-). Sociedade Brasileira de Química (SBQ). 2006.
- Pinho GPD. Extração de Pesticidas em Amostras de Tomate pelas Técnicas: Extração Sóli-do- Líquido e Purificação em Baixa Temperatura (ESL-PBT) e Dispersão da Matriz em Fase Sólida (DMFS) para Análise por Cromatografia Gasosa. Universidade Federal de Viçosa. 2007.
- Grave G. Vida e Química - Dicas da vida, uteis p dia a dia. E um pouco mais de Química, que tb faz parte do meu dia-dia. Extração Sólido-Líquido. 2011.
- Prestes OD, Friggi CA, Adaime MB, Zanella R. Um método moderno de preparo de amostra para determinação multirresíduo de pesticidas em alimentos por métodos cromatográficos acoplados à espectrome-tria de massas. Química Nova. 2009.
- Vieira HP. Otimização e validação da extração simultânea de piretróides em água e solo e análise por cromatografia gasosa. Universidade Federal de Viçosa. 2005.
- Vieira HP, Neves AA and de Queiroz MELR. Otimização e validação da técnica de extração líquido-líquido com partição em baixa temperatura (ELLPBT) para piretróides em água e análise por CG. Química Nova. 2007.
- Inmetro-Instituto Nacional de Metrologia, Qualidade e Tecnologia. ORIENTAÇÃO SOBRE VALIDAÇÃO DE MÉTODOS ANALÍTICOS - DOQCGCRE- 008. INMETRO. 2016.