
Special Article - Biogas Production
Ann Agric Crop Sci. 2022; 7(4): 1120.
Potential and Economic Evaluation of Biogas Resources and Location of its Power Plants with GIS in Iran
Moosavian SF, Zahedi R and Hajinezhad A*
Department of Renewable Energy and Environmental, Faculty of New Science and Technologies, University of Tehran, Tehran, Iran
*Corresponding author: Ahmad Hajinezhad, Department of Renewable Energy and Environmental, Faculty of New Science and Technologies, University of Tehran, Tehran, Iran
Received: September 05, 2022; Accepted: October 14, 2022; Published: October 21, 2022
Abstract
Excessive consumption of fossil fuels has led to threats to energy reserves and environmental issues as two common concerns of today’s societies. On the other hand, renewable energy sources have been growing as alternative sources to reduce severe environmental problems such as global warming, climate change, and acid rain. As a result, it is necessary to assess the potential of renewable resources and the location of power plants related to them. Among renewable energies, biomass energy and biogas have a high status and importance, accounting for a significant share of energy production. Therefore, choosing a suitable location for biogas power plants in energy production and transmission, cost reduction, and environmental aspects. Today, the use of GIS has made it possible to integrate the information needed for location effectively. Therefore, in this study, while identifying the influential factors and criteria in the location of biogas power plants and the AHP hierarchical analysis process as one of the multi-criteria MCDSS decision-making methods to the location of biogas power plants in Iran, as one of the criticalroles in the production of agricultural biomass, livestock and poultry, and waste has been addressed. The results of the economic analysis showed that the construction of biogas power plants is justified in cities where the cost of the power plant is less than 0.098 USD per cubic meter of gas produced and the average cost of biomass is less than 0.0915 USD per cubic meter of synthetic gas.
Keywords: Crop and livestock biomass; Biogas power plant; GIS; AHP
Introduction
Global energy demand is overgrowing due to population explosions and technological advances. Limited fossil fuel resources and negative environmental impacts require special attention to reduce the use of fossil fuels [1]. Therefore, paying attention to its pollution and maintaining the health of humans and all organisms is one of the critical principles in survival [2]. These threats can be significantly reduced through the development and use of renewable resources. Wastes are one environmental pollutant that can be used as a renewable energy source [3]. According to (Figure 1), there are several ways to convert these materials into different types of energy.

Figure 1: Biomass technology classification.
Gasification is one of the most important and growing methods of producing clean and sustainable energy globally, based on the use of agricultural and livestock waste and other biomass resources [4]. In this technology, the biomass used in the reactor is heated, provided that the external energy supply for heating the biomass is expensive. It is compressed by the injection of air [5]. The maximum amount of air injected into the reactor is usually assumed to be approximately 25% of the air required for complete combustion of the biomass [6]. By heating the biomass and carrying out a series of chemical processes, some biogas is produced along with significant volumes of hydrogen, carbon monoxide, and carbon dioxide [7]. The produced gases can be used for combustion and heat production, and also for these products, there are many other uses [8]. Due to this technology, gasification still has lower economic efficiency than cheaper energy production methods such as fossil fuels [9]. However, the cheapness of raw materials (such as agricultural waste or wood chips), along with the numerous environmental benefits and reduced environmental pollution compared to fossil fuels, have attracted significant investment in this area in recent years [9]. These investments, in turn, have led to significant growth in gasification technology so that at present; the cost of energy production by gasification with fossil fuel methods is meager. These methods have far more economic justification than new methods, such as the use of wind energy [10].
In general, biomass power plants are smaller in terms of production capacity compared to power plants from other energy sources such as coal and gas. On the other hand, due to the low calorific value of feed entering these power plants, there is a need for higher mass flow than raw materials and also the main feed used in these power plants have a very low density [11]. Considering all of the mentioned matters, it is quite clear that the volume of feed required for biomass power plants is very high, leading to a sharp increase in transportation and storage costs [12]. On the other hand, the seasonal presence of a large portion of biomass resources and their asymmetric distribution in the environment complicates matters related to the cost of purchasing and transporting plant power feed. Therefore, biomass distribution plays a very important role in determining the appropriate location for the construction of a gas power plant [13]. In general, biomass can be considered the non-fossil organic matter from which energy can be extracted, such as wood, grains, agricultural wastes, and animal wastes [14].
The importance of this issue has led to many studies to evaluate the potential of biogas production from agricultural and livestock waste in many countries. As an example of this research, Abdeshahian et al. Studied the potential for biogas production from livestock manure and slaughterhouses in Malaysia and found that these sources generated the potential to produce 49.4589 million cubic meters per year of biogas (equivalent to 27.8 109 kWh per year) [11]. In another case study, Rios et al. examined the potential for biogas production from organic waste and its use to generate electricity in Mexico. They identified 391 points suitable for constructing a biogas plant in terms of theoretical, technical and economic potential [15]. In a review study, Gavala et al. examined the potentials, advances, and limitations of biogas production from biomass sources [16]. Other extensive studies have been conducted on the potential of converting agricultural and livestock waste into biogas in various ways and analyzing the economic and environmental effects of these energy sources. These studies show that biogas can help provide the energy needed for the electricity generation and transportation sectors to a very acceptable extent [17-20].
In recent years, Iran has also tended to use renewable resources to get rid of its heavy dependence on fossil fuels and reduce environmental threats. One of the many renewable resources in Iran is biomass resources. In terms of weight, agricultural wastes and wood wastes constitute the major part of Iran’s biomass resources. Wood waste in Iran is divided into three categories:
• Extracts from pruning fruit trees
• Hand-planted forests and wood fields (due to the early growth of poplar and eucalyptus trees, 97% of these fields use these two types of trees)
• Wood waste from the bark of some fruit trees such as walnuts and almonds
There is no general information about agricultural waste in Iran and generally, based on the area under cultivation of a product, the waste of that product is estimated. Approximately 20 to 35 million tons of biomass produced from agricultural wastes are produced annually in Iran. The country’s agricultural resources, which can be used the most in gasification, include product surpluses, which are mentioned in (Figure 2) along with the calorific value of each item.
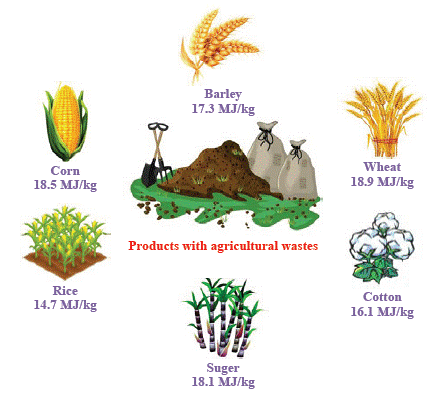
Figure 2: Agricultural waste classification.
Another part of biomass resources can be divided into surpluses from orchards and hand-planted forests. The estimation of waste weight is estimated based on the area under crop cultivation. Fruits whose orchards have a significant volume of wood waste are also presented in (Figure 3).

Figure 3: Waste gardens and forests.
Forest wastes are mainly divided into poplar and eucalyptus forests. For each of the mentioned cases, the amount of waste is approximated based on the area under cultivation and the ratio of waste to the crop. Wood waste is usually available for free. While the use of agricultural waste as fuel for a gas power plant, due to its use in the livestock and poultry industry, will be associated with the purchase cost. For this reason, different divisions of biomass distribution in the country can be presented. Since biomass is a renewable resource dependent on geographic information, as stated, in addition to determining the appropriate type of biomass, finding the right place to build a power plant is also very important. However, only in limited studies due to geographical information, a suitable model has been proposed to find a suitable place for the construction of biogas power plants. Geographic Information Systems (GIS) are one of the most powerful tools that allow the integration of data related to various limiting, agreeing or disagreeing factors and perform data analysis for feasibility, evaluation and optimization of spatial locations. This tool has been used in various studies to measure potential and find suitable location in areas related to biogas, such as finding potential sources or suitable location for the construction of the power plant [21-23].
Therefore, due to the importance of the issue, in this study, the location of biogas power plants in Iran as one of the most important poles of biomass resources in the Middle East has been discussed. Also in this study, biomass costs due to agricultural wastes will be considered in order to reduce production costs.
Methodology
In this study, following the evaluations made by the authors of this article, in the field of using biogas fuel to generate electricity, to locate biogas power plants, using Geographic Information System (GIS) and Analytic Hierarchy Process (AHP) It is discussed as one of the Multi-Criteria Decision Making Methods (MCDSS). The reason for choosing the combination of the two, in order to achieve better spatial decision-making, is to identify the most suitable areas of Iran for the construction of biogas power plants.
Geographic Information System (GIS)
Today, the high capabilities of Geographic Information System (GIS) in the management and analysis of spatial data have led to a very efficient environment for performing various stages of analysis such as location [3]. On the other hand, the importance of location as a determining step in the implementation of a project, has reduced a large part of the construction costs of the project, so its use has been considered by managers and decision makers.
Analytic Hierarchy Process (AHP)
Multi-criteria decision strategy in combination with GIS can also provide a suitable framework for solving complex decision problems. The Analytic Hierarchy Process (AHP), as one of the most efficient decision-making techniques, was introduced in 1980 by Professor Thomas Clock. The results obtained from previous studies show that the AHP method, due to its simplicity, flexibility, and application of qualitative and quantitative criteria simultaneously, as well as the ability to examine the consistency of judgments can be considered in planning the favorable location and region issues [24].
Logic of (AHP) is based on the three principles of parsing, comparative judgment, and prioritization. The principle of decomposition requires the decomposition of decision-making problems of different elements hierarchically. The principle of comparative judgment also refers to the binary comparison of elements in a level of hierarchical structure. In this way, in AHP, the elements of each level are compared in pairs, and according to (Table 1), their relative weight is calculated in relation to their corresponding element at a higher level [25]. These weights can be calculated individually or a combination of expert judgment, in which case the answers become a single answer using a geometric mean to combine different expert opinions. In the pairwise comparison matrix, the preference of each element over itself is one, so all the elements on the diameter in the pairwise comparison matrix are equal to one, and if the preference of element A over element B is n, the preference of element B over element A is 1/n. It is not necessary to re-evaluate the pairwise comparisons in order to verify the accuracy of the comparisons made between the two criteria, if the mismatch ratio is less than 0.1.
    Preferences

    Preferences    between previous intervals

    Preference of    equal importance

    A little    preferred or more importantly

    Strong    preference

    Preference with    extreme importance

    Preferred or,    more importantly


    Numerical Value

    2,4,6 and 8

    1

    3

    5

    7

    9
Table 1: Preference values for pair wise comparisons.
Location of Biogas Power Plant
From an environmental point of view, suitable location is the best location for a type of land use from which the user has the least load and pressure on the environment and the user himself suffers the least damage or pressure from environmental changes due to his deployment [26]. According to the review of resources, in general, the important factors that should be considered in locating the power plant, are divided into two categories of environmental and technicaleconomic factors. Environmental factors include natural and human factors. Natural factors are divided into two categories: stable factors and unstable factors. Stable factors are such as topography, geology, soil science and vegetation. Unstable factors also include surface water, groundwater and climate. Among the human environmental factors, we can mention ancient and historical monuments, national monuments, pilgrimages and population. The technical-economic factors are the same as the infrastructure, such as the access road network and the power transmission network [27].
In this study, according to what was mentioned, 13 criteria for locating a biogas power plant were selected. These criteria are: slope, altitude, distance from the airport, distance from areas with severe flooding, land use and waste gas and livestock production areas, distance from main dams and waterways, distance from bio sensitive areas, distance from fault, distance from urban settlement, distance from rural settlement, distance from power transmission lines, distance from communication network and groundwater level. The proposed model diagram for suitable location finding is also shown in (Figure 3).
Determining areas with construction restrictions: At first, according to the available information and criteria, areas with limited construction of the power plant in terms of environmental and technical-economic factors, with the help of existing functions in GIS were identified and thus the limit map of the study area for the construction of biogas power plant was prepared. Table 2 shows the details of the constraints of the area.
    Description

    Property

    Recommended for    buffer


    Areas with    unsuitable slopes

    Land slope

    10%


    Forests need a    protected area

    Forests

    200 m


    Elevation above    sea level

    Above sea level

    1800 m


    Residential    areas need a surrounding safety zone

    Built areas

    1000 m


    Roads have a    safe area to ensure the safety of drivers

    Roads, railways

    30 m


    These sites need    a safety zone to ensure air traffic safety

    Airports

    1000 m


    Proximity to    rivers, lakes, pools, reservoirs, etc. requires a safety zone around the    element

    water sources

    200 m


    The biogas power    plant should be at this distance from flood-prone areas

    Floodwater

    200 m


    National parks    and protected areas need a protected area

    Natural reserves    of places

    500 m
Table 2: Considered environmental and technical-economic constraints on the location of a biogas power plant are considered [28].
Effective criteria in power plant location and evaluation of information layers: According to (Table 3), discrete values 1-7 for normalization were considered for each of the effective criteria (biogas supply, communication roads, transmission lines, rural and urban settlements and surface water resources). Thus, the number 7 has the highest value and the number 1 has the lowest value. It should be noted that in relation to the amount of biogas, the higher the amount, the higher the value. But in the case of infrastructure, the greater the distance between them, the less value they have.
    Discrete values    / criteria

    1

    2

    3

    4

    5

    6

    7


    Amount of waste    and livestock biogas (10,000 tons)

    100>

    100-200

    300-200

    500-300

    800-500

        -

    800<


    Distance from    communication routes (Km)

    20<

    15-20

        -

    10-15

    10-5

        -

    5>


    Distance from    transmission lines (Km)

    50<

    40-50

    30-40

    20-30

    10-20

    5-10

    5>


    Distance from    urban and rural settlements (Km)

    30<

    25-30

    20-25

    15-20

    10-15

    5-10

    5>


    Distance from    surface water sources (Km)

    20<

    15-20

    44910

    44816

    6-9

    3-6

    3>
Table 3: Discretization of the values of biogas plant location criteria [29].
Identify suitable areas for the construction of the power plant: After the analysis performed by the integrated AHP software in GIS and determining the weight of each criterion, the resulting output maps were obtained as suitable areas with the potential to build a power plant, without any restrictions. Then, these maps were superimposed with the maps of the country’s restrictions, and thus, the most suitable areas for the construction of the power plant were identified. Finally, suitable areas in terms of groundwater level were surveyed. So that the areas where the groundwater level was above 10 meters were also removed from the appropriate zones, and thus the areas that did not pose a problem in terms of groundwater pollution and environmental aspects and have a good potential. They were determined in terms of environmental, technical and economic factors.
Introduction of Total Equations, Variables and Model Parameters
The potential of biogas theory is defined as the probable amount of gas production from a biomass, such as manure and rural waste, in an area. This potential can be calculated using parameters such as livestock weight, annual fertilizer production ratio to livestock weight and methane production volume per kilogram of waste. For this purpose, information on the number of livestock, rural population, average amount of wet waste produced by each person and biogas production per kg of livestock manure and rural household waste were collected from the Statistics Center of the Ministry of Agriculture of Iran and previous research. Theoretical methane potential for each province of Iran was calculated according to Equation 1 using the methane potential of each raw material [30].
Where TMP represents the theoretical methane potential (m3/ year), rp represents the rural population, dw represents the degradable waste generated per capita (kg per year), cp represents the cattle population, and SP represents the sheep and goat population. awmc stands for annual weight of cow manure and awms stands for annual weight of sheep and goat manure. Accordingly, the amount of biogas that can be produced depends on the amount of waste available and the total amount of waste solids that can be obtained from livestock or other sources. To present the available methane potential, it was assumed that the biomass would spread evenly throughout the region of each province. The amount of energy produced from methane (MJ /year) was calculated based on Equation 2.
Here, AMP represents available methane production (m3/ year) and ECM is the methane energy content coefficient (MJ/m3), which is considered to be 36 MJ/m3. In order to visualize the spatial distribution of methane production, the annual methane potential was stored in a geographically referenced database considering the type of biomass. ArcGIS was created to display spatial data using information from rural and livestock populations. The same method was applied separately for each source of information, rural population or livestock.
Economic Review of Construction of Biogas Power Plants
Each of the agricultural waste items is used in the livestock and poultry industry. Although this industry is not the only industry that uses agricultural waste, but because most of the agricultural waste is used for livestock and poultry feed, the price of these items in this industry is used to consider the cost of biomass. Table 4 shows a list of common prices for these biomass resources.
    Product type

    Price (USD per    kilogram)


    Wheat bran

    0.2131


    bagas

    0.06


    Beet pulp

    0.1405


    Corn meal

    0.0955


    Cotton meal

    0.34625


    Barley bran

    0.217


    Rice bran and    pulp

    0.067
Table 4: Laboratory values at hospital admission.
These figures show well that in order to obtain a reliable result from a suitable area for the construction of a gas power plant, it seems necessary to pay attention to the price of agricultural waste.
Determining the maximum acceptable cost for biomass: An example is used to obtain the maximum biomass price. Considering the good performance of combined cycles and the significant price of electricity compared to gas, it is assumed that gasification is for the production of electricity (obviously, due to the very low price of gas compared to electricity, the difference in cost and electricity is the difference in cost; There will be more gas supply and less profitability). It is assumed that gasification for the purpose of generating electricity is at least equal to 200 kilowatts of electricity. The information required for this system is provided in (Table 5).
    Account Type

    Hypothetical    power (KWE)

    Life (years)

    Annual operation    (hours)

    Interest rate    (%)

    Investment cost    (million USD)

    Operating cost    (USD per kilojoule)


    Electricity    Production

    200

    15

    5000

    10

    0.0517

    2.2E-07
Table 5: Information required to calculate the annual investment cost and operating cost.
To calculate the annual investment costs, the return-oninvestment factor (CRF) is used in Equation (3), where TCC and ACC are the total cost of investment and the annual cost of investment, respectively.
CRF is also defined according to Equation (4) in terms of system life (N) and interest rate (i) [2].
According to Equation (4), the CRF value for this power generation system will be equal to 0.131. According to the (Table 5), a 200 KW biomass power plant generates 1,000,000 kWh of electricity per year. On the other hand, this amount of production is assumed to be equivalent to 2500 MWh of gas energy, assuming an efficiency of 40%, which is equivalent to 1.730 million cubic meters of synthetic gas per year, assuming that for gas energy (equivalent to 5200 kJ per cubic meter). According to the (Table 5) and relations (3) and (4) and assuming the efficiency of 40% of electricity production from gas and its calorific value, the annual investment cost for the electricity generation system will be equal to 0.5073 cents per cubic meter of synthetic gas.
Operating cost (excluding raw material cost) for the electricity generation system will be equal to 0.1422 cents per cubic meter of gas. Therefore, the total annual costs of investment and operation, excluding the biomass cost for the electricity generation system, will be equal to 0.6495 cents per cubic meter of gas (with a smaller amount will be reduced). Thus, the cost of operation and investment will be approximately equal to 0.65 cents per cubic meter of gas. Assuming the sale of electricity at a price of 0.06 USD per kilowatt hour will be approximately equal to 0.06 million USD per year and the maximum amount of total costs can be calculated. Therefore, the total costs of the power plant (operating costs, annual investment and biomass) should be less than 0.098 USD per cubic meter of gas produced. Therefore, the average cost of biomass should be less than 0.0915 USD per cubic meter of synthetic gas. Two general points can be realized:
• Given the prices presented in (Table 4) and the example mentioned above, it seems that it is probably not cost-effective to use all biomass resources due to agricultural waste, which needs further investigation.
• The purpose of a gas-fired power plant is to produce the maximum possible gas in an area where the biomass cost is less than 0.0915 USD per cubic meter of synthetic gas. Therefore, it is possible that the share of each wood and agricultural biomass in a province is such that all or part of the agricultural surplus can be used in this area.
The effect of biomass cost due to agricultural wastes: In order to take into account the cost of purchasing biomass from agricultural surpluses in the calculations, the method is described as follows. The average cost of each agricultural waste (C waste) in each province is calculated using Equation (5) [32].
In this Equation, mass m, cost C, and subtitle i indicate any agricultural waste. The variable P also indicates the amount of gas extracted from wood waste and that particular species, and N is considered equal to the total number of waste species in each province. Now a suitable criterion can be obtained to compare the cost price of any of the agricultural wastes of the provinces with the species in question. In some provinces and for some types of surpluses, the total cost price is mentioned below the price index, and therefore the final tonnage is equal to the initial tonnage. If the Cwaste value is greater than the index value, the Cwaste value decreases to less than the index value as the tonnage of the inventory decreases.
By calculating the new quantities of the tonnage of each of the agricultural surpluses, provided that the cost price of each category is less than that of the index in question, the total price of the total agricultural surplus is used to the existing agricultural surplus in each province and is calculated by equation 6.
In the above relation, mi, Pa, Pw, and Ci, respectively show, the amount of gas production using wood biomass, the amount of gas production using agricultural biomass, the mass of each type of agricultural biomass, and the unit cost of each type of biomass and Cave is the average cost of raw material used in the gas generator is in a state where free and non-free biomass is used simultaneously.
Depending on the type of biomass used in the reactor, the type of reactor, and its efficiency, the amount of gas synthesized will differ. For example, in a fluidized bed reactor, the gas production efficiency is relatively high, about 55 percent. This yield is obtained by comparing the calorific value of the gas produced and the calorific value of the biomass entering the reactor. In order to obtain the approximate volume of synthetic gas by gasification method in the country (by province), it is assumed that 1.97 cubic meters of gas will be produced per kilogram of biomass entering the reactor. The generated gas can be used for heating, gas supply, or electricity generation.
Results and Discussion
GIS Results
The biogas potential of manure, including cattle, sheep, and goats, was calculated for all provinces of Iran. The results were classified, and a GIS database was generated. Areas constrained by the power plant construction mainly include human habitation areas or are primary areas of environmental value. The pairwise comparison matrix and the weight obtained from AHP for each of the criteria are also shown in (Table 6).
    Criteria

    Weight criteria

    Water sources

    Residence

    Power    transmission lines

    Access routes

    Biogas supply


    Biogas supply

    0/4699

    6

    5

    4

    3

    1


    Access routes

    0/2619

    5

    4

    3

    1

    0/33


    Power    transmission lines

    0/1441

    4

    3

    1

    0/33

    0/25


    Residence

    0.0792

    3

    1

    0/33

    0/25

    0/2


    Surface water    resources

    0.0448

    1

    0/33

    0/25

    0/2

    0/17
Table 6: Paired comparison matrix in AHP and determination of the weight of each criterion.
As shown in the table, the highest weights in AHP are allocated to biogas supply criteria, communication routes, transmission lines, habitats, and surface water resources, respectively. Given that the compatibility ratio in AHP was 0.7, the relative weight given to the criteria is reasonable, and there is no need to reconsider the judgments. Methane production maps are presented in (Figures 4 to 7) for each biomass source. The total amount of livestock manure in Iran was estimated at 18.92 million tons per year, producing 2260 million cubic meters per year of methane. The amount of rural waste for people across Iran was considered based on the Organization of Iranian Municipalities, and a total of 1.8 million tons of rural waste per year is calculated, which can produce 233.9 million cubic meters per year of methane.
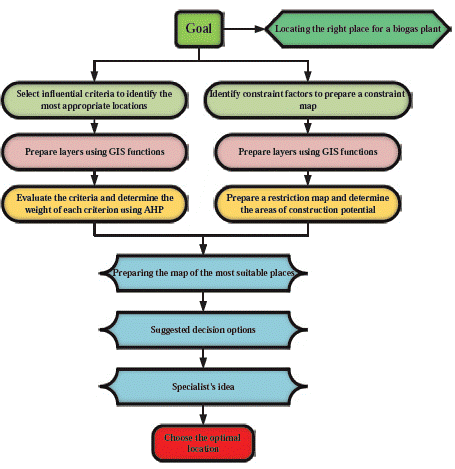
Figure 4: Proposed flow diagram for biogas power plant location.
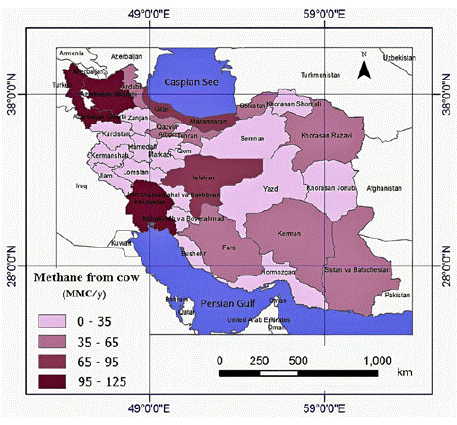
Figure 5: Map of methane production from cattle manure in Iran.
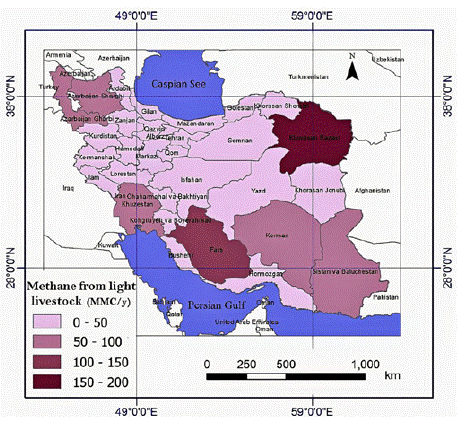
Figure 6: Map of methane production from light livestock manure in Iran.
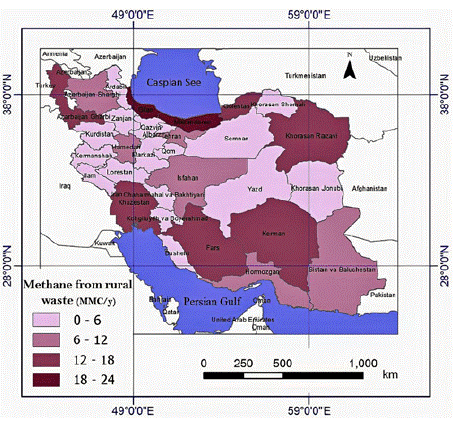
Figure 7: Map of methane production from rural household waste in Iran.
Figure 8 shows a map of methane production from the mentioned biomass resources with a total amount of 2494.3 million cubic meters per year. Comparing two biogas sources in rural areas showed that animal manure has a much greater potential than rural waste in biogas production in Iran.
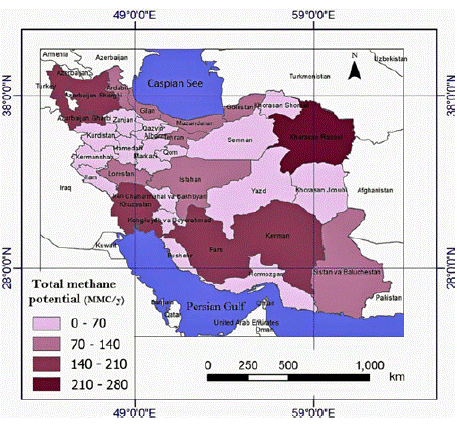
Figure 8: Map of methane production from livestock manure and rural waste in Iran.
Figure 9 shows the map of the site’s suitability for the construction of a biogas plant in Iran. The best places are sites that produce 210- 280 million cubic meters per year. Other classifications are good areas with methane production of 140-210 million cubic meters per year, relatively good areas with 140-170 million cubic meters per year, and worst areas with less than 70 million cubic meters per year.
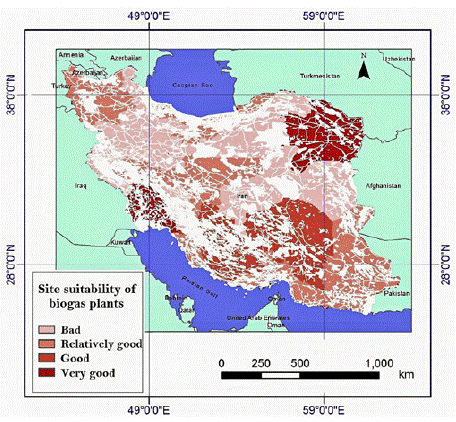
    Figure 9: Map of the suitability of the site for the construction of a biogas

plant in Iran.
Economic Results of the Construction of a Biogas Power Plant
In this section, the total amount of agricultural waste in each province is calculated in a situation where the average numerical cost of each agricultural waste (Cwaste) is less than the explicitly mentioned. The amount of synthetic gas produced in each province is one million cubic meters, and the average cost of biomass is USD per cubic meter of synthetic gas. As expected, in none of the country’s provinces is it possible to use all economically viable biomass resources. Therefore, according to the cost of any excess, the tonnage is recalculated to balance the price.
The results presented for the average of the total cost of biomass in each province are calculated according to the assumption that the cost of any waste is less than 0.0915 USD and are presented in (Table 7).
    State

    The tonnage of    waste for Cwaste of each product less than 0.0915 USD

    Cwaste

    Cave


    Grain

    Wheat

    Rice

    Sugar cane

    cotton

    Corn

    Grain

    Wheat

    Rice

    Sugar cane

    cotton

    Corn


    East Azarbaijan

    30393

    49351

    6331

    0

    3345

    3753

    0.1726

    0.22035

    0.0072

    0

    0.01375

    0.0144

    0.053


    Western    Azerbaijan

    50621

    82197

    17

    0

    0

    27744

    0.11765

    0.21865

    0

    0

    0

    0.05495

    0.0688


    Ardabil

    11119

    18056

    0

    0

    8171

    11725

    0.2597

    0.2338

    0

    0

    0.07465

    0.15455

    0.08785


    Esfahan

    12633

    20513

    78229

    0

    9561

    13324

    0.27255

    0.226

    0.06825

    0

    0.0765

    0.1045

    0.0849


    Ilam

    1556

    2526

    2226

    0

    0

    1641

    0.28875

    0.2361

    0.0343

    0

    0

    0.28095

    0.08035


    Bushehr

    2042

    18537

    0

    0

    0

    8643

    0.0211

    0.17415

    0

    0

    0

    0.0723

    0.0694


    Tehran

    9184

    14913

    0

    0

    3684

    0

    0.28515

    0.2306

    0

    0

    0.0453

    0

    0.08265


    Chaharmahal va    Bakhtiari

    7257

    11783

    18358

    0

    0

    349

    0.2271

    0.2257

    0.0476

    0

    0

    0.00565

    0.0914


    southern    Khorasan

    1328

    2165

    0

    0

    1270

    150

    0.312

    0.23505

    0

    0

    0.28965

    0.01315

    0.0802


    Khorasan Razavi

    12391

    20121

    6536

    0

    11856

    3335

    0.3091

    0.23505

    0.02205

    0

    0.22095

    0.0297

    0.07155


    North Khorasan

    4057

    6588

    7951

    0

    3882

    0

    0.29395

    0.2352

    0.04145

    0

    0.2338

    0

    0.081


    Khuzestan

    23862

    38747

    43327

    960081

    0

    25161

    0.1088

    0.23215

    0.03965

    0.0839

    0

    0.22725

    0.08345


    Zanjan

    15669

    25444

    3238

    0

    0

    45

    0.1934

    0.22985

    0.00705

    0

    0

    0.0003

    0.08155


    semnan

    7824

    12704

    0

    0

    6265

    1873

    0.2537

    0.22095

    0

    0

    0.0799

    0.02665

    0.0794


    Sistan and    Baluchestan

    12915

    20971

    4362

    0

    0

    13618

    0.11555

    0.20825

    0.011

    0

    0

    0.10635

    0.07915


    Fars

    44012

    71466

    136474

    0

    15570

    46409

    0.1619

    0.2289

    0.05265

    0

    0.04055

    0.2719

    0.07665


    Qazvin

    4167

    6767

    5774

    0

    892

    4394

    0.30115

    0.2341

    0.0335

    0

    0.0257

    0.28995

    0.07215


    Qom

    778

    1263

    0

    0

    744

    820

    0.3241

    0.2332

    0

    0

    0.21745

    0.11155

    0.08795


    kurdistan

    16941

    27509

    0

    0

    0

    10056

    0.13295

    0.23075

    0

    0

    0

    0.05875

    0.0699


    Kerman

    40450

    65681

    0

    0

    2152

    42653

    0.1042

    0.1991

    0

    0

    0.00675

    0.2133

    0.07925


    Kermanshah

    17263

    28032

    130

    0

    0

    18203

    0.2785

    0.23215

    0.0003

    0

    0

    0.2825

    0.0783


    Kohkiluyeh and    Boyer Ahmad

    10538

    17153

    17557

    0

    0

    11139

    0.1717

    0.2179

    0.03765

    0

    0

    0.1209

    0.0807


    Golestan

    12475

    20257

    312178

    0

    11936

    6716

    0.2719

    0.23505

    0.08785

    0

    0.1025

    0.05415

    0.08725


    Gilan

    8286

    23222

    749979

    0

    0

    135

    0.0139

    0.02615

    0.07835

    0

    0

    0.00015

    0.05685


    Lorestan

    10535

    17107

    204778

    0

    0

    11109

    0.2727

    0.2323

    0.0413

    0

    0

    0.22525

    0.08115


    Mazandaran

    29674

    48184

    104813

    139

    721

    242

    0.1616

    0.1934

    0.09105

    0.005

    0.00305

    0.0009

    0.0815


    Markazi

    3804

    6176

    0

    0

    1098

    2774

    0.2938

    0.23475

    0

    0

    0.0338

    0.0693

    0.07815


    Hormozgan

    1896

    29008

    0

    0

    361

    18837

    0.01285

    0.16725

    0

    0

    0.0026

    0.17935

    0.06055


    Hamedan

    12249

    19891

    0

    0

    0

    12917

    0.2875

    0.2335

    0

    0

    0

    0.2436

    0.0912


    Yazd

    3141

    5109

    36

    0

    610

    3318

    0.21575

    0.228

    0.00155

    0

    0.02355

    0.2574

    0.0694
Table 7: Cwaste and Cave parameter values by-product and province in Tomans per cubic meter of synthetic gas.
In (Table 7), according to Cave’s biomass resources and economic parameters, Mazandaran province, with a production capacity of 3141 million cubic meters of synthetic gas per year, is the best province for constructing a gas-fired power plant. After Mazandaran province, the three provinces of Gilan, Khuzestan, and Fars, with the potential of producing 3095, 2767, and 1757 million cubic meters of synthetic gas per year, respectively, have the second to fourth ranks as the best places for the construction of a gas power plant.
The biomass resources used in the four provinces mentioned above are different from each other. In each of the provinces, an attempt has been made to use the maximum amount of agricultural waste so that the average cost of any waste is less than 0.183 USD per kilogram. For this reason, the average price of extractable gas varies from province to province. Another assumption is that the average cost of gas (Cave) for all provinces can be increased to 0.0915, in which case the maximum amount of agricultural waste is taken into account. Of course, it should be noted that in these circumstances, there is a possibility that the condition of the lower average cost will not be satisfied with any redundancy (Cwaste), but in general, the total price of agricultural waste in each province is less than the mentioned index. If all the biomass economic resources in Mazandaran province are used to generate electricity and to assume 40% efficiency for a combined cycle power plant, (it is important to note that although combined cycle power plants can operate at slightly better efficiencies, Assumption of the power plant efficiency can compensate for the error caused by the lack of access to and collection of all biomass resources), A power plant with a maximum capacity of 150 MW can be built in this province. The power plant capacity that can be built for Gilan, Khuzestan, and Fars can be a maximum of 145, 130, and 85 MW, respectively. It is necessary to pay attention to the fact that in this case, it will not be possible to supply gas because all the biomass resources of the province are used to generate electricity, although for heating purposes can be used these heating units of power plants along with electricity generation units that cause higher efficiency of the system and the prevention of energy waste. It is possible to build units with fewer capacities (less than the total capacity of the province) for the industrial units of these provinces.
Conclusion
Significant amounts of biomass, such as manure and rural household waste, are available in rural areas of Iran. Biomass can be used as a valuable source of renewable energy. For proper energy plan planning, it is necessary to estimate the amount of organic matter in the area. Therefore in this study:
• The potential of biogas production from livestock manure and rural waste and the distribution and suitability of their site for the installation of biogas plants using GIS in all provinces of Iran were analyzed. The total amount of 2494.3 million cubic meters per year of methane in the whole study area is estimated, and the energy equations are calculated at 89.8 *E9 MJ. This significant amount of energy can play an essential role in meeting the energy needs of the agricultural sector and rural areas. It is concluded that biogas can be used as an energy source in many rural areas of Iran. At the same time, in addition to achieving economic benefits, it can also reduce environmental impact.
• Economic analysis showed that it is economically justified if the power plant’s construction cost is less than 0.098 USD per cubic meter of gas produced and the average cost of biomass is less than 0.0915 USD per cubic meter of synthetic gas. Therefore, it may not be possible to use the full potential of agricultural waste to justify the construction of a biogas plant.
• Mazandaran province has the most optimal conditions for the construction of a biogas power plant so that if all biomass resources in Mazandaran province are used to generate electricity and to assume 40% efficiency for a combined cycle power plant, this province has the potential to build a power plant with a maximum capacity of 150 MW. The power plant capacity that can be built for Gilan, Khuzestan, and Fars can be a maximum of 145, 130, and 85 MW, respectively.
References
- D Borzuei, SF Moosavian, M Farajollahi. On the Performance Enhancement of the Three-Blade Savonius Wind Turbine Implementing Opening Valve. Journal of Energy Resources Technology. 2021; 143 5.
- SF Moosavian, D Borzuei, A Ahmadi. Energy, exergy, environmental and economic analysis of the parabolic solar collector with life cycle assessment for different climate conditions. Renewable Energy. 2021; 165: 301-320.
- R Zahedi, A Ahmadi, M Sadeh. Investigation of the load management and environmental impact of the hybrid cogeneration of the wind power plant and fuel cell. Energy Reports. 2021; 7: 2930-2939.
- Dollhofer V, Podmirseg SM, Callaghan TM, Griffith GW, Fliegerová K. Anaerobic Fungi and Their Potential for Biogas Production. Advances in biochemical engineering/biotechnology. 2015; 151: 41-61.
- J Yao, M Kraussler, F Benedikt, H. Hofbauer. Techno-economic assessment of hydrogen production based on dual fluidized bed biomass steam gasification, biogas steam reforming, and alkaline water electrolysis processes. Energy Conversion and Management. 2017; 145: 278-292.
- NA Samiran, MNM Jaafar, J-H Ng, SS Lam, CT Chong. Progress in biomass gasification technique – With focus on Malaysian palm biomass for syngas production. Renewable and Sustainable Energy Reviews. 2016; 62: 1047- 1062.
- Y Chen, W Hu, Y Feng, S Sweeney. Status and prospects of rural biogas development in China. Renewable and Sustainable Energy Reviews. 2014; 39: 679-685.
- K Åberg, L Pommer, A Nordin. Syngas production by combined biomass gasification and in situ biogas reforming. Energy & Fuels. 2015; 29: 3725- 3731.
- ZM Bundhoo, S Mauthoor, R Mohee. Potential of biogas production from biomass and waste materials in the Small Island Developing State of Mauritius. Renewable and sustainable energy reviews. 2016; 56: 1087-1100.
- B Sliz-Szkliniarz, J Vogt. A GIS-based approach for evaluating the potential of biogas production from livestock manure and crops at a regional scale: A case study for the Kujawsko-Pomorskie Voivodeship. Renewable and Sustainable Energy Reviews. 2012; 16: 752-763.
- P Abdeshahian, JS Lim, WS Ho, H Hashim, CT Lee. Potential of biogas production from farm animal waste in Malaysia. Renewable and Sustainable Energy Reviews. 2016; 60: 714-723.
- MM Ali, M Ndongo, B Bilal, K Yetilmezsoy, I Youm, M Bahramian. Mapping of biogas production potential from livestock manures and slaughterhouse waste: A case study for African countries. Journal of Cleaner Production. 2020; 256: 120499.
- IL Moreda. The potential of biogas production in Uruguay. Renewable and Sustainable Energy Reviews. 2016; 54: 1580-1591.
- J Lansche, S Awiszus, S Latif, J Müller. Potential of Biogas Production from Processing Residues to Reduce Environmental Impacts from Cassava Starch and Crisp Production—A Case Study from Malaysia. Applied Sciences. 2020; 10: 2975.
- M Rios, M Kaltschmitt. Electricity generation potential from biogas produced from organic waste in Mexico. Renewable and Sustainable Energy Reviews. 2016; 54: 384-395.
- HN Gavala, A Grimalt-Alemany, K Asimakopoulos, IV Skiadas. Gas Biological Conversions: The Potential of Syngas and Carbon Dioxide as Production Platforms. Waste and Biomass Valorization. 2021.
- FJ Lozano, R. Lozano. Assessing the potential sustainability benefits of agricultural residues: Biomass conversion to syngas for energy generation or to chemicals production. Journal of Cleaner Production. 2018; 172: 4162- 4169.
- X Yao, Z Zhao, S Chen, H Zhou, K Xu. Migration and transformation behaviours of ash residues from a typical fixed-bed gasification station for biomass syngas production in China. Energy. 2020; 201 117646.
- Cu TTT, Nguyen TX, Triolo JM, Pedersen L, Le VD, Le PD, et al. Biogas Production from Vietnamese Animal Manure, Plant Residues and Organic Waste: Influence of Biomass Composition on Methane Yield. Asian- Australasian Journal of Animal Sciences. 2015; 28: 280-289.
- W Uddin et al. Biogas potential for electric power generation in Pakistan: A survey. Renewable and Sustainable Energy Reviews. 2016; 54: 25-33.
- A. Sultana and A. Kumar. Optimal siting and size of bioenergy facilities using geographic information system. Applied Energy. 2012; 94: 192-201.
- A Nzila, J Dewulf, H Spanjers, H Kiriamiti, H Van Langenhove. Biowaste energy potential in Kenya. Renewable energy. 2010; 35: 2698-2704.
- X Shi, Elmore A, Li X, Gorence NJ, Jin H, et al. Using spatial information technologies to select sites for biomass power plants: A case study in Guangdong Province, China. Biomass and Bioenergy. 2008; 32: 35-43.
- H Zabihi, Alizadeh M, Langat PK, Karami M, Shahabi H, et al. GIS Multi- Criteria Analysis by Ordered Weighted Averaging (OWA): toward an integrated citrus management strategy. Sustainability. 2019; 11: 1009.
- R Zahedi, AB Rad. Numerical and experimental simulation of gas-liquid twophase flow in 90-degree elbow. Alexandria Engineering Journal. 2021.
- A Müller, Weigelt J, Gowtz A, Schmidt O, Alva IL, et al. The role of biomass in the sustainable development goals: a reality check and governance implications. Institute for Advanced Sustainability Studies: Potsdam, Germany. 2015.
- L Olsson, M Fallde. Waste (d) potential: a socio-technical analysis of biogas production and use in Sweden. Journal of Cleaner Production. 2015; 98: 107- 115.
- S Kheybari, FM Rezaie. Selection of biogas, solar, and wind power plants’ locations: An MCDA approach. Journal of Supply Chain Management Science. 2020; 1: 45-71.
- H Yousefi, H Hafeznia, A Yousefi-Sahzabi. Spatial site selection for solar power plants using a gis-based boolean-fuzzy logic model: A case study of Markazi Province, Iran. Energies. 2018; 11: 1648, 2018.
- EC Chukwuma, FC Okey-Onyesolu, KA Ani, EC Nwanna. GIS bio-waste assessment and suitability analysis for biogas power plant: A case study of Anambra state of Nigeria. Renewable Energy. 2021; 163: 1182-1194.
- MK Manesh, A Rezazadeh, S Kabiri. A feasibility study on the potential, economic, and environmental advantages of biogas production from poultry manure in Iran. Renewable Energy. 2020; 159: 87-106.
- Z Rouhollahi, M Ebrahimi-Nik, SH Ebrahimi, MH Abbaspour-Fard, R Zeynali, MR Bayati. Farm biogas plants, a sustainable waste to energy and biofertilizer opportunity for Iran. Journal of Cleaner Production. 2020; 253: 119876.