Research Article
Austin J Anal Pharm Chem. 2014;1(1): 1001.
Determination of Paracetamol and Ibuprofen in Tablets and Urine Using Spectrofluorimetric Determination Coupled with Chemometric Tools
Luna AS* and Pinho JSA
Department of Analytical Chemistry, Rio De Janeiro State University, Brazil
*Corresponding author: :Luna AS, Department of Analytical Chemistry, Rio de Janeiro State University, 524, São Francisco Xavier St, Rio de Janeiro, Rio de Janeiro, Brazil.
Received: June 06, 2014; Accepted: June 17, 2014; Published: June 18, 2014
Abstract
It was developed a methodology for spectrofluorimetric determination of Paracetamol (PAR) and Ibuprofen (IBU) in tablets (synthetic mixtures) and biological fluids (urine) coupled with chemometrics. For tablet’s determination, it was used PLS (Partial Least Squares) and for urine samples it was used PARAFAC (Parallel Factor Analysis). In both cases, it was possible to quantify both analytes in samples. The proposed methodology showed effectiveness and offered excellent results in the determination of PAR and IBU. Recovery study test was performed in urine samples, and it offered good results also. Figures of merit were established.
Keywords: Paracetamol; Ibuprofen; PARAFAC; Spectrofluorimetric determination; Urine, Drugs
Introduction
In last years, the combination of chemometric methods and molecular spectroscopy techniques presented good contribution in analytical chemistry. One application of this combination is a direct determination of drugs that showed to be effective in many cases. Although United States Pharmacopeia (USP) do not recommend multivariate methodologies, a recent revision in literature showed an increasing of publications using chemometric methods coupled with different techniques [1].
Nowadays the most of methodologies for drugs determination are based on chromatographic techniques and univariate calibration determination. Although these methodologies are well established, they can present some disadvantages. Caused by this, the combination of molecular spectroscopy and multivariate calibration represent an alternative for direct drug determination. When it is developed a new methodology, it is necessary to establish figures of merit for it to have reliable results [2].
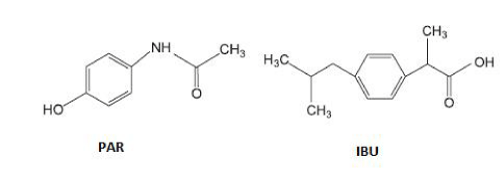
Paracetamol (PAR) and Ibuprofen (IBU) (Figure 1) are among the most consumed drugs in the world. PAR has an analgesic and antipyretic state similar to aspirin showing the advantage of no irritating the gastrointestinal mucosa while IBU is a non-steroidal anti-inflammatory drug that also has analgesic and antipyretic power [3].
Figure 1: Structural formula of Paracetamol and Ibuprofen.
Based on literature data, for PAR the pKA value is 9.5 while for IBU is 4.4. Acid structure of PAR is predominant under pH = 9.5 and presents a maximum of absorption in 243 nm (spectra obtained experimentally in pH = 7) what increases overlap with IBU. Therefore, it is better to work with basic pH (close to 10) because in this case the overlap decreases [3].
Many methods were used for individual determination of each one of these analytes in tablets. Ramos et al. [4] performed a determination of acetaminophen by flow injection with on-line chemical derivatization and investigated it using FTIR and spectrophotometry. Milch et al. [5] used derivative spectrophotometric assay of acetaminophen and spectrofluorimetric determination of its main impurity. Moreira et al. [6] performed a direct determination of paracetamol powdered pharmaceutical samples by fluorescence spectroscopy. Ramos - Martos et al. [7] applied liquid chromatography for simultaneous determination of paracetamol and others compound (acetylsalicylic acid, caffeine, codeine, pyridoxine and thiamine) in pharmaceutical preparations.
Hergert et al. [8] performed a spectrofluorimetric study of beta - cyclodextrin-ibuprofen complex and determination of ibuprofen in pharmaceutical preparations and serum. Elragehy et al. [9] performed a spectrophotometric determination of ibuprofen via its Cooper (II) complex. Gazco – Lopez [10] developed a liquid chromatography method for ibuprofen and validated it in different pharmaceuticals. Tsao et al. [11] used high liquid chromatography for determination of ibuprofen in bulk drugs and tablets. Donato et al. [12] developed a methodology to determinate non - steroidal anti-inflammattory drugs (such as ibuprofen) in pharmaceuticals by capillary zone electrophoresis and micellar electrokinetic capillary chromatography. Staden et al. [13] developed a simple method for rapid determination of PAR in pharmaceutical formulations performing oxidation of PAR by Potassium hexacyanoferrate (III) and subsequent reaction with phenol in the presence of ammonia and it was performed a spectrometric determination of the blue complex formed.
Although there are many developed methods for determination of PAR or IBU, simultaneous determination of them is related in few articles. Husain et al. [14] developed a method for simultaneous determination of IBU and PAR in pharmaceutical preparations by 1H Fourier transforms Nuclear Magnetic Resonance (NMR) spectroscopy but is an expensive and considerable few accessible technique. Simões et al. [15] proposed a methodology for prediction of concentration of PAR in tablets (theoretical amount of 500 mg) aiming to control of its quality using diffuse reflectance NIR technique coupled with chemometric such as SPA (Successive Projection Algorithm) and GA (Genetic Algorithm) for selecting more informative spectral variables. Sena et al. [3] performed a simultaneous spectrophotometric determination of Paracetamol and Ibuprofen in pharmaceutical formulations by multivariate calibration (PLS – Partial Least Squares). Considering that for this methodology it is necessary to know the composition of samples, what means that if there is any interfering it should be present in calibration group as well. The adaptation of this methodology and its extension for urine samples needed the use of the second order multivariate calibration such as PARAFAC that allows identify analytes (in this case PAR and IBU) even in a complex matrix such as urine.
The fact of PAR and IBU present overlap spectra in UV makes that is not possible to perform direct and simultaneous determinations [3]. Thus, it is necessary to use a combination of analytical technique and chemometrics for this purpose. Caused by that, the proposal of this article is to develop a spectrofluorimetric method for simultaneous determination of Paracetamol and Ibuprofen using spectrofluorimetric determination coupled with PLS for tablets and coupled with PARAFAC for urine samples.
Chemometric Theory
Partial Least Squares (PLS)
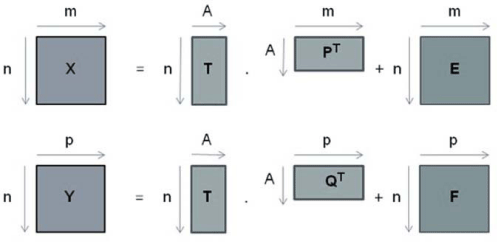
It is a linear regression method in which two data group are worked: X and Y, where generally matrix X (m x n) contains spectroscopic data (independent variable) and matrix Y (p x n) contains physical chemical data associated (dependent variable) as shown in equations 1 and 2 respectively [16]
where T is a matrix of scores, P and Q are matrixes of loadings, E and F are matrixes of residual of X and Y respectively.
In Figure 2 it is represent matrix decomposition of PLS data
Figure 2: Representation of matrix decomposition of PLS data.
Parallel Factor Analysis (PARAFAC)
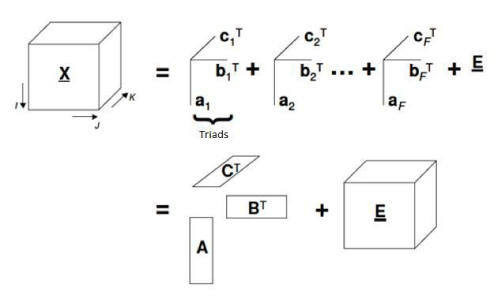
PARAFAC is classified as a second order calibration technique. This type of calibration consists in two steps: modeling (establishes a mathematical relationship between matrices X and Y during calibration) and validation of the model. Based on that in the prediction step the instrumental signal of the sample is used to get the unknown concentration [17]. It is a decomposition method for three-way data [18]. This data decomposition is performed in trilinear components – one score vector and two loadings vectors (Figure 3) [19].
Figure 3: Geometric representation of PARAFAC model (decomposition of tridimensional data).
In PARAFAC, an element xijk for tensor X is decomposed such
where N is the total number of chemical components that produces a response or signal; Eijk is an element of residual error of tensor E (with same dimensions of X), ani, bnj, cnk are element of the column vector an, bn and cn which corresponds to relative concentrations [(I+1) x1], emissions profiles (Jx1) and excitation profiles (Kx1), for each one of N components, respectively. Column vector an, bn and cn are related in scores matrixes A (contains component relative concentration) and loading matrices B and C (with normalized column) [20].
Sometimes it is difficult to select the adequate number of component in PARAFAC, but there are some methods to perform this selection but due to the complexity of this problem they cannot guarantee results in every case. One of these methods is named as diagnostic of model consistency as known as Core Consistency (CC) that is applied in three-way multivariate analysis especially in PARAFAC [20]. This parameter expression can be observed following [19] in equation 4:
where ci,j,k is an element of matrix and S is the super diagonal matrix containing values equals one in diagonal and zero in the other position for PARAFAC adjust.
Figures of Merit for multivariate calibration
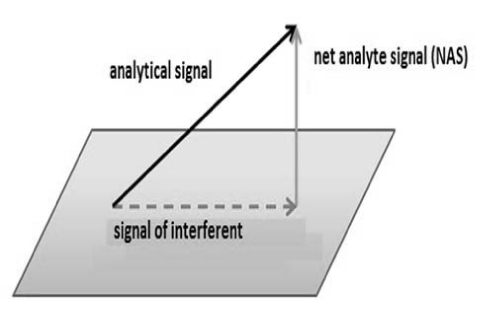
Some chemometrics use concept of Net Analytical Signal (NAS) in the determination of some figures of merit such as selectivity, sensibility and analytical sensibility. NAS (Figure 4) is the portion of analytical signal that is orthogonal to the other signals that are present in sample [21].
Figure 4: NAS representation.
Limit of detection (LOD) and Limit of quantification (LOQ): Limit of detection (LOD) is a small concentration that can be detected, but not necessary quantified while limit of quantification (LOQ) is a small concentration that can be quantified according to Valderrama et al. [21]. Both equations (5) and (6) can be seen below.
Where S is the angular coefficient of analytical curve and s is the standard deviation of the blank measurements.
Sensibility, analytical sensibility and selectivity: According to Valderrama et al. [21], the sensibility corresponds to the portion of the signal responsible by increase of the unit of concentration of interest property. The analytical sensibility presents the method sensibility in terms of concentration unit that is used being defined as the ratio of sensitivity and standard deviation of the signal reference. Finally, the selectivity is a measure of the overlap grade between signal of analyte and interferents present in the sample indicating the part of this signal that is lost by this overlap. All equations (7), (8) and (9) are presented below (in order that they were mentioned in text)
Where B and C are matrices that possess in columns the profile for all components in first and second dimension respectively. Pb,uxx and Pc,unx are identity matrices and kk is a total signal for ‘k’ component. δxis referent to the standard deviation of the reference signal estimated, nâsk,I is the scalar value of net analytical signal for sample i, while xk,I is a vector of the instrumental response for sample i.
Precision and accuracy: Precision can be expressed as a standard deviation (SD) or Relative Standard Deviation (RSD) of a series of measures. Precision evaluates the how close an obtained value is closer to another one in multiple measurements of the same sample. Equation 10 shows the calculation of standard deviation (SD) that is the most for estimation of a method precision [20].
Where x is the average value and n is the number of samples.
Accuracy indicates how much an estimated value is close to a reference value. For evaluate accuracy of the method, it can be used reference material, comparison between methods, recovery tests, and standard addition [20].
Second order standard addition
An extension of standard addition method to multivariate data (Generalized standard addition method – GSAM) that requires that analyte and the interferents be in the sample in a sequential way was proposed for Saxberg and Kowalski [22]. Booksh et al. [17] proposed an extension of this method for multidimensional data, the second order standard addition method (SOSAM) that uses Direct Trilinear Decomposition (DTD). There are many papers that show PARAFAC and SOSAM applications. Luna et al. [23] used a spectrofluorimetric method to determine drugs (Levofloxacin) in biological fluids coupled with PARAFAC and SOSAM. Valderrama [24] proposed a methodology for quantifying Ibuprofen enantiomers by molecular fluorescence coupled with PARAFAC and SOSAM. Silva et al. [25] proposed a direct determination of propranolol (that is an anti - hypertensive pharmaceutical) in urine by spectrofluorimetry coupled with PARAFAC and SOSAM. Bernardes et al. [26] proposed a direct determination of trans-resveratrol in human plasma by spectrofluorimetry and SOSAM. Luna et al. [20] developed a methodology for determination of Norfloxacin in urine samples by spectrofluorimetry couple with PARAFAC. Caused by that it was possible to eliminate some initial steps for sample preparation what simplified the experimental procedure.
Material and Methods
PAR and IBU standards were purchased from Sigma Aldrich. It was necessary to use methanol (UV – HPLC Spectroscopic Grade from Tedia, Brazil) for preparing the stock solution, because of low solubility of IBU in water and ethanol. Stock solution was prepared weighting 100 mg of analyte and the final solution had 100.0 mL, it means the stock concentration solution was 1000 mg. L-1. This solution was protected from light for better conservation. Dilution of stock solution was carried out using Mili-Q water. An analytical balance (Mettler Toledo AL204, Switzerland) was used to weight the standard and tablets samples. An ultrasound (Ultrasonic Clear Branson 2000, Taiwan) was used to help dissolving the analyte.
For standard solutions, the analytical curve can be seen in Table 1. It was added 1 mL of buffer solution to all samples for keeping the pH equal to 10.5. This buffer solution was prepared using NH4OH/ NH4Cl. All solutions were done in triplicate, and blank solution was buffer.
    [PAR] mg.L-1
    [IBU] mg.L-1


    10
    2


    12
    3


    14
    4


    16
    5


    18
    6


    20
    7
Table 1: Analytical Curve for PAR and IBU.
For the determination in tablets, it was weighted 10 pills of PAR and after that they were pulverized and the average weight was measured and with it was prepared the stock solution. The same procedure was performed for IBU. In the case of PAR, the theoretical value of it in tablet is 750 mg (for Tylenol) and 500 mg (for Sonridor), so the stock solution had a concentration of 7500 mg. L-1 and 5000 mg. L-1. In the case of IBU, the theoretical value in the tablet was 600 mg (for Ibuprofen) and 200 mg (for Advil), so the stock solution had a concentration of 6000 mg. L-1 and 2000 mg. L-1 (it was prepared 100 mL of each solution). In both cases, before to use the stock solution, the solutions were filtered with a cellulose acetate (0.75 μm) filter. Successive dilution it was performed, and the range worked was the same used for aqueous standard solutions for PAR and IBU. In this case, all samples were composed of a mixture of PAR and IBU (Table 2). Once more, pH was fixed in 10.5 with a buffer solution. All solutions were done in triplicate, and blank solution was buffer solution.
    Sample
    [PAR] mg.L-1
    [IBU] mg.L-1


    A
    10
    2


    B
    12
    3


    C
    14
    4


    D
    16
    5


    E
    18
    6


    F
    20
    7
Table 2: Drug samples..
For urine tests, samples of six different healthy people (both genders) were used. Dilution of urine was tested in three different levels (100, 500 and 1000 times). In this case, the pH was once again fixed in 10.5. Different amounts of standard solution of PAR and IBU were added to the urine previously diluted (Table 3). All solutions were done in triplicate, and blank solution was diluted urine and buffer solution. In this case, the purpose was to check if the developed methodology would be able to identify analytic spectra and also perform a recovery test of amounts of analytes added.
    Sample
    [PAR] mg.L-1
    [IBU] mg.L-1


    A
    10
    3


    B
    12
    4


    C
    14
    5


    D
    16
    6
Table 3: Urine samples..
A spectrofluorimeter, model Fluorat 02 from Panorama (Lumex, Russia) with a quartz cuvette of 1.00 cm of the optical path was used for the measurements (standard, tablets and urine solutions). The Excitation-Emission Matrix Surfaces (EEMs) were obtained in the excitation range from 220 – 248 nm and the emission range from 280 – 375 nm (step of 2 nm for both).
Results and Discussion
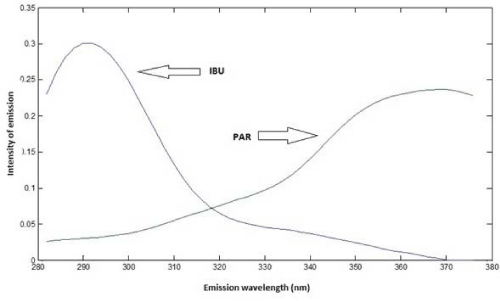
Based on spectra of individual analytes, to obtain emission spectra of samples, the excitation wavelength was set in 228 nm for IBU and 246 nm for PAR. Based on Figure 5, it is possible to observe that there is an emission peak at 288 nm (IBU) and another one at 366 nm (PAR). For the quantification of both analytes, it was used PLS regression.
Figure 5: Emission spectra of IBU and PAR.
Because drug samples contained two different analytes but that did not present problems of overlapping in the emission spectrum it was possible to calibrate once analyte at time. Based on this in PLS model for IBU it was chosen to work with three Latent Variables (LVs) being 99.98% of the variance captured by the model in X block and 94.98% of the variance captured by the model in Y block. Similar procedure was done for PAR and based on this in PLS model it was chosen to work with two Latent Variables (LVs) being 99.94% of the variance captured by the model in X block and 84.08% of the variance captured by the model in Y block.
Each mixture of drug samples was prepared by diluting the stock solution drug samples. So based on this fact, for calculating the content of PAR and IBU in tablets it was considered the dilution factor for each level of concentration. It is possible to observe that for four drugs good results were obtained for IBU and PAR what showed that developed methodology is efficient in the determination of both analytes (Table 4).
    Analyte
    Drug
    D.M.C (± S.D) (mg)
    D.E.C (mg)
    RSD (%)


    Ibuprofen
    Ibuprofen
    599 ± 9
    600
    1.6


    Advil
    199 ± 11
    200
    5.3


    Paracetamol
    Sonridor
    500 ± 14
    500
    2.8


    Tylenol
    751 ± 15
    750
    2.0
Table 4: Results for drug samples..
It was possible also perform determination of precision (Table 5 and 6) and accuracy (Table 7 and 8) by a recovery test.
    Drug
    Theoretical concentration (mg.L-1)
    Mean* ± SD**
    RSD (%)


    Ibuprofen
    3.00
    3.06 ± 0.03
    0.98


    4.00
    3.87 ± 0.03
    0.78


    5.00
    5.06 ± 0.01
    0.20


    Advil
    3.00
    2.99 ± 0.03
    1.00


    4.00
    3.98 ± 0.01
    0.25


    5.00
    5.06 ± 0.02
    0.40
Table 5: Precision results for IBU in tablets..
    Drug
    Theoretical concentration (mg.L-1)
    Mean* ± SD**
    RSD (%)


    Sonridor
    12.00
    12.10 ± 0.02
    0.74


    14.00
    13.80 ± 0.04
    0.44


    16.00
    16.02 ± 0.01
    0.25


    Tylenol
    12.00
    12.15 ± 0.05
    0.41


    14.00
    14.12 ± 0.04
    0.28


    16.00
    16.11 ± 0.10
    0.63
Table 6: Precision results for PAR in tablets.
    Solution
    AC
    MEC
    MR (%)
    SD (%)


    D1
    D2
    D1
    D2
    D1
    D2


    A
    2
    1.99
    1.99
    99.83
    99.67
    0.58
    1.04


    B
    3
    3.04
    2.99
    101.22
    99.56
    0.19
    0.20


    C
    4
    4.05
    4.05
    101.33
    101.25
    0.76
    0.50


    D
    5
    4.91
    4.98
    98.20
    99.53
    1.93
    0.30


    E
    6
    6.05
    6.05
    100.83
    101.17
    0.76
    0.50
Table 7: Recovery test for IBU in tablets.
    Solution
    AC
    MEC
    MR (%)
    SD (%)


    D1
    D2
    D1
    D2
    D1
    D2


    A
    10
    10.14
    10.07
    101.40
    100.53
    0.01
    0.25


    B
    12
    11.99
    12.02
    99.86
    100.17
    0.90
    0.34


    C
    14
    13.96
    14.03
    99.71
    100.19
    0.22
    0.02


    D
    16
    15.94
    15.97
    99.63
    99.83
    1.14
    0.14


    E
    18
    17.88
    17.95
    99.33
    99.70
    0.14
    0.26
Table 8: Recovery test for PAR in tablets.
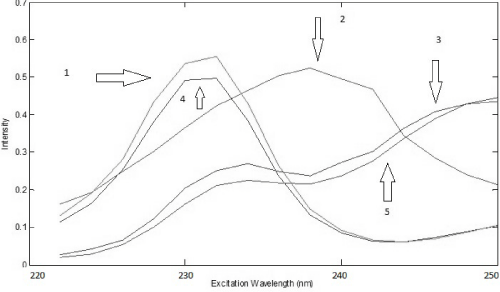
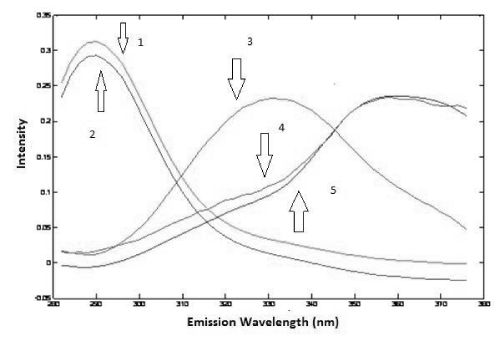
The analysis of the urine samples was carried out after performing the analysis of the drug samples. Preliminary test was done to verify the adequate factor of dilution of urine and based on this test it was noticed that a dilution of 500 times was satisfactory to obtain good results, so it was chosen to perform all analysis. Considering all samples were spiked with a different amount of standard of PAR and IBU, first of all, it was used PARAFAC to perform deconvolution in spectra in urine samples. Based on the Core Consistency values, it was chosen to work with three components that offered a Core Consistency equals to 84 and the explained variance was 99.80%. With three components, it was possible to identify PAR and IBU spectra and a third spectra probably that belongs an unknown compound present in the urine. This identification was done by overlapping spectra of standards of PAR and IBU (Figure 6 and 7).
Figure 6: Excitation loadings of PARAFAC (4: IBU in urine; 2: some unknown compound in urine; 5: PAR in urine; 1: spectrum overlap of IBU aqueous standard; 3: spectrum overlap of PAR aqueous standard)
Figure 7: Emission loadings of PARAFAC (2: IBU in urine; 3: some unknown compound in urine; 5: PAR in urine; 1: spectrum overlap of IBU aqueous standard; 4: spectrum overlap of PAR aqueous standard).
Scores obtained from PARAFAC were related to the spiked concentration of IBU and PAR in urine. Based on the results (Table 9), it was possible to see once again that is a strong correlation between scores and predicted concentration, what proves that this methodology is satisfactory for the determination of both analytes also in urine samples, what is good considering that urine is a complex matrix.
    Curve Equation
    R2
    R


    IBU
    Y = 0.0698x – 0.0708
    0.9959
    0.9979


    PAR
    Y = 0.186x – 7.8584
    0.9989
    0.9994
Table 9: Results for urine.
It was also possible to determine some figures of merit such as limit of detection and quantification for urine samples (Table 10).
    FOM
    Paracetamol (PAR)
    Ibuprofen (IBU)


    REP (%)
      SEN
      SEL
      LOD (mg.L-1)
    14.3
      0.03
      0.12
      0.83
    12.9
      0.04
      0.16
      0.54


    LOQ (mg.L-1)
    2.48
    1.65
Table 10: Figures of merit (FOM) for the developed methodology for urine samples.
Based on results presented on the previous table it is possible to notice that IBU and PAR showed low values of REP (relative error of prediction) but IBU presented a slightly better value what was expected due the fact that IBU presented the accuracy better than PAR concentration determination. LOD and LOQ are lower for IBU than PAR what was also expected because in preliminary tests the concentration range of PAR was higher than IBU because the intensity of emission of IBU was higher in minor concentrations than IBU. Concentration range for PAR and IBU was adequate, and it can be slightly expanded respecting LOQ values obviously.
Conclusion
However, the reference technique for determination of IBU and PAR is HPLC, the methodology developed that used spectrofluorimetric determination coupled with PLS (for tablets) presented good results compared with other methodologies. For urine samples, spectrofluorimetric determination coupled with PARAFAC also presented satisfactory results. It is worth for considering that the developed method for determination in tablets could be extended for urine samples and only the chemometric technique was changed (PARAFAC instead of PLS) but measurements parameters (such as range of wavelength of excitation and emission, pH and range of concentration) were kept. Considering there are few methodologies that perform simultaneous determination of PAR and IBU, and it was not established figures of merit in most of them, the proposed methodology fulfill this absence and also as it was mentioned before provided excellent results.
For the determination in tablets, analytical curve for PAR presented good values of the correlation coefficient for Sonridor and Tylenol what shows a strong correlation between measured and predicted concentrations as well as for IBU. In both cases, it was avoided the use of HPLC that is the reference technique.
In the determination of both analytes in urine samples by recovery test, good results once again were obtained, and it was possible to quantify PAR and IBU in urine samples with the dilution factor of 500 times. For PAR and IBU the values of the correlation coefficient obtained showed the strong correlation between scores of PARAFAC and spiked concentration of IBU and PAR in urine. Figures of merit showed that methodology developed is effective in its initial purpose. Values of LOD and LOQ for IBU and PAR showed the methodology is satisfactory.
It is also worth to notice that this alternative methodology avoids use of considerable amounts of organic solvents such as methanol and acetonitrile such is used in HPLC what in terms of environmental care is desirable and even for urine that is a complex matrix. The proposed methodology presented satisfactory results also because only was necessary to perform dilution of urine samples, and no other pretreatment was necessary what would be not possible using HPLC.
Acknowledgement
Jéssica S.A. Pinho thanks to FAPERJ for the scholarship and Aderval S. Luna thanks for FAPERJ financial support, and CNPq and Programa Prociência (UERJ) for grants.
References
- Gilpin RK, Pachla LA. Pharmaceuticals and related drugs. Anal Chem. 2005; 77: 3755-3769.
- Braga JW, Poppi RJ. Validation of multivariate calibration models: an application in the determination of polymorphic purity of carbamazepine by NIR spectroscopy. Quím. Nova. 2004; 27: 1004-1111.
- Sena MM, Freitas CB, Silva LC, Pérez CN, Paula YO. Simultaneous spectrometric determination of paracetamol and ibuprofen in pharmaceuticals formulations using multivariate calibration. Quím. Nova. 2007; 30: 75-79.
- Ramos ML, Tyson JF, Curran DJ. Determination of acetaminophen by flow injection with one-line chemical derivatization: investigations using visible and FTIR spectrophotometry. Anal. Chim. Acta. 1998; 364: 107-116.
- Milch G, Szabó E. Derivative spectrophotometric assay of acetaminophen and spectrofluorimetric determination of its main impurity. J Pharm Biomed Anal. 1991; 9: 1107-1113.
- Moreira AB, Oliveira HPM, Atwars TDZ, Dias ILT, Neto GO, Zagatto EAG, et al. Direct determination of paracetamol powdered pharmaceutical samples by fluorescence spectroscopy. Anal. Chim. Acta. 2005; 539: 257-261.
- Ramos Martos N, Aguirre Gomez F, Molina Diaz A, Capitain Vallvey LF. Application of liquid chromatography to the simultaneous determination of acetylsalicylic acid, caffeine, codeine, paracetamol, pyridoxine and thiamine in pharmaceutical preparations. J AOAC Int. 2001; 84: 676-683.
- Hergert LA, Escandar GM. Spectrofluorimetric study of the beta-cyclodextrin-ibuprofen complex and determination of ibuprofen in pharmaceutical preparations and serum. Talanta. 2003; 60: 235-246.
- Elragehy NA, Abdelkawy M, Elbayoumy A. Spectrophotometric determination of Ibuprofen via its Copper (II) complex. Anal Lett. 1994; 27: 2127-2139.
- Gasco-Lopez AI, Izquierdo-Hornillos R, Jimenez A. LC method development for ibuprophen and validation in different pharmaceuticals. J Pharm Biomed Anal. 1999; 21: 143-149.
- Tsao JC, Savage TS. High performance liquid chromatography determination of ibuprofen in bulk drug and tablets. Drug Develop. Ind. Pharm. 1985; 11: 1123-1131.
- Donato MG, Baeyens W, Vandenbossche W, Sandra P. The determination of non-steroidal antiinflammatory drugs in pharmaceuticals by capillary zone electrophoresis and micellar electrokinetic capillary chromatography. J Pharm Biomed. Anal. 1994; 12: 21-26.
- van Staden JK, Tsanwani MM. Determination of paracetamol in pharmaceutical formulations using a sequential injection system. Talanta. 2002; 58: 1095-1101.
- Husain S, Kifayatullah M, Sekhar R. Simultaneous determination of Ibuprofen and Acetominophen in Pharmaceutical preparations by proton magnetic nuclear resonance spectroscopy. J AOAC Int. 1994; 77: 1443-1446.
- Simões SS, Sanches FAC, Araújo MCU, Pasquini C, Junior IMR, Rohwedder JJR. Determination of paracetamol in pharmaceutical tablets using NIR spectroscopy and variable selection algorithm. Proceedings of 29ª Annual Meeting of Brazilian Chemistry Society; 2006 May 19-22.
- Ravn C. Near Infrared chemical imaging in formulation development of solid dosage forms. 2009.
- Luna AS, Pinho JSA, Lima ICA, Março PH, Valderrama P, Boqué R, et al. Determination of Norfloxacin in human urine samples using spectrofluorimetry coupled with PARAFAC. Americ. J. Quantitative Spec. 2014; 1: 1-17.
- Bohoyo DB. New methods of determination of antibiotics and other active substances in food, animal health formulations and biological fluids. 2005.
- Girón AMJ. Applications of analytical methods based on molecular luminescence combination com em dynamic methodologies. 2007.
- Valderrama P, Braga JW, Poppi RJ. Study of art of figures of Merit in multivariate calibration. Quím. Nova. 2009; 32: 1278–1287.
- Saxberg BEH, Kowalski BR. Generalized standard addition method. Anal. Chem. 1979; 51: 1031-1038.
- Booksh KS, Henshaw JM, Burgess LW, Kowalski BR. The Second Order Standard Addition Method with an Application to In Situ Environmental Monitors. J Chemom. 1995; 9: 263–282.
- Luna AS, Silva AP, Costa TM, Aucélio RQ, Braga JW, Boqué R, et al. Spectrofluorimetric determination of levofloxacin in pharmaceuticals andhuman urine. J Life Sc. Pharm. Res. 2012; 2: 147–158.
- Valderrama P. First and Second order multivariate calibration and figures of merit in the quantification of the enantiomers by spectroscopy. 2009.
- Silva LC, Trevisan MG, Poppi RJ, Sena MM. Direct determination of propranolol in urine by spectrofluorimetry with the aid of second order advantage. Anal Chim Acta. 2007; 595: 282-288.
- Bernardes CD, Poppi RJ, Sena MM. Direct determination of trans-resveratrol in human plasma by spectrofluorimetry and second-order standard addition. Talanta. 2010; 82: 640-645.
