Research Article
Austin J Anal Pharm Chem. 2014;1(2): 1007.
Preparation and Characterization of Inclusion Complexes of N-Substituted-benzenesulfonyl Heterocycles with Cyclodextrins
Nieto MJ1*, Li C1,2, McPherson T1, Kolling WM1 and Navarre EC3
1Department of Pharmaceutical Sciences, Southern Illinois University Edwardsville, USA
2College of Materials and Chemistry & Chemical Engineering, Chengdu University of Technology, China
3Department of Chemistry, Southern Illinois University Edwardsville, USA
*Corresponding author: :Nieto MJ, Department of Pharmaceutical Sciences, Southern Illinois University Edwardsville, 200 University Park Drive, Suite 220, Edwardsville, IL, 62026, USA.
Received: July 08, 2014; Accepted: July 16, 2014; Published: July 17, 2014
Abstract
As part of our ongoing drug discovery program we have prepared a library of N-substituted-benzenesulfonyl hetero cycles. Both the heterocyclic and the benzenesulfonyl moiety are considered privileged structures. The insolubility of these compounds has hampered the study of their biological properties. We have prepared and studied the inclusion complexes of representative N-benzenesulfonyl hetero cycles with α-, β-, and γ-cyclodextrins. The complexes have been characterized by spectroscopic (1H-NMR, IR, UV and Raman) and chromatographic methods (HPLC/MS), as well as phase solubility techniques. Molecular modeling techniques have been correlated with the experimental results in order to have a predictive tool to include in the development of novel compounds. The results show that the benzenesulfonyl moiety interacts with the hydrophobic pocket of the cyclodextrin molecule. The phase-solubility diagrams show that complexation with cyclodextrins, in particular β-cyclodextrin can significantly increase the apparent aqueous solubility of the N-benzenesulfonyl heterocycles.
Keywords: Cyclodextrins; Inclusion complexes; Spectroscopy; Phase Solubility Diagrams; Benzenesulfonyl heterocycles
Introduction
As part of our ongoing drug discovery program we have prepared a library of N-benzenesulfonyl derivatives of indoline and 2-methyl indoline (BSH) [1]. From this library we have identified two compounds with moderate antimicrobial activity. The low water solubility of these compounds has hampered the study of their biological properties and the development of SAR/QSAR models that would help in the design of more active antimicrobial compounds. Therefore, it was necessary to enhance the water solubility of these antimicrobial compounds. The goal of the present study was to prepare and characterize cyclodextrin complexes of N-benzenesulfonyl derivatives of indolines (BSHs).
Among the several possible approaches to improve the solubility of drugs, complexation with cyclodextrins is one of the most successful [2,3]. Cyclodextrins (CD) are cyclic oligosaccharides of glucose with a cone-like structure. They consist of (α-1,4)-linked α-D-glucopyranose unit with a lipophilic central cavity and a hydrophilic exterior surface. The naturally occurring cyclodextrins areα, β, and γ types containing 6, 7, or 8 glucopyranose units, respectively. In aqueous solutions, CDs are able to form inclusion complexes with many ligands by taking up the lipophilic portion of the molecule into the central cavity [4]. These oligosaccharides have been used not only to increase aqueous solubility but they have proven to be useful in increasing stability and bioavailability of drugs [5].
In this work we have studied the formation of complexes of CDs with N-benzenesulfonyl derivatives of in do line and 2-methylindoline by phase-solubility diagrams, NMR (1D and 2D), DSC, X-ray diffraction, Raman and IR spectroscopy and molecular modeling techniques.
Materials and Methods
The series of substituted-benzenesulfonyl derivatives of indoline and 2-methylindoline (BSH) were previously prepared and characterized [1]. α-, β-, and γ-CDs (Cavamax W6, W7, and W8, respectively) were generously donated by ISP Technologies, 99.99% deuterium oxide was purchased from Across Organics. All water used in the present studies was distilled and deionized using a Milli-Q Synthesis A10 system (Millipore, Billerica, MA, USA). Methanol was HPLC grade and purchased from Fisher Scientific.
Preparation of inclusion complexes
Inclusion complexes were prepared by dispersing 3mL of β-CD (0.1mol) in water into 3ml of BSH (0.1mmol) in acetone. The mixtures were sonicated for 1 hour at room temperature and stirred overnight. The samples were filtered and the resulting aqueous solution was frozen and lyophilized.
Phase solubility studies
The phase solubility diagrams (PSD) were constructed according to the method proposed by Higuchi and Connors [6]. A series of α-, β-, and γ-CDs solutions were prepared with increasing concentrations. Three concentrations of α-CD were prepared (5, 10 and 15mM), and five concentrations of β-CD (1, 2, 3, 4, and 5mM), and γ-CD (2, 4, 6, 8, 10mM) were prepared. A constant mass of each compound was added to 4mL of each CD solution and was analyzed in triplicates. Samples were sonicated for one hour at 30-50°C followed by overnightmechanical stirring. After this period all suspensions were allowed to stand for at least one hour and then filtered through 0.2μM nylon membranes (Fisher Scientific). This method resulted in reproducible equilibrium concentrations. The supernatants were analyzed by HPLC and quantitated from the ligand peak area (absorbance at 254 nm). The intrinsic water solubility of each compound was determined by HPLC after saturating 4mL of de-ionized water and stirring overnight. The intrinsic solubility was also calculated from the PSD (Table 2). HPLC spectra were recorded on a Shimadzu LC20AT equipped with a SPD M20A diode array detector, and a SIL-20A auto sampler. The column used for the HPLC analysis was a Waters X Bridge column (RP18, 3.5μ, 4.6 x 50mm) and it was eluted at 1 ml/ min with methanol/water (60:40).
Solubility test
A visual observation of the solubility of the inclusion complexes of BSHs and CD was performed. Samples of complexes, BSH, CD, and a physical mixture were prepared in a 1-wt% in distilled water in transparent test tubes.
NMR analysis
1D and 2D-NMR experiments were carried out in order to characterize the complexes. 1H and 13C NMR were first recorded. The complexation induced chemical shift (CIS) was measured for each proton of the CD moiety in each complex. 2D experiments such as COSY, ROESY and HSQC were performed to further characterize the complexes. Acetone was added as a reference for 13C-NMR. NMR experiments were performed on a JEOL ECS 400MHz spectrometer, at 400.16(H1) and 100.62(C13). Chemical shift values are reported in ppm (δ) and were taken with D2O as a solvent (referred to residual D2O at 4.75 ppm for 1H).
UV spectroscopy
The stability constant of the complex of β-CD with 6b was determined from UV spectra using the method of Rose and Drago [7,8]. Aqueous solutions of 2.50 × 10⁻⁵ M of 6b in the presence of β-CD (from 0.00 to 1.80 × 10⁻⁴ M) were prepared. Spectra were recorded using 1-cm quartz cuvettes with a Cary 50 Bio (Varian). The wavelength range from 255 to 278 nm, which represents 24 unique wavelengths, was used for the determination.
Raman Spectra
Raman spectra were recorded with an excitation wavelength of 785 nm using a Senterra Raman microscope (Bruker). The microscope was used in backscattering mode with a 20× objective lens and a resolution of 3-5 cm-1. Additional Raman spectra were recorded with an excitation wavelength of 1064 nm using a Multi Ram spectrometer (Bruker). The spectra were recorded in backscattering mode with a defocused excitation beam and a resolution of 1 cm-1. All samples were analyzed as compressed powders.
Differential scanning calorimetry (DSC)
Thermal analysis was performed on a TA Instruments (New Castle DE) Q100 differential scanning calorimeter calibrated using the recommended indium melting procedure. Samples were accurately weighed on a microbalance before analysis. All analyses were conducted in T-zero® (TA Instruments) aluminum sample pans under dry nitrogen flow at 50 ml/min. The heating rate for all experiments was 10°C/min. The cooling rate during heat-cool-heat experiments was 5°C/min. Data were analyzed using TA Universal Analysis software.
Molecular modeling
SYBYL-X 2.0 was employed in all modeling calculations [9]. The objective was to determine if computational techniques could provide insight regarding the geometry and strength of interaction between b-CD and the BSH library. Specifically, we were interested in exploring the enthalpic contribution responsible for the interactions between b-CD and the BSH library. The entropy was estimated by calculating the integer number of water molecules that would be displaced from both the solvated b-CD molecule and the particular solvated BSH in the optimized interaction geometry.
All BSH molecules were verified for atom and bond assignments, followed by Tripos force field optimization employing Gasteiger- Hückel charges. The dielectric function was set to distance, and the terminal gradient was set to 0.01kcal/mol-Å. The Protein Data Bank was accessed and the b-CD molecule was extracted from the complex with beta-amylase (accession code 1BFN). The molecule was imported into SYBYL and the structure was optimized using the same routines as described above for BSH. The strength of interaction between water and b-CD or BSH was calculated using two routines for the energy calculations: i) the pre-computed box routine where the water was restricted to a monolayer, and ii) the XFIT routine in which small numbers of water molecules were added to specific sites on either b-CD or BSH. The sites were chosen based on the specific areas of interaction that would be involved when b-CD complexed with BSH. The water molecule displacement energies for b-CD:H20 and BSH:H2O were assumed to be equivalent to the opposite sign of the energies of interaction between the same number of water molecules at the specific interaction site [10].
The calculation of the interaction energies between b-CD and BSH was carried out using the Surflex-Dock routine in SYBYL. The calculated energy in the absence of water is summarized by:
The calculated energy in the presence of water can be summarized by:
where x and y are the integer number of water molecules displaced from b-CD and BSH, respectively.
Results and Discussion
Phase solubility diagrams
The corresponding affinity constants, intrinsic solubility and maximum solubility values were calculated from the PSD (Table 2). Compounds 11a,b and 12a,b did not form inclusion complexes. This might be due to the size of the BS moiety, the portion of the molecule that might be included in the hydrophobic cavity. All of the complexes showed AL type solubility diagrams, which indicates the formation of a soluble inclusion complex [6]. These results suggest a 1:1 stoichiometry for the complex. β-CD formed stable complexes with most of the compounds of this series. α-CD complexes exhibited the lowest stability constant as well as the lowest complexation efficiency. g-CD formed complexes with those compounds that have larger substituent’s in the BS moiety, but, as expected, results were erratic. For example g-CD formed a complex with compound 5b but not 5a (Table 2). Similar results were observed with compounds 7a,b, 13a,b and 15a,b.
Stability Constant
The apparent stability constant was calculated by fitting the data to the equation for a 1:1 complex:
where slope is the value of found in the linear regression and S0 is the intrinsic solubility of the free drug. Table 1 summarizes the K1:1 values for each complex and the experimentally determined S0 was used to calculate K1:1. As previously stated the β-CD complexes are the ones with the highest K1:1, while the -CD complexes are the weakest ones.
    Compound
    αCD complexes
    βCD complexes
    γ CD complexes


    R
    #
    K1:1 mM-1
    CE (%, x10-2)
    EF
    K1:1 mM-1
    CE (%)
    EF
    K1:1 mM-1
    CE (%)
    EF


    H
    1a
    0.029
    0.147
    0.17
    5.2159
    0.212
    1.72
    -
    -
    -


    1b
    0.016
    0.017
    0.10
    4.2032
    0.445
    1.58
    -
    -
    -


    4-NO2
    2a
    0.103
    0.139
    2.09
    25.495
    0.030
    12.75
    1.094
    0.015
    11.015


    2b
    0.060
    0.009
    0.20
    2.9579
    0.039
    1.49
    1.919
    0.028
    1.99


    3-NO2
    3a
    0.019
    0.051
    0.14
    0.7271
    0.015
    0.44
    -
    -
    -


    3b
    0.048
    0.009
    0.17
    0.9461
    0.015
    0.59
    -
    -
    -


    2-NO2
    4a
    0.170
    0.219
    0.36
    13.093
    0.137
    5.22
    -
    -
    -


    4b
    0.052
    0.006
    0.20
    12.441
    0.099
    5.40
    0.956
    0.019
    1.10


    4-CH3
    5a
    0.214
    0.445
    0.29
    18.270
    0.349
    6.83
    -
    -
    -


    5b
    0.072
    0.006
    0.17
    9.9044
    0.793
    3.89
    0.463
    0.036
    0.45


    4-NHAc
    6a
    0.018
    0.051
    0.18
    66.900
    1.338
    34.34
    8.032
    0.228
    11.90


    6b
    2.303
    0.001
    0.23
    29.268
    3.599
    15.65
    24.400
    0.160
    6.87


    4-NH2
    7a
    0.223
    2.768
    0.29
    19.117
    1.976
    2.35
    5.283
    0.657
    2.27


    7b
    0.167
    0.019
    0.28
    24.439
    2.300
    7.91
    -
    -
    2.25


    4-Cl
    8a
    20.93
    0.136
    0.00
    0.0788
    0.194
    0.03
    0.934
    0.009
    -


    8b
    0.000
    0.001
    0.08
    60.800
    0.209
    26.57
    5.440
    0.021
    -


    4-F
    9a
    0.035
    0.26
    0.14
    3.4392
    0.141
    1.41
    -
    -
    0.52


    9b
    0.051
    0.009
    0.15
    3.0075
    0.521
    1.25
    -
    -
    0.19


    4-CF3
    10a
    0.040
    0.103
    0.28
    4.2546
    0.257
    3.27
    1.742
    0.044
    2.12


    10b
    0.111
    0.130
    0.34
    15.228
    0.159
    8.27
    6.896
    0.081
    8.33


    3-CF3
    13a
    0.191
    0.034
    0.23
    11.053
    0.034
    5.70
    -
    -
    -


    13b
    0.109
    0.001
    0.29
    4.6036
    0.045
    2.66
    1.057
    0.002
    1.30


    4-Br
    14a
    0.973
    0.273
    1.88
    3.2026
    0.087
    18.86
    7.742
    0.022
    8.52


    14b
    1.041
    0.003
    2.28
    76.992
    0.186
    44.48
    23.850
    0.068
    19.61


    4-OCH3
    15a
    9.781
    47.62
    0.24
    11.025
    0.476
    4.38
    3.618
    0.176
    1.36


    15b
    0.132
    0.012
    0.26
    9.4329
    0.799
    4.05
    -
    -
    -


    4-COCH3
    16a
    0.084
    0.199
    0.20
    6.3334
    0.136
    2.93
    2.721
    0.064
    2.74


    16b
    0.068
    0.006
    0.21
    5.1382
    0.458
    2.66
    3.301
    0.296
    2.68
Table 1: Stability constant (K1:1), Complexation efficiency (CE) and Enhancement factor (EF) of the complexes of a, b, and g-CD with BSHs.
Determination of the complexation efficiency (CE) [11].
The CE was calculated using the following equation and the results from HPLC analysis (Table 1):
Where [D/CD] is the concentration of dissolved complex, [CD] the concentration of dissolved cyclodextrins and Slope is the slope of the phase solubility diagram (PSD).
Enhancement factor (EF)
The enhancement factor, calculated as the solubility in cyclodextrins solution divided by the solubility in pure water is summarized in Table 1.
Intrinsic solubility. According to the equation:
it is expected that the intrinsic solubility be equal to the intercept. This is in fact true for compounds with intrinsic solubility greater than 1mM but an strong negative deviation has been observed for molecules with intrinsic solubilities below 0.1mM (Table 2) [12]. This phenomenon had been attributed to the non-ideality of water as a solvent [12].
      #
    bCD
    gCD
    S0b


    SIa
    Slope
    R2
    SIa
    Slope
    R2


    1a
    0.0223
    0.0221
    0.973
    NC
    NC
    NC
    0.004328


    1b
    0.0298
    0.0552
    0.966
    NC
    NC
    NC
    0.0139


    2a
    0.0009
    0.0034
    0.994
    0.0044
    0.0012
    0.955
    0.000133


    2b
    -0.0002
    0.0043
    0.978
    0.0025
    0.0027
    0.998
    0.0015


    3a
    0.0021
    0.0018
    0.966
    NCc
    NC
    NC
    0.00248


    3b
    0.0010
    0.0017
    0.959
    NC
    NC
    NC
    0.0018


    4a
    -0.0100
    0.0018
    0.970
    NC
    NC
    NC
    0.0014


    4b
    -0.0125
    0.0135
    0.977
    NC
    NC
    NC
    0.0011


    5a
    -0.0038
    0.0485
    0.974
    NC
    NC
    NC
    0.00279


    5b
    0.0446
    0.0860
    0.949
    NC
    NC
    NC
    0.0095


    6a
    0.0144
    0.1154
    0.999
    -0.0002
    0.0154
    0.981
    0.00195


    6b
    0.1400
    0.2299
    0.992
    0.2309
    0.0943
    0.929
    0.0102


    7a
    0.0760
    0.2409
    0.983
    0.1019
    0.0741
    0.966
    0.0166


    7b
    0.0839
    0.2522
    0.993
    NC
    NC
    NC
    0.0138


    8a
    0.0027
    0.0236
    0.995
    3.0981
    0.1943
    0.982
    0.31133


    8b
    -0.0096
    0.0249
    0.995
    0.0119
    0.0007
    0.992
    0.0004


    9a
    0.0104
    0.0182
    0.953
    NC
    NC
    NC
    0.00539


    9b
    0.0223
    0.0610
    0.988
    NC
    NC
    NC
    0.0216


    10a
    -0.0019
    0.0037
    0.942
    NC
    NC
    NC
    0.000336


    10b
    -0.0011
    0.0044
    0.988
    NC
    NC
    NC
    0.0010


    11a
    -
    -
    -
    -0.0012
    0.0010
    0.929
    0.0000


    11b
    -
    -
    -
    -0.0009
    0.0022
    0.989
    0.0000


    12a
    0.0148
    0.0126
    0.928
    0.0002
    0.0000
    0.997
    0.0000


    12b
    -
    -
    -
    NC
    NC
    NC
    0.0000


    13a
    0.0014
    0.0076
    0.996
    -0.0026
    0.0045
    0.952
    0.0018


    13b
    -0.0041
    0.0150
    0.995
    -0.0002
    0.0071
    0.999
    0.0010


    14a
    -0.0026
    0.0008
    0.975
    0.0005
    0.0019
    0.995
    0.00025


    14b
    -0.0086
    0.0174
    0.983
    0.0027
    0.0051
    0.987
    0.0002


    15a
    -0.0068
    0.0601
    0.974
    0.0298
    0.0175
    0.951
    0.0058


    15b
    0.0091
    0.0909
    0.984
    NC
    NC
    NC
    0.0106


    16a
    -0.0019
    0.0162
    0.983
    0.0037
    0.0045
    0.930
    0.0026


    16b
    0.0154
    0.0442
    0.993
    0.0716
    0.0183
    0.958
    0.0090
Table 2: PSD parameters and Intrinsic Solubility (S0) of the complexes of b and g-CD with BSHs.
Characterization of b-CD complexes
To test the water solubility and confirm the formation of inclusion complexes we compared the solubility of the β-CD, the free guest molecule, the physical mixture, and the β-CD complexes. The physical mixture and the guest molecules were insoluble, but the β-CD and the complexes of b-CD and BSHs dissolved in water suggesting the formation of inclusion complexes.
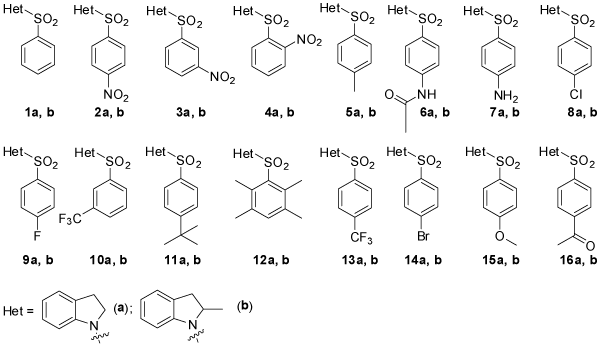
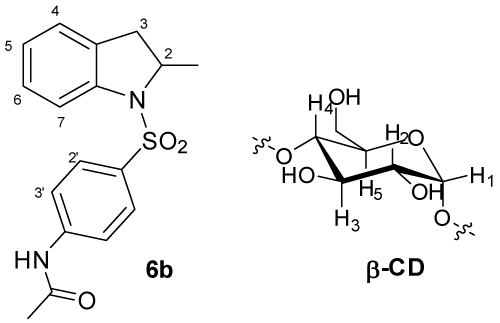
Figure 1: Structures of the BSH library.
Complexation was also analyzed using 1H-NMR technique. The 1H-NMR is a common technique for the analysis of macromolecules. The disadvantage of this technique for the characterization of complexes with low efficiency is that because of the solvent and large signals for the CD, the protons from the guest molecule are not visible. Despite the low efficiency complexation it was possible to observe ligand-induced changes in the CD spectra. (Table 3) summarizes the results obtained from the 1H-NMR of the complete series for β-CD complexes. Most of the complexes had a negative chemically induced shift (CIS), which represents an up field change compared to the free β-CD. This change can be interpreted as the β-CD having an aromatic group in the cavity [13-15]. Few of the complexes had downfield CIS in the interior cavity proton signals. This can be due to the nature of the functional groups attached to the BS moiety, how deep in the cavity the BS moiety is, or that the guest molecule is included through the side of the hetero cycle that is opposite of the BS moiety. Many of the analogs (1, 7, 8, 9, 13, 14, and 15) from series a and b have opposite effects on the signals of the protons in the interior cavity. This might be due to the steric hindrance by the methyl group in series b impairing in the complex formation, and therefore affecting the distance between the protons of the cavity and the functional groups of the guest molecule. This steric hindrance may also affect the relative conformations of the ligand and β-CD in the complex. Overall these results confirm the formation of inclusion complexes.
    ΔH3=H3Comp-H3CD
    ΔH5=H5Comp-H5CD


    H
    1a
    -0.0042
    -0.0069


    1b
    0.0027
    -0.0011


    4-NO2
    2a
    -0.0004
    -0.0057


    2b
    -0.0038
    -0.0069


    3-NO2
    3a
    0.0019
    0.0023


    3b
    0.0004
    0.0000


    2-NO2
    4a
    -0.0026
    -0.0057


    4b
    -0.0027
    -0.0114


    4-CH3
    5a
    0.0225
    -0.0138


    5b
    0.0036
    -0.0057


    4-NHAc
    6a
    -0.0114
    -0.0263


    6b
    -0.0074
    0.0095


    4-NH2
    7a
    -0.0088
    -0.0183


    7b
    0.0000
    -0.0195


    4-Cl
    8a
    -0.0011
    -0.0057


    8b
    0.0004
    0.000


    4-F
    9a
    -0.0050
    -0.0080


    9b
    0.0019
    -0.0069


    3-CF3
    10a
    0.0008
    0.0000


    10b
    -0.0003
    -0.0046


    4-CF3
    13a
    0.0000
    -0.0057


    13b
    0.0050
    0.0046


    4-Br
    14a
    -0.0057
    -0.0126


    14b
    0.0084
    0.0046


    4-OCH3
    15a
    -0.0084
    -0.0195


    15b
    0.0088
    -0.0046


    4-COCH3
    16a
    0.0031
    0.0011


    16b
    0.0034
    -0.0012
Table 3: CIS of H-3 and H-5 and the changes when compared with the un substituted guest molecule.
Based on the results we have selected the complex of β-CD with 6b, due to its combinations of higher K1:1 and best complexation efficiency. Many of the experiments done up to this point have pointed to the formation of inclusion complexes and that the BS moiety might be the part of the molecule inserted in the hydrophobic cavity. The following experiments aimed to determine which part of the guest molecule is included in the cavity.
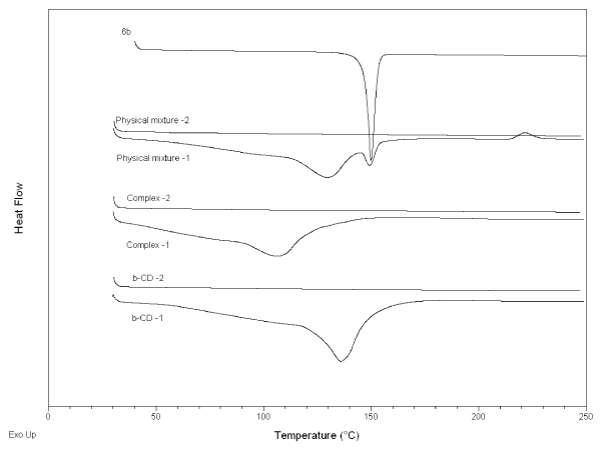
DSC. 6b was analyzed by a single heating procedure. It showed a sharp melting peak at 150°C and no other thermal events up to 250°C (Figure 2). All other samples were analyzed using the heat-cool-heat procedure. On first heating, β-CD showed the typical broad endotherm with peak at 135°C. This peak is ascribed to loss of adsorbed water from the powder [16-19]. β-CD showed no other thermal events on first heating, nor during the cooling phase (not shown). On second heating, β-CD again showed no thermal events.
Figure 2: DSC Thermograms of pure 6b, physical mixtures, CD and complexes.
A physical mixture prepared by weighing 6b and β-CD into the same sample pan showed three thermal events on first heating. First was the endotherm associated with β-CD, with peak at 145°C, followed by an endotherm at 150°C consistent with 6b melting? Upon further heating an exothermic peak at 220°C was detected. The mixture showed no thermal events on cooling or on the second heating phase. The complex showed a single endotherm at 110°C on first heating but no other event. The data suggest that no crystalline 6b was present in the complex, i.e. it was all complexed with β-CD. Complex formation is further indicated by the exotherm in the first heating of the physical mixture, followed by no events on the second heating. Lack of events on cooling the physical mixture indicates that 6b did not re-crystallize.
UV
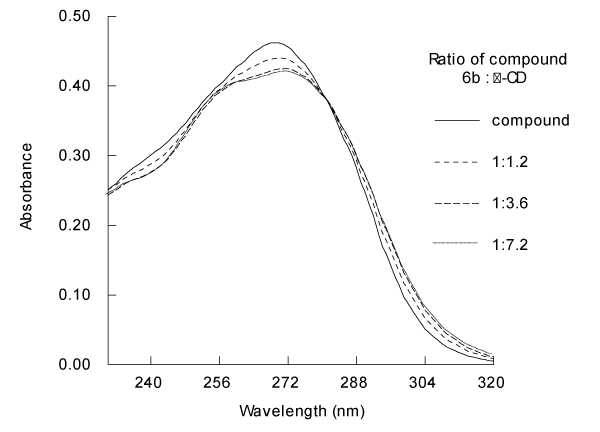
Aqueous 6b exhibits a single broad absorbance band in the UV spectrum with λmax at 269 nm. Addition of β-CD induces obvious changes in the UV spectrum (Figure 3). As the concentration of β-CD is increased from 30 to 180 μM (i.e. 0.5 to 3 times the 6b concentration), the absorbance band becomes attenuated and flatter in the range of 255-280 nm, and λmax increases to 272 nm. β-CD also induces a sharper decrease in absorbance from 255 to 240 nm. The spectra for 30, 60, 90, and 120μM β-CD show gradual transitions from the pure 6b spectrum to the spectrum for the mixture containing 180μM. higher concentrations of β-CD do not induce further changes in the absorbance spectrum (data not shown). The UV absorbance spectrum clearly indicates presence of a complex in solution.
Figure 3: Absorbance spectra of aqueous solutions of 2.50 × 10⁻⁵ M of compound 6b and its β-CD complexes at several β-CD concentrations.
Stability constant of 6b
The average stability constant determined from UV spectra, according to the method of Rose and Drago [7], for the complexation was 29.00 ± 2.00mM and is in agreement with the K1:1 obtained from PSD (Table 1).
NMR
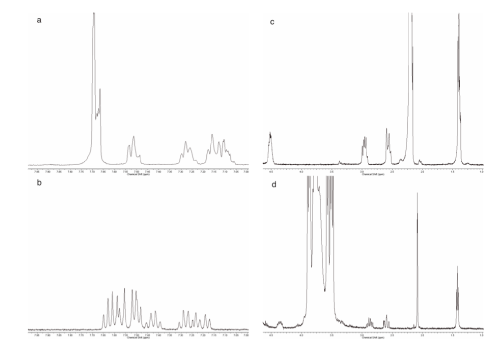
The formation of inclusion complexes can be inferred from the changes in the 1H NMR of the guest molecule or the host molecule. (Figure 4) shows the spectrum for the free 6b and the complex of 6b with β-CD. The 1H NMR spectrum for 6b in D2O showed broad signals for most of the H. The aromatic signals are multiplets between 7 and 8ppm with a clear separation of the aromatic protons from each ring. The protons of the BS moiety are a broad multiplet at 7.7ppm (4H) while the aromatic protons from the indoline moiety are a broad triplet at 7.55ppm (1H), a broad triplet at 7.31ppm (1H) and a multiplet at 7.14ppm (2H). The aliphatic region shows a broad multiplet at 4.54ppm (1H) corresponding to H2, two broad multiplets at 2.99ppm (1H) and 2.58ppm (1H) corresponding to H3a and H3b, respectively. Finally the methyl from the acetyl group appears as a broad signal at 2.21 and the methyl at position 2 as a broad multiplet at 1.43ppm (Figure 4) [1].
Figure 4: 1H-NMR spectra of (a) aromatic region of 6b; (b) aromatic region of the complex of β-CD and 6b; (c) aliphatic region of 6b; (d) aliphatic region of the complex of Β-CD and 6b.
The most obvious changes are on the aromatic signals of the BS moiety suggesting that this portion of the molecule may be inside the β-CD cavity. When comparing the spectra of 6b alone with 6b-b- CD in D2O it is important to note that only the chemical shift of 6b changed. There are changes up field and down field that suggest that there are regions that are close to the O or the H of the CD, respectively (Table 4). In particular H2’ and 3’ have moved up field, suggesting that they are included in the cavity. On the other hand proton 4, 5, and 6 have moved downfield which is indicative of the proximity to an O of the CD. The changes on the β-CD spectrum (Table 4) are not as marked as the ones of the guest molecule. The slight up field shift of the interior proton H3 of the CD is indicative of an aromatic guest molecule located in the interior of the cavity. This displacement is due to the anisotropic magnetic effect induced by the presence of the aromatic group of the guest molecule. On the other hand, H5 shows a downfield shift, which in the complex became a broad singlet overlapped with the signal for H6, attributed to the proximity of the acetamido group of 6b.
Table 4: 1HNMR chemical shift, δ (ppm), of 6b, b-CD and the complex b-CD in water D2O.
    6b
    6b in the presence of b-CD

    b-CD
    b-CD in the    presence of 6b


    2
    4.52(m)
    4.35(m)
    1
    4.99(d)
    4.98(d)


    3a
    2.95(m)
    2.87(m)
    2
    3.56
    3.57(dd)


    3b
    2.55(m)
    2.58(m)
    3
    3.88
    3.87(t)


    4
    7.16(d)
    7.25(dd)
    4
    3.50
    3.50(t)


    5
    7.10(t)
    7.21
    5
    3.77
    3.73-3.80


    6
    7.27(t)
    7.42
    6
    3.80
    3.78(br. s)


    7
    7.52(d)
    7.55


    2’
    7.68(d)
    7.64(dd)


    3’
    7.66(d)
    7.57(d)


    2-CH3
    1.40(d)
    1.40(d)


    COCH3
    2.12
    2.06(s)
Table 4: 1HNMR chemical shift, δ (ppm), of 6b, b-CD and the complex b-CD in water D2O.
Raman spectra
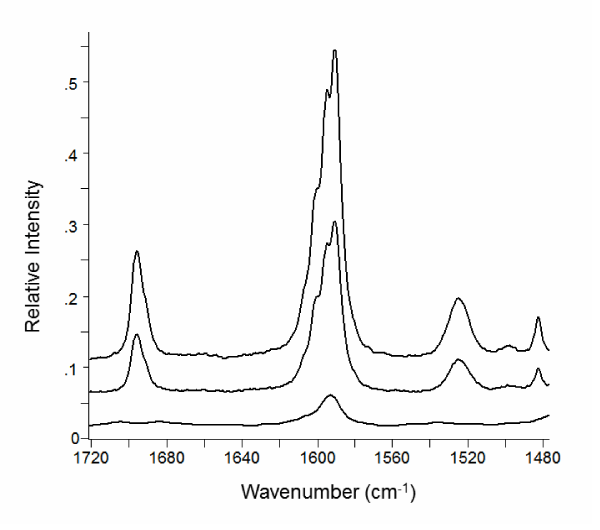
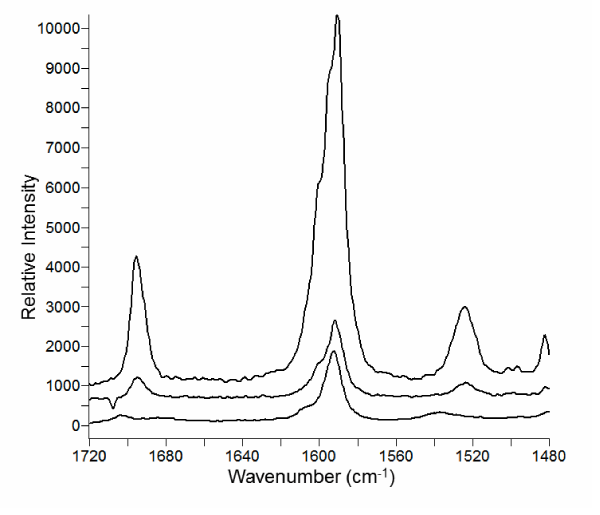
The region from about 1700 to 1500 cm-1 in the Raman spectra of compound 6b and its complexes are shown in (Figures 5, 6). This spectral region has little contribution from the β-CD and contains vibrational bands of aromatic, carbonyl, and amine bonds.
The aromatic C=C stretching [20] (νCC) centered around 1595 cm-1 undergoes a dramatic change in intensity in the 6b-β-CD complex compared to the pure compound. The spectrum of the pure compound and physical mixture of β-CD show a relatively intense feature with three shoulders toward higher wave number. The fine structure is better represented in the FT-Raman spectra (Figure 5). The aromatic band from the β-CD complex is much less intense and loses the fine structure. This change suggests interaction of the aromatic portion of 6b with β-CD in the complex and is consistent with NMR results.
Figure 5: Raman spectra recorded with the FT-Raman instrument of (a) compound 6b; (b) physical mixture of β-CD and 6b; (c) complex of 6b and β-CD. The spectra have been shifted vertically for clarity.
Similarly, the vibrational band at 1700 cm-1 assigned to the amide carbonyl stretch [21], is much less intense in the complex compared to the pure compound or physical mixture. Comparing the pure and complexed forms, νCO shifts from 1695 to 1703 cm-1. The small frequency shift of the carbonyl stretch is indicative of some involvement in the complexation. The shift to higher energy is consistent with insertion of the carbonyl into the hydrophobic β-CD interior and a shortening of the C=O bond.
The N-H bending vibration [21] (νNH) appears at 1524 cm-1. The position is equivalent in the pure compound and physical mixture spectra. In the complex νNH shifts to 1537 cm-1 and is lower intensity. The vibration is more apparent in the dispersive Raman spectrum (Figure 6). Like the carbonyl, a blue-shift in νNH is consistent with insertion into the β-CD interior.
Figure 6: Raman spectra recorded with the dispersive-Raman instrument of (a) compound 6b; (b) physical mixture of β-CD and 6b; (c) complex of 6b and β-CD. The spectra have been shifted vertically for clarity.
Molecular modeling
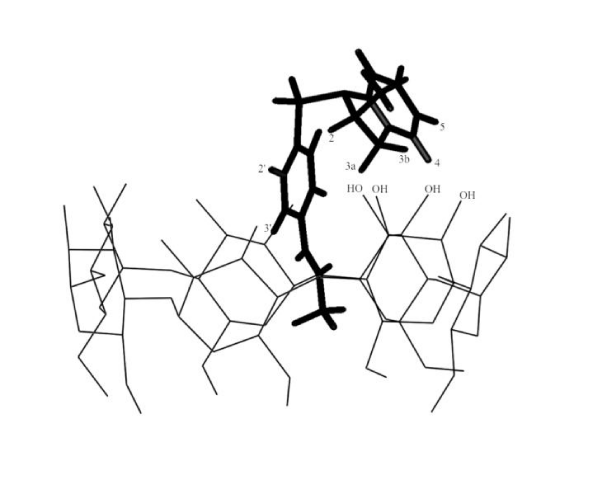
Molecular modeling studies were carried out in order to correlate all of the findings regarding the structure of the complex described above. The conformation analysis of 6b revealed that the preferred conformation is where the molecule is folded around the SO2 group, with the two aromatic groups, the BS and the indoline, on the same side of the molecule. The 3D-structure is in agreement with previous results published by other authors with sulfonamide-like structures [22, 23] and the conformation was always the same regardless of the initial configurations arbitrarily imposed. (Figure 7) depicts the minimum energy complex for 6b/b-CD. The results show the BS moiety inserted in the CD cavity with the folded 2-methyl-indoline heterocycle lying on the rim of the CD and the O of the SO2 group pointing away from the CD.
Figure 7: 3-D Structure of 6b-b-CD complex.
The docking calculations are in agreement with the results obtained from NMR (Table 4 and Figure 4) and Raman (Figures 5,6) spectra and can be summarized as follows: i) the signals for protons 2’, 3’ and the methyl group of the acetamide at position 4’ are affected by an up field shift that confirms the inclusion of the BS moiety into the CD cavity; ii) protons 4, 5, on the aromatic ring of the indoline show a downfield displacement indicating their position close to an O of the CD, specifically the OH1 which is located at the rim of the CD cavity (Figure 7); iii) the shift of the C=O to higher energy in the Raman spectra is consistent with insertion of the carbonyl into the hydrophobic β-CD interior and a shortening of the C=O bond (Figures 5,6); iv) the CIS observed for H3 and H5 of the b-CD in the complex are in agreement with the model proposed by molecular modeling calculations.
Conclusion
The inclusion complexes of a series of BSH and a, b and g-CD were studied. The phase solubility studies demonstrated the formation of inclusion complexes with most of the analogs of this series. Only compounds with bulky substituent’s in the BS moiety did not form inclusion complexes with a, and b-CD. Overall, the compounds in the series formed stable complexes with b-CD, only compounds with small substituent’s in the BS moiety were able to form stable complexes with a-CD while most of the compounds formed unstable complexes with g-CD. The complex of 6b and b-CD was selected for a more thorough study of the geometry and stability. The 1H-NMR and Raman studies on the complex formed between 6b and b-CD showed that part of the BS moiety is included into the cavity of the CD. These results are in agreement with the molecular modeling studies that showed the BS moiety of 6b included into the hydrophobic cavity of the CD. In addition the 1H-NMR indicated that the indoline heterocycle is also interacting with the CD, the CIS of those protons demonstrate that they are close to the O at position 1 of the CD that is located on the rim of the cavity.
Acknowledgement
This research was supported in part by a SIUE School of Pharmacy Research Grant. The project was also supported in part by the National Science Foundation ARRA-MRI-R grant #0960177, Acquisition of Raman and Infrared Microscopes for Interdisciplinary Research. We also thank Prof. Dr. Mike Crider for his critical review of this paper.
References
- Pagliero RJ, Mercado R, McCracken V, Mazzieri MR, Nieto MJ. Rapid and facile synthesis of N-benzenesulfonyl derivatives of heterocycles and their antimicrobial properties. Lett Drug Des Discovery. 2011; 8: 778-791.
- Kurkov SV, Ukhatskaya EV, Loftsson T. Drug/cyclodextrin: beyond inclusion complexation. J Incl Phenom Macrocycl Chem. 2011; 69: 297-301.
- Kurkov SV, Loftsson T. Cyclodextrins. Int J Pharm (Amsterdam, Neth). 2012.
- Loftsson T, Brewster ME. Pharmaceutical applications of cyclodextrins. Drug solubilization and stabilization. J Pharm Sci. 1996; 85: 1017-1025.
- Rasheed A, Ashok KCK, Sravanthi VVNSS. Cyclodextrins as drug carrier molecule: a review. Sci Pharm. 2008; 76: 567-598.
- Higuchi T, Connors KA. Phase-solubility techniques. Advan Anal Chem Instr. 1965; 4: 117-212.
- Rose NJ, Drago RS. Molecular addition compounds of iodine. I. An absolute method for the spectroscopic determination of equilibrium constants. J Am Chem Soc. 1959; 81: 6138-6141.
- Long JR, Drago RS. The rigorous evaluation of spectro photometric data to obtain an equilibrium constant. J Chem Ed. 1982; 59: 1037-1039.
- International T. SYBYL-X. 2.0 ed: Tripos International 2012.
- Wurster DE, Kolling WM, Knosp BM. Computer modeling of adsorption on an activated charcoal surface. J Pharm Sci. 1994; 83: 1717-1722.
- Loftsson T, Hreinsdottir D, Masson M. The complexation efficiency. J Incl Phenom Macrocycl Chem. 2007; 57: 545-552.
- Loftsson T, Hreinsdóttir D, Másson M. Evaluation of cyclodextrin solubilization of drugs. Int J Pharm. 2005; 302: 18-28.
- Schneider HJ, Hacket F, Rüdiger V, Ikeda H. NMR Studies of Cyclodextrins and Cyclodextrin Complexes. Chem Rev. 1998; 98: 1755-1786.
- Forgo P, Vincze I, Kövér KE. Inclusion complexes of ketosteroids with beta-cyclodextrin. Steroids. 2003; 68: 321-327.
- Salvatierra D, Jaime C, Virgili A, Sanchez-Ferrando F. Determination of the Inclusion Geometry for the ß-Cyclodextrin/Benzoic Acid Complex by NMR and Molecular Modeling. J Org Chem. 1996; 61: 9578-9581.
- Bhargava S, Agrawal GP. Preparation & characterization of solid inclusion complex of cefpodoxime proxetil with beta-cyclodextrin. Curr Drug Deliv. 2008; 5: 1-6.
- Zoppetti G, Puppini N, Pizzutti M, Fini A, Giovani T, Comini S. Water soluble progesterone-hydroxypropyl-ß-cyclodextrin complex for injectable formulations. J Incl Phenom Macrocycl Chem. 2007; 57: 283-288.
- Chowdary KP, Srinivas SV. Influence of hydrophilic polymers on celecoxib complexation with hydroxypropyl beta-cyclodextrin. AAPS PharmSciTech. 2006; 7: 79.
- Al OMM, Zughul MB, Davies JED, Badwan AA. Sildenafil/cyclodextrin complexation: Stability constants, thermodynamics, and guest-host interactions probed by 1H NMR and molecular modeling studies. J Pharm Biomed Anal. 2006; 41: 857-865.
- Ilieva S, Hadjieva B, Galabov B. Ab initio molecular orbital and infrared spectroscopic study of the conformation of secondary amides: derivatives of formanilide, acetanilide and benzylamides. J Mol Struct. 1999; 508: 73-80.
- Abbott NB, Elliott A. Infrared spectrum and dichroism of crystalline acetanilide. Proc Royal Soc London A. 1956; 234: 247-268.
- Nieto MJ, Pierini AB, Singh N, McCurdy CR, Manzo RH, Mazzieri MR. SAR analysis of new dual targeting fluoroquinolones. Implications of the benzenesulfonyl group. Med Chem. 2012; 8: 349-360.
- Ogruc-Ildiz G, Akyuz S, Ozel AE. Experimental, ab initio and density functional theory studies on sulfadiazine. J Mol Struct. 2009; 924-926: 514-522.
