Research Article
Austin J Anal Pharm Chem. 2014;1(3): 1012.
Separation and Determination of Prochlorperazine Maleate and Pyridoxine Hydrochloride in Tablet Formulation by RP-HPLC
Khanage SG*, Mohite PB, Dudhade MR and Deshmukh VK
Department of Pharmaceutical chemistry and PG studies, MES College of Pharmacy, India
*Corresponding author: :Khanage SG, MES College of Pharmacy, Sonai, At post-Sonai, Tq- Newasa, Ahmednagar, Maharashtra, India.
Received: August 01, 2014; Accepted: August 20, 2014; Published: August 23, 2014
Abstract
A reverse phase HPLC method is developed for the simultaneous analysis of Prochlorperazine Maleate (PCM) and Pyridoxine hydrochloride (PDH) in pharmaceutical preparations. HPLC was carried out on a C18 column using methanol: water (40:60 v/v, pH 7) as a mobile phase at 1 mL/min flow rate and the effluent was monitored at 272 nm. The retention time for PCM was found to be 6.28 min and for PDH was found to be 3.48 min. The linearity was obtained in the concentration range of 5-25 μg/ml respectively for PCM and PDH. The method was successfully applied in the analysis of tablet dosage form because no chromatographic interferences from formulation recipients were found. In this study, a HPLC method was successfully applied for the quantitative assay of PCM and PDH in tablets which is simple, rapid, no interferences from formulation recipients and does not require any separation step for each drug. The method was validated as per the ICH guidelines. This method is precise, accurate and easy to analysis PCM and PDH in tablets.
Keywords: HPLC; Accuracy; Precision; ICH guidelines
Introduction
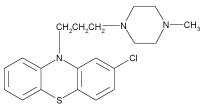
Prochlorperazine Maleate (PCM) is a well known phenothiazine analog, chemically it is [2-chloro-10-(3, 4’-methylpiperazin-1-yl) pylpropyl) phenothiazine; Maleate]. PCM (Figure 1) is widely used for the treatment of nausea, vomiting, migraine, anxiety and sometimes schizophrenia [1]. Pyridoxine hydrochloride (PDH) is chemically, 5-hydroxy-6-methyl-3, 4-pyridinedimethanol hydrochloride [2] (Figure 2). The term B-group vitamins usually refers to Thiamine, Riboflavin, Pyridoxine, Nicotinic acid, Pantothenic acid, Biotin, Cyanocobalamine and Folic acid. Vitamins are reported to reduce the damage by free radicals and prevent degenerative disease [3]. Pyridoxine hydrochloride is known as vitamin B6 and extensively used as nutritional component. Vitamins B6 and B2 are involved in the metabolism of homocysteine, vitamin B6 serves as a cofactor for cystathionine ß-synthase and cystathioninelyase, which convert homocysteine to cystathionine and then to cysteine. Vitamin B6 exists in seven forms: pyridoxine (PN), pyridoxine 5’-phosphate (PNP), pyridoxal (PL), pyridoxal 5’-phosphate (PLP), pyridoxamine (PM), pyridoxamine 5’-phosphate (PMP), and the catabolite, 4-pyridoxic acid. The Pyridoxine form is a water-soluble vitamin. It was discovered in 1934 by P. Gyorgy [4]. The management of vomiting has been always a problem for a physician and the search for a safe and effective alternative is still on. The combination of the PCM (5 mg) and PDH (25 mg) is used for getting relief from vomiting and nausea symptoms and used as an anti-emetic.
Figure 1: Structure of Prochlorpromazine.
Figure 2: Structure of Pyridoxine Hydrochloride.
Both the drugs are official in IP, BP and USP. Various analytical procedures are available for estimation of PCM and PDH in single as well as in combination. Literature survey divulges that HPLC [5-7], GC-MS [8], LC-MS [9,10], UV [11,12], Volta metric [13] methods were described for the estimation of PCM. PDH can be evaluated by Perchloric acid titration [14] and colorimetric method [15]. The literature survey reveals that HPLC [16-20], MLC [21,22] and UV [23-27], methods have been reported for estimation of pyridoxine hydrochloride with other drugs. The UV spectrophotometric method has been developed recently for simultaneous estimation of PCM and PDH in tablet formulation [28].
So an attempt was being made to developed simple, accurate, simultaneous estimation of PCM and PDH in tablet dosage form. The developed method was validated in accordance with ICH guideline [29,30] and successfully employed in the assay of PCM and PDH in combined tablet dosage form.
Material and Methods
Standard and chemical reagents
The standard drug Prochlorperazine Maleate (99.90%) and Pyridoxine Hydrochloride (99.86%) were obtained from Mehata Pharmaceutical Industries, Mumbai, India. Demonized Distilled Water (DIW) was obtained from Loba Chemie Mumbai, India. HPLC grade methanol (99.80%) and acetonitrile (99.80%) were procured from Merck Ltd., India. Tri ethylamine (TEA, 99.14%) and ortho phosphoric acid (OPA, 99.37%) were procured from Fisher scientific, Mumbai. India.
Chromatographic conditions
Liquid chromatography was performed on Younglin (S.K) isocratic System (JASCO Corporation, Japan). The system built with UV 730 D as UV-VIS detector and C18 (Cosmosil) (4.6 × 250 mm, 5μm) column with a 20 μL manual sample injector. The HPLC system was equipped with Autochro -3000 software for data processing.
All compounds were eluted off the column with a mobile phase consisting of methanol: water (40:60 v/v, pH 7) at a flow rate of 1.0 mL/min in isocratic mode. The mobile phase was filtered through a 0.45 μm nylon filter and then ultrasonicated for 30 min. The injection volume was 20 μl and the eluent was detected at 272 nm, which was selected as wavelength for further analysis at ambient temperature. The retention time of PCM and PDH was 6.2833 and 3.4833 min, respectively, and the total run was 10 min.
The method was validated in accordance with the International Conference on Harmonization guidelines for validation of analytical procedures [29,30].
Specificity and selectivity
These parameters were determined by comparing the chromatograms of the PCM and PDH standard, tablet drug Emidoxyn forte and mobile phase as a solvent.
Linearity
The linearity of an analytical procedure is its ability within a given range to obtain test results, which are directly proportional to the concentration (amount) of analyze in the sample [29,30]. The linearity was tested for PCM and PDH in the concentration range value of 5-25 μg/mL.
Recovery studies
To check the degree of accuracy of the method, recovery studies were performed in triplicate by the standard addition method at 50%, 100% and 150%. Known amounts of standard PCM and PDH were added to the pre-analyzed samples and were subjected to the proposed HPLC method.
Precision
The precision of the assay was determined by repeatability (intra-day) and intermediate precision (inter-day). The repeatability was calculated as the relative standard deviation with three replications and three different concentrations during the same day. Intermediate precision was studied by comparing the assays on two different days.
Limit of Detection
The detection limit of an individual analytical procedure is the lowest amount of analyze in a sample which can be detected but not necessarily quantitated as an exact value. Limit of detection can be calculated using the following equation as per ICH guidelines [29,30].
LOD = 3.3 × N/S
n-1
Where, N is the standard deviation of the peak area of the drug, S is the slope of the corresponding calibration curve, X is peak area, X is average of the peak area and n is number of values.
Limit of Quantification
The quantitation limit of an individual analytical procedure is the lowest amount of analyze in a sample which can be quantitatively determined with suitable precision and accuracy. The quantitation limit is a parameter of quantitative assays for low levels of compounds in sample matrices, and is used particularly for the determination of impurities and/or degradation products. Limit of quantification can be calculated using the following equation as per ICH guidelines [29,30].
LOQ = 10× N/S
Where, N is the standard deviation of the peak area of the drug and S is the slope of the corresponding calibration curve.
Robustness
The robustness of analytical method is the measure of its capacity, to remain unaffected by small but deliberate variations in method parameters and provides an indication of its reliability during normal usage. Experiments are performed by changing conditions such as wavelength, flow rate and ratio of mobile phase. The method must be robust enough to withstand slight changes and allow routine analysis of sample.
Analysis of tablet formulation
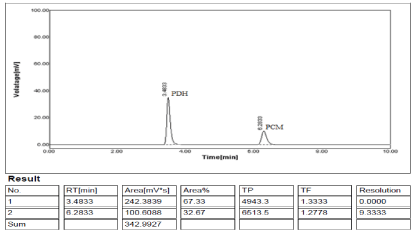
A sample solution was prepared by taking accurately weighed uncoated twenty tablets (Emidoxyn forte) and finely powdered. A precisely weighed portion of the powder equivalent to 0.5 mg of PCM and 2.5 mg of PDH were extracted with the mobile phase. The extract was transferred to a 100 ml volumetric flask and volume made up to the mark with the mobile phase. The solution was filtered through 0.45 μm nylon filter to remove particulate matter, if any. Then sample solution was ultrasonicated for 15 min. The tablet extract was appropriately diluted with mobile phase to obtain at concentrations 5-25 μg/mL. The amount of drug present in the sample solution was calculated by using the calibration curve. The chromatogram was holding up to 10 min. The chromatogram obtained is shown in Figure 3 and the area obtained in each chromatogram of five replicates was correlated with regression equation and the amount of PCM and PDH was found to be 101.20% and 99.40% respectively, which was within the limit of label claim of Emidoxyn Forte tablet.
Figure 3: Chromatogram of tablet formulation.
Results and Discussion
Analytical method development
In order to achieve the good separation and quantification different chromatographic parameters like mobile phase, flow rate, wavelength was optimized individually for PCM and PDH then optimized for in combination. The mobile phase chosen for analytical method validation was methanol: water (40:60 v/v, PH 7), presented a mobile phase holdup time of 6.2833 and 3.4833 min for PCM and PDH respectively giving good separation, and well defined symmetrical peaks with more number of theoretical plates.
The flow rate was optimized with 0.5, 1.0, 1.5 and 2 mL/min. At 0.5 mL/min, there was no peak appeared in the chromatogram with 3 replications. This is attributed to the insufficient flow rate to elute PCM and PDH through the column. However, a significant difference was observed among all the rest flow rates. Based on the results obtained, 1 mL/min showed the best results in terms of peak area and retention time. Detector response for quantification of PCM and PDH was studied and the best wavelength was found to be 272 nm showing highest sensitivity.
Analytical method validation
Linearity
Linearity was established by least square linear regression analysis. Standard solution of the PCM and PDH of different concentration range (5-25 μg/mL) were used for this purpose. Each measurement was carried out in five replicates and the peak areas of the chromatograms were plotted against the concentrations to obtain the calibration curves. Linear regression of absorbance on concentration gave the equation y = 5.139x - 1.293 (for PCM) and y = 12.23x - 6.974 (for PDH) with a correlation coefficient (r2) 0.998 for PCM and 0.996 for PDH. Result of linearity study has been shown in Table 1.
    Linearity (n=5)
    PCM
    PDH


    Range
    5-25μg/mL
    5-25μg/mL


    Mean ‘r2’ value
    0.998
    0.996


    Regression equation
    y = 5.139x - 1.293
    y = 12.23x - 6.974
Table 1: Linearity data for PCM and PDH.
Recovery studies
To check the degree of accuracy of the method, recovery studies were performed in triplicate by the standard addition method at 50%, 100% and 150%. Known amounts of standard PCM and PDH were added to the pre-analyzed samples and were subjected to the proposed HPLC method. The standard addition method was presented good recoveries and agreement with the standards of method validation [29,30] as shown in Table 2.
    Drug
    Amount taken
      (μg/mL)
    Amount added
      (μg/mL)
    Amount found
      (μg/mL)
    Percent recovery
      ± SD*
    RSD%


      PCM
    5.0
    2.5
    7.495
    99.93±0.26
    0.2698


    5.0
    5.0
    9.979
    99.79±0.19
    0.1897


    5.0
    10.0
    15.171
    101.14±0.85
    0.8613


    PDH
    5.0
    2.5
    7.513
    100.17±0.33
    0.3698


    5.0
    5.0
    9.894
    98.94±0.68
    0.6189


    5.0
    10.0
    14.896
    99.30±0.47
    0.4727
Table 2: Results of recovery study by standard addition procedure.
Precision
The precision of the method was evaluated based on the results of the analysis of three samples with three replications for each one at day 1 and the results from intermediate precision from other three samples at day 2. The values were compared with the standards [29,30] thus all values demonstrated good results as shown in Table 3.
    Drug
    Repeatability
    Intermediate Precision


    conc.
      μg/mL
    Rt
      ±SD
    Peak area
      (mV/S) ±SD*
    RSD
      %
    Rt
      ±SD
    Peak area
      (mV/S) ±SD*
    RSD
      %


    PCM
    5
    6.283±0.014
    23.589 ±0.259
    1.006
    6.279±0.145
    23.699 ±0.332
    0.369


    10
    6.280±0.096
    49.781±0.412
    0.799
    6.282±0.698
    49.559±0.673
    0.623


    15
    6.291±0.042
    78.911±0.095
    0.045
    6.281±0.541
    78.542±0.442
    0.856


      PDH
    5
    3.486±0.093
    60.856±0.652
    0.612
    3.483±0.445
    60.845±0.965
    0.824


    10
    3.480±0.454
    107.246±0.712
    0.645
    3.489±0.895
    107.689±0.248
    0.586


    15
    3.489±0.627
    173.23±0.822
    0.944
    3.479±0.364
    173.478±0.723
    0.773
Table 3: Precision of method development on PRG and ACE analysis.
Limits of quantification (LOQ) and detection (LOD)
The LOD and LOQ were calculated according to the ICH guidelines of method validation [29,30]. LOD for PCM and PDH was found to be 0. 0236 μg/ml and 0.0856 μg/ml respectively. The LOQ of proposed method was found to be 0. 4125 μg/mL and 0. 3458 μg/ml respectively for PCM and PDH.
Selectivity
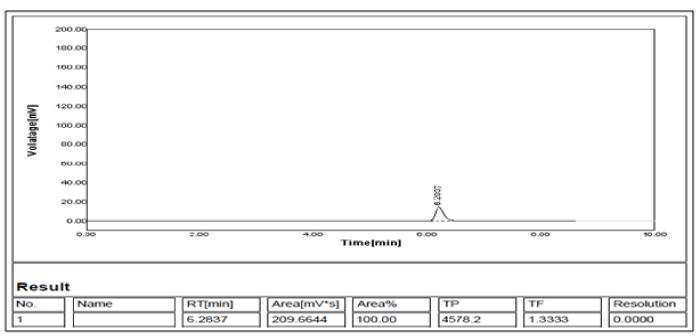
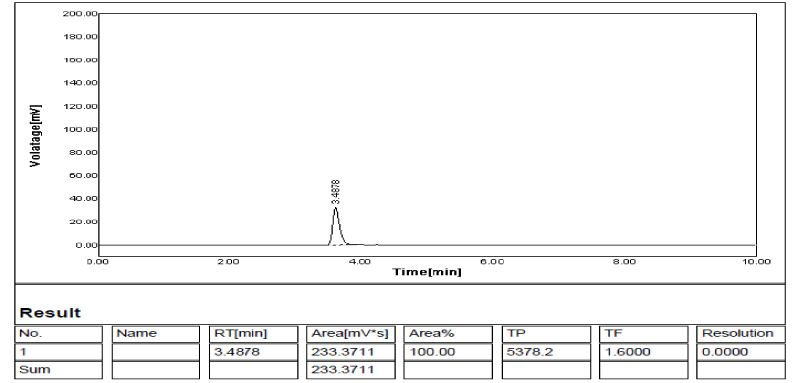
Comparison of the chromatograms obtained from the mobile phase (blank), PCM, PDH standards and the tablet revealed no significant interference, using same chromatographic conditions for all samples as indicated in Figures 3-5 and referring to the method selectivity and specificity for the analyze concerned as there is no interference of formulation recipients during the analysis.
Figure 4: Chromatogram of Prochlorpromazine Maleate.
Figure 5: Chromatogram of Pyridoxine HCl.
Robustness
Results of robustness study were shown in Table 4. The observations in all robustness parameters were examined and found within limit. The system suitability parameter were unaffected by small variations in wavelength, flow rate and mobile phase ratio.
    RSD of
      Parameters
    Drug
    Observation


    Wavelength
      (nm)
    Change in FR
      (mL/min)
    MP ratio


    270
    272
    274
    0.98
    1.0
    1.02
    -10%
    OMP
    +10%


    TP*
    PCM
    0.731
    0.858
    0.965
    0.336
    0.656
    0.798
    0.995
    0.423
    0.526


    PDH
    1.215
    0.556
    1.102
    0.512
    0.556
    0.238
    0.816
    0.664
    0.369


    TF*
    PCM
    0.0961
    0.125
    0.352
    0.095
    0.245
    0.234
    0.213
    0.092
    0.228


    PDH
    0.1256
    0.153
    0.126
    0.625
    0.285
    0.311
    0.424
    0.560
    1.136


    RT*

    PCM
    0.1221
    0.220
    0.187
    0.331
    0.230
    0.360
    0.562
    0.341
    0.354


    PDH
    0.3329
    0.369
    0.695
    0.755
    0.156
    0.289
    0.589
    0.663
    0.644
Table 4: Robustness study of system suitability parameter.
Conclusion
The results show that the HPLC method presented here can be considered suitable for the analytical determination of PCM and PDH in tablet dosage form. The proposed method is being linear in the concentration range used, high selectivity and specificity, high precision and adequate accuracy at the concentrations studied. The proposed method uses a simple mobile phase compared to the multi-component mobile phase in many reported methods. The separation and determination were achieved at an ambient temperature. Thus, it offers the advantages of low column back pressure, good peak shape, improved column efficiency, higher theoretical plates and consistent retention time. The developed method suggested non interference of formulation recipients in the estimation. Hence it can be easily and conveniently adopted for routine analysis. The developed chromatographic method is more accurate, precise, reliable and specific for estimation of PCM and PDH as compare to reported spectrophotometric method.
Acknowledgement
Authors are heartily thankful to Mehata Pharmaceutical Industries, Mumbai, India for providing pure standard drug samples. The authors also express gratitude to the management and the Principal of MES’s College of pharmacy Sonai, India for providing amenities to carry out this work.
References
- Sankey MG, Holt JE, Kaye CM. A simple and sensitive HPLC. method for the assay of prochlorperazine in plasma. Br J Clin Pharmacol. 1982; 13: 578-580.
- Neil MJO. The Merck Index. 14th edn. USA: Merck & Co. 2006.
- Jacob RA, Sotoudeh G. Vitamin C function and status in chronic disease. Nutr Clin Care. 2002; 5: 66-74.
- Midttun O, Hustad S, Solheim E, Schneede J, Ueland PM. Multianalyte quantification of vitamin B6 and B2 species in the nanomolar range in human plasma by liquid chromatography-tandem mass spectrometry. Clin Chem. 2005; 51: 1206-1216.
- Dhabab JM, Al-Ameri SAH, Taufeeq AH, Asso J. Separation and determination of Trifluoperazine and Prochlorperazine in pharmaceutical preparations by HPLC. Arab Uni. for basic & app. sci. 2013; 13:14-18.
- Patel VD, Patel PU. Development and validation of reverse phase high performance liquid chromatography method for simultaneous estimation of Betahistine Dihydrochloride and Prochlorperazine maleate in tablet dosage form. Int J Pharm. & drug anal. 2014; 2: 369-374.
- Mou C, Ganju N, Sridhar KS, Krishan A. Simultaneous quantitation of plasma doxorubicin and prochlorperazine content by high-performance liquid chromatography. J Chromatogr B Biomed Sci Appl. 1997; 703: 217-224.
- McKay G, Hall K, Cooper JK, Hawes EM, Midha KK. Gas chromatographic--mass spectrometric procedure for the quantitation of chlorpromazine in plasma and its comparison with a new high-performance liquid chromatographic assay with electrochemical detection. J Chromatogr. 1982; 232: 275-282.
- Yan M, Zhu YG, Li HD, Chen BM, Ma N, Lei YQ, Liu YP. Quantification of prochlorperazine maleate in human plasma by liquid chromatography-mass spectrometry: Application to a bioequivalence study. J Chromatogr B Analyt Technol Biomed Life Sci. 2009; 877: 3243-3247.
- Tashiro M, Naito T, Kagawa Y, Kawakami J. Simultaneous determination of Prochlorperazine and its metabolites in human plasma using isocratic liquid chromatography tandem mass spectrometry. Biomed Chromatogr. 2012; 26: 754-760.
- Kitamura K, Goto T, Kitade T. Second derivative spectrophotometric determination of partition coefficients of Phenothiazine derivatives between human erythrocyte ghost membranes and water. Talanta. 1998; 46: 1433-1438.
- Aman T, Majeed Z, Kazi AA, Khan IU. Spectrophotometric Determination of Prochlorperazine Maleate in Pure and Pharmaceutical Preparations. Microchim Acta. 2002; 138: 13-17.
- Yang Y, Peng Y, Zhao F, Zeng B. Voltammetric Determination of Prochlorperazine and Ethopropazine Using a Gold Electrode Modified with Decanethiol SAM. Sensors. 2003; 3: 524-533.
- Indian Pharmacopoeia, 6th edn. Ghaziabad, New Delhi: Ministry of Health and Family Welfare, Government of India. 2010.
- Moussa AFA. Colorimetic determination of Pyridoxine in pharmaceutical preparations. Mikrochim. Acta [Wein]. 1982; 77: 169-174.
- Argekar AP, Sawant JG. Simultaneous determination of pyridoxine hydrochloride and doxylamine succinate from tablets by ion pair reversed-phase high-performance liquid chromatography (RP-HPLC). Drug Dev Ind Pharm. 1999; 25: 945-950.
- Poongothai S, Ilavarasan R, Karrunakaran CM. Simultaneous and accurate determination of vitamins B, B6, B12, and alpha-lipolic acid in multivitamin capsule by Reverse-phase high performance liquid chromatographic method. Int J Pharm Sci. 2010; 2:133-139.
- Khor S, Tee ES. Development of a HPLC method for the simultaneous determination of several B-vitamins and ascorbic acid. Malays J Nutr. 1996; 2: 49-65.
- Munib UR, Rabia IY, Muhammad HS. A Stability-Indicating high performance liquid chromatographic assay for the simultaneous determination of Pyridoxine, Ethionamide, and Moxifloxacin in Fixed Dose Combination tablets. Chromatogr Res Int. 2014; 1-8.
- Giriraj P, Sivakkumar T. Development and validation of a rapid chemometrics assisted RP-HPLC with PDA detection method for the simultaneous estimation of Pyridoxine HCl and Doxylamine Succinate in Bulk and Pharmaceutical dosage form. Chromatogr Res Int. 2014; 1-8.
- Esteve-Romero J, Capella-Peiró ME, Monferrer-Pons L, Gil-Agustí M. Micellar liquid chromatography in clinical chemistry: application to the monitorization of B6 vitamins. Clin Chim Acta. 2004; 348: 69-77.
- Martinez CA, Bermudez JM, Villanueva RM, Sagrado S, Medina MJ. Analysis of pharmaceutical preparations containing antihistamine drugs by Micellar Liquid Chromatography. J Pharm Biomed Anal. 2006; 40: 312-321.
- Amrutkar RD, Rakibe VD, Amin PM. Simultaneous Estimation of Thiamine Hydrochloride and Pyridoxine Hydrochloride in multivitamin injection by UV spectrophotometric method. Int J Res Pharm & Biomed Sci. 2013; 4: 1229-1232.
- Nayak SC, Kulkarni PV, Bhaskar V, Chavhan V. Development And validation of UV spectrophotometric method for simultaneous estimation of Doxylamine Succinate and Pyridoxine Hydrochloride in bulk and tablet dosage form. Int J Pharm & Pharma Sci. 2013; 5: 390-393.
- Qadir RM, Mosa AA. Spectrophotometric assay of Pyridoxine Hydrochloride (Vitamin B6) in pharmaceutical preparations and serum via Arsenazo III- Cerium (III) reaction. Raf J Sci. 2008; 19: 28-41.
- Pathak A, Rajput SJ. Simultaneous derivative spectrophotometric analysis of Doxylamine Succinate, Pyridoxine Hydrochloride and Folic Acid in combined dosage forms. Ind J Pharmace Sci. 2008; 70: 513-517.
- Nataraj KS, Suvarna Y, Venkateswari G. Development and validation of method for simultaneous estimation of Pyridoxine Hydrochloride and Doxylamine Succinate in tablet dosage form by first order derivative spectroscopy. Int J Pharm & Pharma Sci. 2013; 5: 388-390.
- Bhagwat GB. UV Spectrophotometric analysis of Prochlorperazine Maleate and Pyridoxine Hydrochloride in tablet dosage form by simultaneous equation method. Int J ChemTech Res. 2013; 5: 2309-2316.
- International Conference on Harmonization, ICH, US FDA Federal Register. 1995; 60: 11260.
- International Conference on Harmonization, ICH, US FDA Federal Register. 1997; 62: 27463.


