Research Article
Austin J Anal Pharm Chem. 2014;1(4): 1019.
Spectrophotometric Method for Determination of Primaquine in Pharmaceutical Formulations via Derivatization with 1,2-Naphthoquinone-4-Sulfonate
Aida Makram Nouralla Altigani, Abdalla Ahmed Elbashir*
University of Khartoum, Faculty of Science, Chemistry Department, Sudan
*Corresponding author: :Abdalla Ahmed Elbashir, University of Khartoum, Faculty of Science, Chemistry Department, Sudan.
Received: October 10, 2014; Accepted: October 23, 2014; Published: October 25, 2014
Abstract
A rapid, simple and sensitive method for the determination of primaquine (PQ) using sodium 1,2-naphthoquinone-4-sulfonate (NQS) has been developed. The method is based on the formation of a brown color adduct from the reaction between PQ and NQS. The nucleophilic substitution reaction proceeds quantitatively at pH 10 buffer solution with absorption maximum at 485 nm. The calibration curve is linear over the range 10-60μg/mL and describes by the regression equation A? 0.005X+ 0.055C with a regression coefficient 0.9998. The limit of detection and quantity are 3.2 μg/mL and 9.9 μg/ mL respectively. The method is simple and can be applied for determination of PQ in pharmaceutical formulation in quality control laboratories.
Keywords: Spectrophotometric; Primaquine; Pharmaceutical formulation; Sodium1; 2-naphthoquinone-4-sulfonic (NQS)
Introduction
The drug primaquine (PQ) chemically known as diphosphate 8-[(4-amino-1-methylbutyl) amino]-6-methoxyquinoline is still the drug of choice for the eradication of the exoerythrocytic liver forms of Plasmodium vivax and Plasmodium ovale for the prevention of relapse of malaria [1]. The clinical use of PQ as a causal prophylactic and the rapeutic agent is, however, curtailed by its toxic side effect, especially for patients with glucose-6-phosphate dehydrogenize deficiency [2].
Several methods for the determination of PQ have been reported. This includes a reversed-phase HPLC method for the separation and identification of the oxidation products of PQ [3] as well as determination of PQ and its metabolite (carboxyprimaquine) in plasma and blood cell [4] and in calf plasma by LC-EC detection [5]. Other methods such as chemical sensors [6], Capillary electrophoresis [7-9] Spectrophotometric [10-14] and spectrofluorimetry [15] have also been proposed. The British Pharmacopoeia method [16] involves the dissolution of the sample in anhydrous acetic acid with gentle heating. The cooled, sample is titrated against perchloric acid, and the end point is determined potentiometrically.
NQS has been used as a color-developing reagent in spectrophotometric determination of pharmaceutical amines [17-28]. The applications of NQS for determination of NQS of pharmaceutical bearing amine group have recently been reviewed by Elbashir et al., [26]. The reaction between PQ and NQS has not investigated yet, therefore, the present study was devoted to investigate the reaction between NQS and PQ, and use this color reaction in the development of simple, rapid spectrophotometric method for determination of PQ in pharmaceutical formulation.
Experimental
Apparatus
Absorbance was carried out by using a spectrophotometer model shimadzu 1800. With quartz cells of 1cm optical path length. pH meter was used for pH measurements.
Material and Reagent
All chemicals used were of analytical reagent grade. 1,2 naphthoquinone-4-sulfonate (NQS) and primaquine diphosphate standard (PQ) were obtained from (Aldrich Chemical Co., St. Louis, USA). Commercial primaquine diphosphate pharmaceutical preparations in the form of tablets, (claimed to contain 7.5 mg active ingredient) were purchased from a local drug-store. Doubly distilled water was used to prepare all solutions.
Preparation of standard and sample solution
Stock standard solution of PQ (200 μg/ mL)
An accurately 0.02 g of PQ standard was dissolved in distilled water and transferred in 100 mL volumetric flask diluted to mark. The solution was further diluted to obtain working solution.
Sample Solution
Four tablets (PQ 15 mg / tablet) were weighted and finely powdered. A portion of the powder equivalent to 0.09 g of the drug was dissolved in distilled water and transferred into 50 mL volumetric flask the solution was completed to mark, shaken well filtered and then analyzed by following procedure.
NQS (0.4%, w/v)
Was prepared by dissolving 0.4 g in 100 mL volumetric flask and complete the volume with distilled water. The solution was freshly prepared.
Procedure
A 2.0 mL of 200 μg / mL PQ was transferred in 10 mL volumetric flask, 2.0 mL of NQS was added and followed by 1.5 mL of buffer solution pH 10, the flask was completed to volume with distilled water and the absorbance was measured at 485 nm against blank.
Job's method
The Job's method of continuous variation [29] was employed master equimolar (1x10⁻³ M). Aqueous solution of PQ and NQS were prepared. Series of master solution of PQ and NQS were made up comprising different complementary proportions (1:9,...9:1, inclusive) in 10 mL volumetric flask containing 1.5 mL of buffer solution pH=10.
Results and Discussion
Absorption spectra
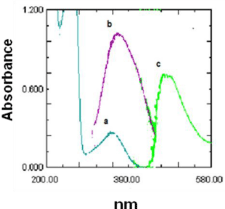
The absorbance spectrum of PQ were carried out against water it was found that PQ exhibits maximum absorption peak λ max at 360 nm (Figure 1a). The reaction between PQ and NQS was performed and the absorption spectrum of product was recorded against blank (Figure 1c) it was found that the product is brown colored exhibiting λ max at 485 nm and the λ max of NQS at 362 nm (Figure 1b).
Figure 1: Absorption spectra of (a) PQ (40 mg/ml) against water blank (b) NQS (0.2% (w/v) against water blank (c) the reaction product of PQ with NQS against reagent blank of NQ. λ max of PQ (351). λ max of NQS (361) λ max of complex (485).
Optimization of the reaction conditions
The optimum conditions for the development of method were established by varying the parameters one at a time while keeping the others fixed and observing the effect produced on the absorbance of the colored product. In order to establish experimental conditions, the effect of various parameters such as, pH, concentration of NQS, time and buffer volume were investigated.
Effect of pH
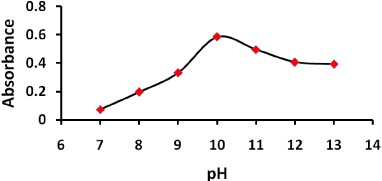
The effect of pH on the reaction between PQ and NQS was examined by varying pH from 7 to 13 as shown in Figure 2. The absorbance increased rapidly up to 10 and then decreased. The absorbance reached maximum at pH 10 this often due to degree of nucleophilic substitution is also maximum at pH 10 [25, 26]. However, when pH is higher than 10 the absorbance of the system of PQ-NQS decreases. Presumably it is due to increase of the amount of hydroxide ion. Hydroxide ion has good nucleophilic ability and can hold back the nucleophilic substitution reaction between PQ and NQS, resulting in the descent of the absorbance of each system. Therefore, pH 10 was selected for the optimal experimental conditions.
Figure 2: Effect of pH on the reaction of PQ with NQS 2 mL of PQ (40 μg/mL) 2mL buffer solution (pH 10) 2.0 mL NQS (0.2 w/v %) temperature: 25°C ; reaction time:15 min.
Effect of standing time
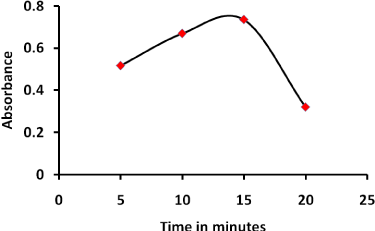
The absorbance of product was determined at different time period at 25°C keeping other conditions unchanged. The results show that the absorbance increased rapidly and reached maximum at 15 min. then decreased until become constant at 25 min. therefore, 15 min. is considered optimum Figure 3.
Figure 3: Effect of standing time on the reaction of PQ with NQS 1.5 mL of PQ (40 µg/ mL) 2.0 m Lbuffer solution pH 10, 2.0 mL NQS (0.2 w/v %) temperature 25°C.
Effect of NQS concentration
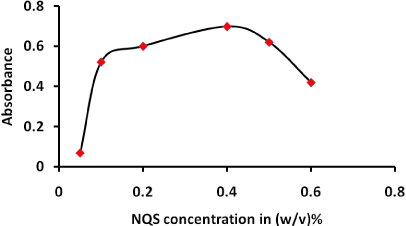
The effect of NQS concentration was studied in the range (0.05- 0.6 w/v%) as shown in Figure 4. When the concentration increased more products is formed up to 0.4 after that absorbance decreased therefore, 0.4 w/v% concentration is considered optimum.
Figure 4: Effect of NQS concentrations on the reaction of PQ with NQS. 2 mL of PQ (40 µg/mL): 1.5 mL; buffer solution (pH (10): temperature: 25°C; reaction time:15 min.
Effect of amount of buffer
The effect of amount of buffer on the reaction was studied while keeping other conditions unchanged. The absorbance enhanced with rise of amount of solution and become maximum when the amount of buffer 1.5 mL, therefore, 1.5 mL is considered optimum (data not shown).
From the above experiments, the optimized conditions used for the assay were: pH 10.0, NQS concentration 0.4% w/v, volume of the buffer 1.5, reaction time 15 min and temperature 25°C.
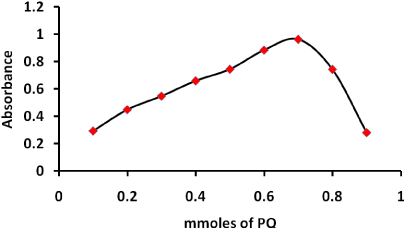
Furthermore, the molar ratio of NQS to PQ in the reaction mixture was studied according to Job's method of continuous variation [29]. A 7.50x10⁻⁴ mol/ L standard solution of PQ and solution of NQS were used. The unsymmetrical bell shape of Job's plot confirmed that one molecule of PQ reacts with two molecules of NQS, NQS: PQ 2:1 Figure 5. Based on the observation molar ratio, the reaction pathway was postulated to proceed as shown in Scheme 1.
Figure 5: The continuous variation plot for the stoichiometry of the reaction of PQ with NQS.
Scheme 1: Reaction pathway of PQ with NQS.
Validation of Method
Calibration curve
Calibration curve for the determination of PQ by its reaction with NQS was constructed by plotting absorbance as a function of the corresponding concentration .The regression equation for the result was A=0.005X + 0.055C .Where A is absorbance at 485 nm, x concentration of PQ μg/mL (10-60) and R is correlation coefficient. The limit of detection (LOD) and the limit of quantification (LOQ) were determined according to the following formula
LOD = 3.3 SDa / b, LOD =10SDa / b, SDa is stander deviation of intercept; b is slope [30]. The obtained results are summarized on Table 1.
    Parameter
    Value


    Measurement    wavelength  nm
    485


    Linear    range (μg / mL)
    10-60


    Intercept
    0.0554


    Stander    deviation of intercept
    0.005472


    Slope
    0.00549


    Stander    deviation of slope
    0.000129


    Correlation    coefficient(r)
    0.9998


    Limit    of detection(μg/mL)
    3.28


    Limit    of quantification (μg/mL)
    9.96
Table 1: Parameters for the performance of the proposed method.
Recovery of PQ
The standard addition method was applied to check the accuracy of the proposed method is validated by applying stander addition technique in which variable amounts of drug were added to the previously analyzed PQ solution. The result of analysis of pharmaceutical dosage form and recovery study suggests that there is no interference from any excipients that present in the tablet, Table 2
    Taken    μg (drug)  primaquine diphosphate (PQ)
    Added    μg standard
    Found    μg
    Recovery % ± RSDa


    15
    10
    24.12
    96.48±0.54


    "
    20
    36.6
    104.6±0.54


    "
    50
    62.4
    96±0.77
Table 2: Determination of PQ in pharmaceutical preparation, applying standard addition method.
Robustness
Robustness was examined by evaluating the influence of small variation of the method variables including the concentration of analytical reagent. pH of buffer solution and time of reaction. In this experiment one parameter was changed where the other kept constant and the recovery percentage was calculated each time it was found that small variation in the method variables did not significantly affect the procedure.
Application of the proposed method to analysis of primaquine dosage form
The proposed method was applied to the pharmaceutical formulations of PQ, indicating the high accuracy of the proposed method for the determination of the studied drug. The proposed method has the advantage of being virtually free from interferences by excipients. The percentage was 96.40±0.40 (value is means of five determinations), Table 3.
    Parameter
    Recovery % ± RSDa


    Recommended conditions
    96.4± 40


    NQS    concentration (w /v%) 0.38
    96.3± 0.82


    NQS    concentration (w /v%) 0.42
    101.5 ± 1.28


    pH    9.8
    99.5 ± 0.23


    pH    10.2
    100 ± 0.56


    Reaction    time (min) 13
    100.5 ± 0.32


    Reaction    time (min) 17
    96.15 ± 0.52
Table 3: The robustness of the proposed method.
Conclusion
The present paper described the evaluation of NQS as analytical reagent in the development of simple, sensitive, and accurate spectrophotometric method, for the determination of PQ in pharmaceutical formulation. The proposed method is simple, reliable, specific, accurate, reproducible, and highly sensitive, for the determination of PQ in commercially available dosage forms. The method is also cost effective and environmentally friendly; therefore the proposed method can be used advantageously as a routine method for the determination of PQ in quality control and industry.
References
- Hollingdale MR. The Liver: Biology and Pathobiology. Raven Press: New York, 1988.
- Peters AL, Van Noorden CJ. Diagnosis of glucose-6-phosphate dehydrogenase deficiency in developing countries. 2008; 33: 104-109.
- Dua VK, Sinha SN, Sharma VP . Chromatographic studies on the isolation of peroxydisulphate oxidation products of primaquine. J Chromatogr B Biomed Sci Appl. 1998; 708: 316-320.
- Dua VK, Kar PK, Sarin R, Sharma VP. High-performance liquid chromatographic determination of primaquine and carboxyprimaquine concentrations in plasma and blood cells in Plasmodium vivax malaria cases following chronic dosage with primaquine J. Chromatogr. B: Biomed.Appl.1996; 675: 93-98.
- Endoh YS, Yoshimura H, Sasaki N, Ishihara Y, Sasaki H, Nakamura S. et al. High-performance liquid chromatographic determination of pamaquine, primaquine and carboxy primaquine in calf plasma using electrochemical detection. J. Chromatogr. Biomed. Appl.1992; 579:123-129.
- Saad BB, Zahid ZA, Rahman SA, Ahmad MN. Primaquine-selective electrodes based on macrocyclic crown ethers. Analyst, 1992; 177: 1319-1324.
- ElBashir AA, Saad B, Mohmed Ali AS, Saleh MI. Development of a capillary electrophoresis method for the enantioselective estimation of primaquine in pharmaceutical formulations. JAOAC Intern.,2008; 91: 536-541.
- ElBashir AA, Saad B, Mohmed Ali AS, Saleh MI, Aboul-Enein HY. Enantioselective analysis of primaquine and its impurity quinocide by capillary electrophoresis, Biomedical Chromatography 2009; 23: 295-301.
- Elbashir AA, Saad B, Ali AS, Saleh MI, Aboul-Enein HY . Determination of quinocide as impurity in primaquine tablets by capillary zone electrophoresis. Biomed Chromatogr. 2009; 23: 464-471.
- Bergqvist Y, Churchill FC . Detection and determination of antimalarial drugs and their metabolites in body fluids. J Chromatogr. 1988; 434: 1-20.
- Hassan SM, Metally MES, Cuf AMA. A Sensitive Colour Reaction for the Deterination of Primaquine in Pharmaceutical Preparations. Anal. Lett., 1982; 15: 213-219.
- Sulaiman ST, Amin D. Spectrophotometric Determination of Primaquine, Chloroquine, 8-Aminoquinoline and 4-Aminoquinalidine with Chloranil. Intern. J.Environ. Anal. Chem., 1985; 20: 313-317.
- El-Kommos ME, Emara KM, Alexandria Spectrophotometric determination of certain pharmaceutical secondary aromatic amines using p-dimethylamino- cinnamaldehyde J. Pharm. Sci. 1988; 2: 171-176.
- Ibrahim FA, El-Brashy A, Belal F. Spectrophotometric determination of some pharmaceutically-important aminoquinoline antimalarials Mikrochim. Acta, 1989; 1: 321-327.
- Ibrahim FA, Belal F, El-Brashy A. Fluorometric determination of some aminoquinoline antimalarials using eosin, Microchemical Journal, 1989; 39: 65-70
- British Pharmacopeia on CD-ROM (System Simulation Ltd, the stationary office, London) 3rd Edn. (2000).
- Li QM, Yang ZJ Spectrophotometric determination of aminomethylbenzoic acid using sodium 1,2-naphthoquinone-4-sulfonate as the chemical derivative chromogenic reagent. Spectrochim Acta A 2007; 60: 656-661.
- Darwish IA. Kinetic spectrophotometric methods for determination of trimetazidine dihydrochloride. Anal Chim Acta 2005; 551: 222-231.
- Xu L, Wang H, Xiao Y . Spectrophotometric determination of ampicillin sodium in pharmaceutical products using sodium 1,2-naphthoquinone-4-sulfonic as the chromogentic reagent. Spectrochim Acta A Mol Biomol Spectrosc. 2004; 60: 3007-3012.
- Ebraheem SAM, Elbashir AA, Abou-Enein HY. Spectrophotometric methods for the determination of gemifloxacin in pharmaceutical formulations. Acta Pharma Sinica 2011; 4: 248-253.
- Ahmed SMA, Elbashir AA, Aboul-Enein HY. New spectrophotometric method for determination of cephalosporins in pharmaceutical formulations. Arabian Journal of Chemistry.2011
- Elbashir AA, Ahmed SM, Aboul-Enein HY . New spectrofluorimetric method for determination of cephalosporins in pharmaceutical formulations. J Fluoresc. 2012; 22: 857-864.
- Elbashir AA, Elwagee AHE. Spectrophotometric determination of pyrimethamine (PYM) in pharmaceutical formulation using 1,2-naphthoquinone-4-sulfonate (NQS). Journal of the Association of Arab Universities for Basic and Applied Sciences 2012; 11: 32-36.
- Elbashir AA, Awad SF. A New Spectrophotometric Method for Determination of Penicillamine in Pharmaceutical Formulation Using 1, 2-naphthoquine-4-sulfonate (NQS). J Pharmacovigilance 2013; 1: 18-22.
- Elbashir AA1, Ebraheem SA, Elwagee AH, Aboul-Enein HY . New spectrophotometric methods for the determination of moxifloxacin in pharmaceutical formulations. Acta Chim Slov. 2013; 60: 159-165.
- Elbashir AA, Abir AA, Shazalia MAA, Aboul-Enein HY. 1, 2-naphthoquinone-4-sulphonic acid sodium salt (NQS) as an analytical reagent for the determination of pharmaceutical amine by spectrophotometry. Spectroscopy Review 2012; 47: 219-232.
- Abdalla FAA, Elbashir AA. Development and Validation of Spectrophotometric Methods for the Determination of Mesalazine in Pharmaceutical Formulation, Med chem, 2014.
- Li QM, Yang ZJ . Spectrophotometric determination of aminomethylbenzoic acid using sodium 1,2-naphthoquinone-4-sulfonate as the chemical derivative chromogenic reagent. Spectrochim Acta A Mol Biomol Spectrosc. 2007; 66: 656-661.
- Job., 1964 Job P, Ann. Chem. Job, Advanced Physicochemical Experiments,2nd edition ., Oliner and Boyd, Edinburgh,1964. 54,
- Validation of analytical procedure, Methodology (1996) International Conference on Harmonization (ICH) 1450.
