Research Article
Austin J Anal Pharm Chem. 2014;1(5): 1024.
Development and Validation of Spectrophotometric Method for Estimation of Bivalirudin
Shivaraj D Sadekar1*, Ramchandra N Chilkawar2, S M Patil1, J K Saboji1, Basavaraj K Nanjwade3
1Department of Pharmaceutics, KLE College of Pharmacy, India
2Department of Quality Assurance, Remidex Pharma Pvt Ltd., India
3Department of Pharmaceutics, Omer Al-Mukhtar University, Libya
*Corresponding author: :Mr. Shivraj D Sadekar, Department of pharmaceutics, India.
Received: October 02, 2014; Accepted: November 06, 2014; Published: November 13, 2014
Abstract
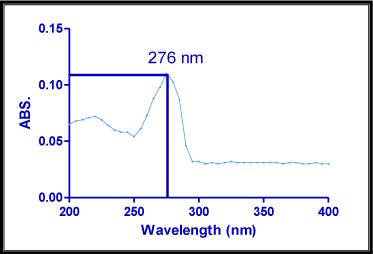
In this research work we developed and validated UV spectrometric method for bivalirudin and it is simple, accurate, fast, cost efficient, reproducible method. This method developed for the estimation of bivalirudin in bulk and finished pharmaceutical dosage form. Based on measurement of absorption of UV light, the spectra of bivalirudin in water showed maximum absorption wavelength (λ max) at 276 nm. The calibration curve plotted over the concentration range from 2-20 μg/ml of bivalirudin with correlation coefficient 0.998. Validation was performed as per ICH Q2 guidelines for the linearity, accuracy, precision and recovery. Developed method has good reproducibility with % Relative Standard Deviation (RSD) less than one. Limit of detection (LOD) and Limit of Quantification (LOQ) were found to be 0.5892μg/ml and 1.785μg/ml respectively by simple UV Spectrophotometric. Thus proposed method can successfully applied for bivalirudin in routine analysis work.
Keywords: Bivalirudin; Spectrophotometric; Method; ICH Q2 guidelines
Introduction
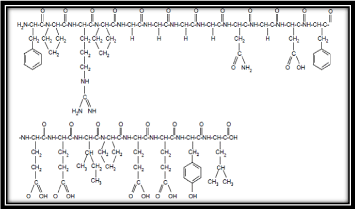
Chemically Bivalirudin is a synthetic 20 residue peptide (thrombin inhibitor) which reversibly inhibits thrombin. Once bivalirudin, thrombin inhibitor bound to the active site and thrombin cannot activate fibrinogen into fibrin and the crucial step in the formation of thrombus. It is has been administered intravenously because it can cause blood stagnation and it is important to monitor changes in hematocrit, international normalized ratio and blood pressure. Activated partial thromboplastin time, its chemical formula C98H138N24O33 and molecular weight is 2180.28 (Figure 1).
Figure 1: Structure of Bivalirudin (synthetic 20 residue peptide).
Bivalirudin is recommended for use in patients undergoing percutaneous coronary intervention (PCI). In patients at moderate to high risk acute coronary syndromes due to unstable angina or non- ST segment elevation in which a percutaneous coronary intervention (PCI) is planned.
Its mechanism of action inhibits the action of thrombin by binding both to its catalytic site to its anion-binding exposited. Thrombin is a serine proteinase that plays a central role in the thrombotic process and acting to cleave fibrinogen into fibrin monomers and to activate from Factor XIII to Factor XIIIa. It is allowing fibrin to develop a covalently cross-linked framework which stabilizes the thrombus. Thrombin also activates Factors V and VIII promoting further thrombin generation to generation, activates platelets, stimulating aggregation and granule release [1, 2].
Till date there is no validated UV spectrophotometric method available for estimation of bivalirudin. The main goal and object of present research work was to develop an UV spectrometric method for determination of bivalirudin in bulk form and finished pharmaceutical dosage form and uses. This result for analysis of drugs in pharmaceuticals as it is rapid, economic and effective for quality control of pharmaceutical formulations containing bivalirudin by UV spectrophotometric method.
Materials and Methods
Instrument
Instruments used were UV-visible double beam spectrophotometer model Shimadzu UV1800 with one cm matched quartz cells and AJ-Vibra electronic balance manufactured by Essae- Teraoka Ltd., Made in Japan. The glass wares used in each procedure were soaked overnight in a mixture of chromic acid and sulphuric acid rinsed thoroughly with double distilled water and dried in hot air oven for prior use. The absorption spectra of reference and test solution were carried out in a one cm quartz cells over the range of 200-400 nm.
Materials
Pure samples, bivalirudin is purchased from HK SIHUI Pharmacy Ltd., Shenzhen, China, other reagents and chemicals were of analytical grade from Loba Chemicals Pvt. Ltd., Mumbai, India.
Preparation of standard stock solution
Stock solution I: Accurately weighed quantity (10 mg) of bivalirudin was dissolved separately in small quantity of distilled water and volume was made up to 10ml with distilled water to get a solution containing 1000μg/ml.
Stock solution II: From the stock solution, 1ml solution was taken and then diluted up to 10ml with same solvent in a volumetric flask and then concentration of this stock solution was 100μg/ml.
Determination of λ max
Most of drugs absorb light, UV wavelength (200-400 nm) since that contains aromatic double bonds. The solution containing 10μg/ ml of bivalirudin was prepared and scanned over the range of 200-400 nm against distilled water as blank using Shimadzu UV1800 double beam UV spectrophotometer (Figure 2). The maximum wave length obtained in the graph was considered as λmax for the pure drug [3, 4, 5, 6, 7, 8, 9, 10].
Figure 2: Determination of λmax of Bivalirudin.
Preparation of Calibration Curve
Stock solution II and III
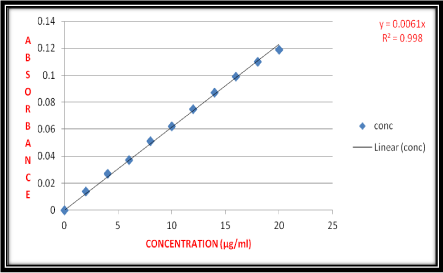
From the stock solution I, stock solution II and stock solution III was prepared to give a concentration of 10μg/ml in distilled water. Aliquots of 0.2, 0.4, 0.6, 0.8, 1.0, 1.2, 1.4, 1.6, 1.8 and 2.0 ml of stock solution were pipette out into 10 ml volumetric flasks. The selected volumetric flasks volumes were made up to the mark with distilled water. These dilutions give 2, 4, 6, 8, 10, 12, 14, 16, 18 and 20 μg/ml concentration of bivalirudin respectively (Table 1). The absorbance was measured at 276 nm using UV spectrophotometer (Figure 3).
Figure 3: Calibration Curve for Bivalirudin.
    Sr. no.
    Concentration
      (µg/ml)
    Absorbance at 276    nm
      Mean ± Standard    Deviation *


    1
    2
    0.014±0.001


    2
    4
    0.027±0.003


    3
    6
    0.037±0.001


    4
    8
    0.051±0.007


    5
    10
    0.062±0.008


    6
    12
    0.075±0.001


    7
    14
    0.087±0.006


    8
    16
    0.099±0.007


    9
    18
    0.110±0.007


    10
    20
    0.119±0.007
Table 1: Calibration data for the method development.
Methods of Validation
Linearity and range
The linearity of response obtained between 2 to 20μg/ml concentrations and calibration curve were obtained by plotting absorbance versus concentration data and treated by linear regression analysis. The calibration curve equation for bivalirudin is y= 0.0061x and calibration curve was found to be linear in the above mentioned concentration and correlation coefficient (R2) was 0.998.
Repeatability
Repeatability has been determined by analyzing samples 20μg/ ml of bivalirudin for six times, the results are reported in Table 2. Precision of the method was studied as intra-day and inter-day variations. An intra-day precision was determined by analyzing 06, 12, 18μg/ml of bivalirudin for three times within a day. An inter-day precision was determined by analyzing same concentration of solutions daily for three days (Table 3).
    Sr. No.
    Conc. (μg/ml)
    Wavelength (nm)
    Absorbance
    Mean± S.D.
    Percentage R.S.D (%)


    1
    20
    276
    0.118

      0.119±0.000298


      0.250420


    2
    276
    0.119


    3
    276
    0.120


    4
    276
    0.119


    5
    276
    0.118


    6
    276
    0.120
Table 2: Data showing repeatability of absorbances.
    Drug
    Conc. (μg/ml)
    Intra-day mean
      Absorbance
      ± S.D.
    Percentage
      RSD (%)
    Inter-day Mean Absorbance
      ± S.D.
    Percentage RSD (%)


      Bivalirudin
    06
    0.037±0.00004713
    0.1273
    0.038±0.000094
    0.247


    12
    0.075±0.0003773
    0.5031
    0.077±0.0001886
    0.245


    18
    0.119±0.000471
    0.395
    0.110±0.00033
    0.300


    Mean percentegeRSD (%)

    0.3418

    0.264
Table 3: Results for intra-day and inter-day precision of Bivalirudin.
Limit of detection (LOD) and Limit of quantification (LOQ)
Determination of the detection and quantification limits was performed based on the standard deviations of y-intercept and the slope of the least square line parameters as defined in the International Conference on Harmonization (ICH) Q2 guidelines. The Limit of Detection (LOD) and Limit of Quantification (LOQ) were 0.5892 μg/ ml and 1.785 μg/ml respectively and data (Table 5).
    Drug
    Drug    amount (μg/ml)
    Level    of addition (%)
    Added    amount (μg/ml)
    %    Recovery
    Average    % recovered


    Bivalirudin
    6
    80
    4.8
    99.12
    99.40


    6
    100
    6.0
    99.73


    6
    120
    7.2
    99.35
Table 4: Determination of accuracy by percentage recovery method.
    Sl. No
    Parameters
    Results


    01
    Absorption maxima
    276nm


    02
    Linearity range (μg/ml)
    2-20 μg/ml


    03
    Std. regression equation
    Y= 0.0061 x


    04
    Correlation coefficient (R2)
    R2 =0.998


    05
    Specificity
    A 12µg/ml solution of    bivalirudin in solvent(water) at UV detection of 276 will show an absorbance    value of                          0.119±0.000298


    06
    Accuracy ( % Recovery)
    99.40%


    07
    Precision RSD repeatability    (n=3)
    0.250420


    Intra day (n=3)
    0.3418


    Inter day (n=3)
    0.264


    08
    Molar absorptivity
    1.3616x10⁴  L/mol.cm


    09
    Limit of detection (LOD)
    0.5892 µg/ml


    10
    Limit of quantification (LOQ)
    1.785 µg/ml
Table 5: Validation parameters for Bivalirudin.
Recovery study
To analyze the accuracy of developed method and it was applied to analyze commercially available bivalirudin for injection 250mg by Gennomax-Gennova Biopharmaceuticals. Weighed 100mg of bivalirudin for injection and transferred to the 100ml volumetric flask. Then 10ml of distilled water as a solvent was added and kept for 15-20 min with frequent shaking and volume made up to the mark with solvent. Then solution was filtered through Whattman filter paper and this filtrate suitably diluted with distilled water as a solvent to get the solution of 06μg/ml concentration. Then sample absorbance was measured against the blank solution and recovery was performed at three different levels which was 80%, 100% and 120%. Pre-analyzed sample solution, a known amount of standard drug solution was added at three different levels and absorbances were recorded. The drug content of preparation was calculated using the standard calibration curve and amount of drug estimated (Table 4).
Results and Discussion
An attempt has made to develop sensitive, economic, rapid, precise and accurate spectrophotometric method for bivalirudin in bulk and pharmaceutical finished dosage forms. The proposed method is based on UV spectrophotometric absorption in UV region using water as a solvent, maximum absorbance was found to be 276 nm; Limit of Detection (LOD) and Limit of Quantification (LOQ) were found to be 0.5892μg/ml and 1.785μg/ml respectively. Then proposed work showed molar absorptive 1.3616x10⁴L/mol.cm and calibration curve of bivalirudin plotted at 276nm (Figure 3) and linear relationship was obtained between 2-20μg/ml. Then accuracy of the method was determined by calculating mean percentage recovery it was found to be 99.40% (Table 5). Further precision was calculated as repeatability, inter and intraday variations and % Relative Standard Deviation (RSD) was less than one.
Conclusion
A UV spectrophotometric method for bivalirudin in bulk and pharmaceutical finished dosage form has been developed and validated. The proposed method is selective, accurate, precise and linear over the concentration range studied. The proposed method is applicable for quality control, routine analysis and determination of bivalirudin in bulk and pharmaceutical dosage form.
Acknowledgement
The authors are thankful to HK SIHUI Pharmacy Ltd., Shenzhen, CHINA for providing Bivalirudin as a sample to conduct research work. The authors are also thankful to Principal KLE College of Pharmacy, Nipani and Department of Pharmaceutics, KLE College of Pharmacy, Nipani for providing the required facility, guidance and support.
References
- https://www.drugbank.ca/drugs/DB00006
- https://www.google.co.in
- Pavia DL, Lampman GM, Kris GS, Vyvyan JR. Spectroscopy. 2011;7: 370.
- https://www.chemblink.com/products/112809-51-5.htm
- Njar VC, Brodie AM . Comprehensive pharmacology and clinical efficacy of aromatase inhibitors. Drugs. 1999; 58: 233-255.
- Santen RJ, Harvey HA . Use of aromatase inhibitors in breast carcinoma. Endocr Relat Cancer. 1999; 6: 75-92.
- Lipton A1, Demers LM, Harvey HA, Kambic KB, Grossberg H, Brady C, Adlercruetz H . Letrozole (CGS 20267). A phase I study of a new potent oral aromatase inhibitor of breast cancer. Cancer. 1995; 75: 2132-2138.
- Bajetta E, Zilembo N, Dowsett M, Guillevin L, Di Leo A, Celio L, et al . Double-blind, randomised, multicentre endocrine trial comparing two letrozole doses, in postmenopausal breast cancer patients. Eur J Cancer. 1999; 35: 208-213.
- Iveson TJ, Smith IE, Ahern J, Smithers DA, Trunet PF, Dowsett M . Phase I study of the oral nonsteroidal aromatase inhibitor CGS 20267 in postmenopausal patients with advanced breast cancer. Cancer Res. 1993; 53: 266-270.
- Kvinnsland S, Anker G, Dirix LY. High activity and tolerability demonstrated for exemestane in postmenopausal women with metastatic breast cancer who had previously failed on tamoxifen treatment. European Journal of Cancer. 2000; 36: 976-982.


