
Research Article
Austin J Anal Pharm Chem. 2023; 10(1):1157.
Analytical Method Development Using Quantum Laser Cascade Spectroscopy with Diffuse and Attenuated Total Reflectance for Determining Low Concentrations of Active Pharmaceutical Ingredients
Plata-Enríquez JL1-2; Puche-Mercado JF1; Palmer-Velázquez S1; Carrión-Roca W1,3; Francheska M Colón-González1; Hernández-Rivera SP1*
¹Center for Chemical Sensors (CC) / Chemical Imaging and Surface Analysis Center (CISAC), Department of Chemistry, University of Puerto Rico-Mayagüez, Mayagüez, PR 00681, USA
²Department of Polymer Engineering, University ECCI, Bogota, Colombia
³AbbVie Biotechnology Ltd., Barceloneta, PR, 00617, USA
*Corresponding author: Hernández-Rivera SP Center for Chemical Sensors, Department of Chemistry, University of Puerto Rico-Mayagüez, PO Box 9019, Mayaguez, PR 00681, USA. Tel: +1 787-342-1729 Email: samuel.hernandez3@upr.edu
Received: July 13, 2023 Accepted: August 24, 2023 Published: August 31, 2023
Abstract
Quantum Cascade Laser Spectroscopy (QCLS) will quantify acetaminophen as an active pharmaceutical ingredient in different low concentrations formulations in tablet presentation. Tablets contain acetaminophen in nine blends ranging from 0.0% to 3.0% w/w, with mannitol, croscarmellose, cellulose, and magnesium stearate, as excipients. The tablets were analyzed in non-contact mode by mid-infrared attenuated total reflectance and diffuse reflectance backscattering. Measurements were conducted covering the spectral range 770–1890 cm-1. Calibrations were generated by applying multivariate analysis using principal component analysis. The high power of the quantum cascade laser-based spectroscopic system attached to attenuated total reflectance and diffuse reflectance backscattering resulted in the design of discrimination methodologies for pharmaceutical applications with acetaminophen as an active pharmaceutical ingredient in the formulation. The main conclusion is that attenuated total reflectance is better for other analyses. For tablet analysis using mid-infrared quantum cascade lasers, diffuse reflectance backscattering is more accurate for predicting the API content. QCLS is gaining even more acceptance as a valuable tool in Process Analytical Technology.
Keywords: Quantum cascade lasers; Content uniformity; Active pharmaceutical ingredients; Diffuse reflectance backscattering; Principal component analysis; Process analytical technology
Abbreviations: CU: Content Uniformity; APIs: Active Pharmaceutical Ingredients; PAT: Process Analytical Technology; HPLC: High-Performance Liquid Chromatography; NIR: Near-Infrared; MIR: Mid-Infrared; T-RS: Transmission Raman Spectroscopy; QCL: Quantum Cascade Laser; QCLS: Quantum Cascade Laser Spectroscopy; MVA: Multivariate Analysis; DRBS: Diffuse Reflectance Backscattering; ATR: Attenuated Total Reflectance; PCA: Principal Components Analysis; SNV: Standard Normal Variate; FD: First Derivative; SD: Second Derivative
Introduction
Active Pharmaceutical Ingredients (APIs) commercialization requirements are related to the product's efficacy and Content Uniformity (CU). Testing is a crucial task in pharmaceutical manufacturing, as it ensures that each product that reaches a consumer contains a safe dosage of the API. The most extensively used analytical technique for determining API in pharmaceutical products, High-Performance Liquid Chromatography (HPLC), is used offline in a quality control lab to monitor the dosage of finished tablets due to its sensitivity and the ability to obtain a measurement from the entire tablet volume. However, HPLC analysis involves many solvents and consumables and often takes hours. This slow and destructive technique requires trained personnel and can cause delays in the manufacturing process. Analytical methods in Process Analytical Technology (PAT) in pharmaceutical applications to perform CU testing should be fast, noninvasive, and achieved with limited sample preparation. Other commonly used techniques are Near-Infrared Spectroscopy (NIR) [1] and Transmission Raman Spectroscopy (T-RS) [2-6] and have been explored as alternative methods for rapid and non-destructive on- and at-line CU testing with no sample preparation. These two methods have been widely used in the pharmaceutical industry for decades, resulting in extensive databases and calibration models for various APIs and excipients. Mid-Infrared (MIR) laser spectroscopy using Quantum Cascade Lasers (QCLs) might have fewer available databases and models, making it more challenging to establish robust analytical methods for certain applications.
From a different point of view, NIR and RS may have limited sensitivity for low-concentration impurities and APIs. This fact can be attributed to the limited penetration depths in thick or highly scattering tablets. In contrast, Quantum Cascade Lasers Spectroscopy (QCLS) can penetrate the sample deeper, allowing for the analysis of API distribution and potential inhomogeneities within the tablet. QCL spectroscopy can offer higher sensitivity, allowing for the detection and quantification of trace amounts of substances. This advantage is particularly beneficial when dealing with complex pharmaceutical formulations where overlapping spectra can be problematic. QCLS can target specific molecular vibrations, specifically identifying individual compounds more precisely than NIR.
In this regard, MIR-QCLS [7] can contribute to the pharmaceutical environment by serving as a platform for methods development in PAT applications [8]. QCLS is rarely used to determine the low-concentration dosage of APIS. QCLs are semiconductor lasers specifically designed to emit light in the MIR and Far-Infrared (FIR) regions of the electromagnetic spectrum. Unlike traditional lasers that rely on electronic transitions, QCLs operate on electron intersubband transitions in quantum wells. The structure of the QCLs allows for precise control of the energy levels, enabling the emission of a tunable and narrowband infrared beam at specific wavelengths that match molecular vibrational transitions. This tunability allows researchers to target specific molecular vibrations of interest and achieve high selectivity and sensitivity in their measurements.
Because this extremely sensitive MIR technique can be combined with the powerful statistical routines of Multivariate Analysis (MVA) [9] to provide a new and efficient method for determining the low-concentration dosage of APIs. This article linked these two methodologies, demonstrating a proof of concept for the CU analyses of tablet formulations containing acetaminophen, mannitol, croscarmellose, cellulose, and magnesium stearate. Spectral data of the various formulations was collected using QCLS in two different optical configurations: Diffuse Reflectance Backscattering (DRBS) and Attenuated Total Reflectance (ATR).
The ATR optical setup (Figure 1) is a spectroscopic technique used to study the properties of a material by measuring the amount of light reflected by the surface of the sample. This technique is typically used to study the properties of thin films or surfaces, as it allows for the measurement of the optical properties of a material without the need for direct contact with the sample. The technique utilizes optical components (MIR mirrors and optomechanical components) to direct light onto the sample at a specific angle, and the reflected light is then analyzed to determine the material's properties.

Figure 1: Schematic illustration of QCL ATR setup showing the essential components of the technique.
Diffuse Reflectance (DR) and DRBS (Figure 2) are similar techniques in that both are used to study a material's properties by measuring the amount of light reflected by the surface of the sample. Still, there are some key differences between the two. DR is a technique that measures the amount of light scattered by a sample at a wide range of angles (Figure 3), and it is typically used to study the properties of powders, particulate materials, or other samples with a rough or irregular surface.
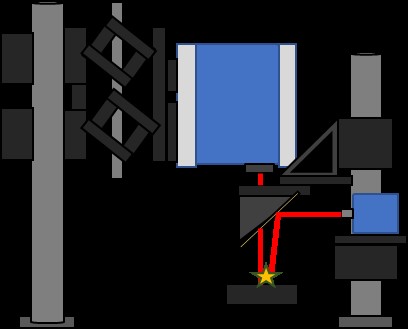
Figure 2: Illustration of the QCL Diffuse Reflectance Backscattering (DFBS) setup.
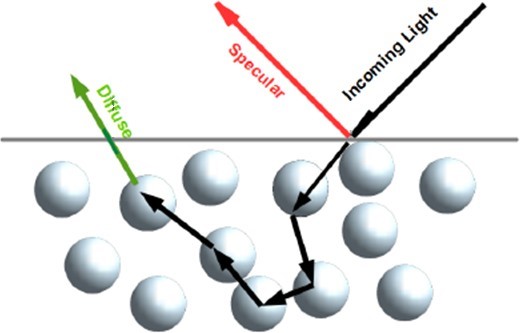
Figure 3: Representation of possible light scattering path in a powder sample.
The diffuse reflectance measurement allows for the study of the properties of the bulk material rather than just the surface properties. On the other hand, DRBS is a technique that measures both the diffuse reflectance and the backscattered light of a sample. The backscattered light is the light that is reflected by the source after hitting the sample. This technique is typically used to study the properties of powders, particulate materials, or other samples that have a rough or irregular surface. It is also used to study material properties that are not visible through traditional diffuse reflectance measurements. In summary, while Diffuse Reflectance and DRBS measure scattered light, the latter also measures backscattered light, providing additional information.
In this study, an analytical method using QCLS was developed. The aim was to compare two spectral acquisition modes: ATR and DRBS. The comparison aimed to identify low concentrations of Active Pharmaceutical Ingredients (APIs) in pharmaceutical blends. This analysis involved acquiring spectra using QCLS and utilizing MVA techniques to distinguish between different pharmaceutical blends.
ATR measures the amount of light that is reflected by the surface of a sample providing information mainly from the near-surface region of the sample, typically up to a few micrometers deep, at a single angle of incidence, meaning that ATR is more suitable for studying samples with relatively smooth surfaces, such as liquids, thin films, and solid materials with flat surfaces. DRBS measures the diffuse reflectance of a sample by scattering light onto the sample at a wide range of angles, providing information from the bulk of the sample and allowing for the study of the properties of the entire material. It also measures the backscattered light reflected to the source after hitting the sample. This means DRBS is more appropriate for studying samples with rough or irregular surfaces, such as powders, particulate materials, and materials with scattering properties.
Materials and Methods
Materials
The experimental study combined five typical pharmaceutical substances, including a common API and excipients. These mixtures comprised acetaminophen used as an API. Additionally, they contained mannitol (often used as API), Silicified Microcrystalline Cellulose (SMC), and croscarmellose sodium. These latter two substances functioned as fillers, as they do in the Pharma Industries. Finally, magnesium stearate (MgSt) was included as a lubricant. Table 1 provides information about the study's materials and the blend compositions. The blends were compressed to create round tablets approximately 10 mm in diameter and 3.5 mm thick. Each Tablet had a typical mass of ~320 mg. A total of 450 tablets were produced, 50 tablets per blend.
    Blend ID

    APAP

    Mannitol

    Prosolv (cellulose)

    Croscarmellose

    MgSt


    Blend 1 (B1)

    0.0

    15.37

    77.07

    6.56

    1.00


    Blend 2 (B2)

    0.1

    17.43

    79.47

    2.00

    1.00


    Blend 3 (B3)

    0.3

    12.91

    79.58

    6.20

    1.00


    Blend 4 (B4)

    0.5

    11.21

    81.31

    5.98

    1.00


    Blend 5 (B5)

    1.0

    14.09

    81.91

    2.00

    1.00


    Blend 6 (B6)

    1.5

    15.32

    76.36

    5.82

    1.00


    Blend 7 (B7)

    2.0

    11.70

    75.43

    9.87

    1.00


    Blend 8 (B8)

    2.5

    10.98

    83.52

    2.00

    1.00


    Blend 9 (B9)

    3.0

    18.39

    75.61

    2.00

    1.00
Table 1: Blend composition employed in experimentation (w/w %).
Instrumentation and Spectral Acquisition
The QCL used for the spectroscopic measurements was a pre-dispersive spectrometer (LaserTune™, Block Engineering, Southborough, MA, USA; BE) with a maximum peak power of 50 mW [10] and average power of 2-5 mW. It was externally coupled to a proprietary (BE), fast-response Mercury-Cadmium-Telluride (MCT) detector. The beam's spot size was 2x4mm2 (collimated output). The laser spectrometer settings were 10.88 μs pulse period, 440 ns pulse duration, 16 ns sample delay, and 424 ns sample width. The spectral range was 770–1850 cm-1 with a spectral resolution of 4 cm-1. For method development, method validation, and prediction analyses, all measurements used ten coadds, and the measurements were performed on both sides of the 450 tablets for an accurate representation of the full volume of the tablet. These measurements represent 900 spectra used, a good number for applying Multivariate Analysis (MVA). In addition, the tablets were compressed in a 35-ton (31.8 metric ton) hydraulic laboratory pellet press (X-Press 3635, Spex Sample Prep, Horiba Scientific, Edison, NJ, USA) using a total pressure of 8-ton and 13 mm pellet dies (Evacuable pellet Die 3619, CARVER Inc, Wabash, IN, USA).
MVA Data Analysis
This study aimed to explore the potential use of QCL spectrometers with different optical setups accompanied by chemometric MVA techniques to discriminate low concentrations of API in tablet formulations. Chemometric analyses were performed on the spectral data sets collected using the ATR and DRBS techniques, specifically utilizing Principal Component Analysis (PCA) with the Nonlinear Iterative Partial Least Squares (NIPALS) algorithm. Everything was performed using R Studio™ software. The spectra were subjected to a few mathematical pretreatments before PCA modeling, including Spectral Normalization, Standard Normal Variate (SNV), First Derivative (FD), and Second Derivative (SD). The order of the PCAs pretreatments performed to the ATR and DRBS data sets is summarized in Table 2.
No
Pretreatment
MVA
1
None
PCA
NIPALS Algorithm2
SNV
3
FD
PCA
4
SD
5
SNV + FD
6
SNV + SD
Table 2: PCAs performed on both ATR and DRBS data.
Results and Discussion
ATR Results
The ATR spectral data acquired was averaged and served as the principal comparison for our analyses. The average data spectra (Figure 4) provided a comprehensive overview of the spectral characteristics of the pharmaceutical blends.
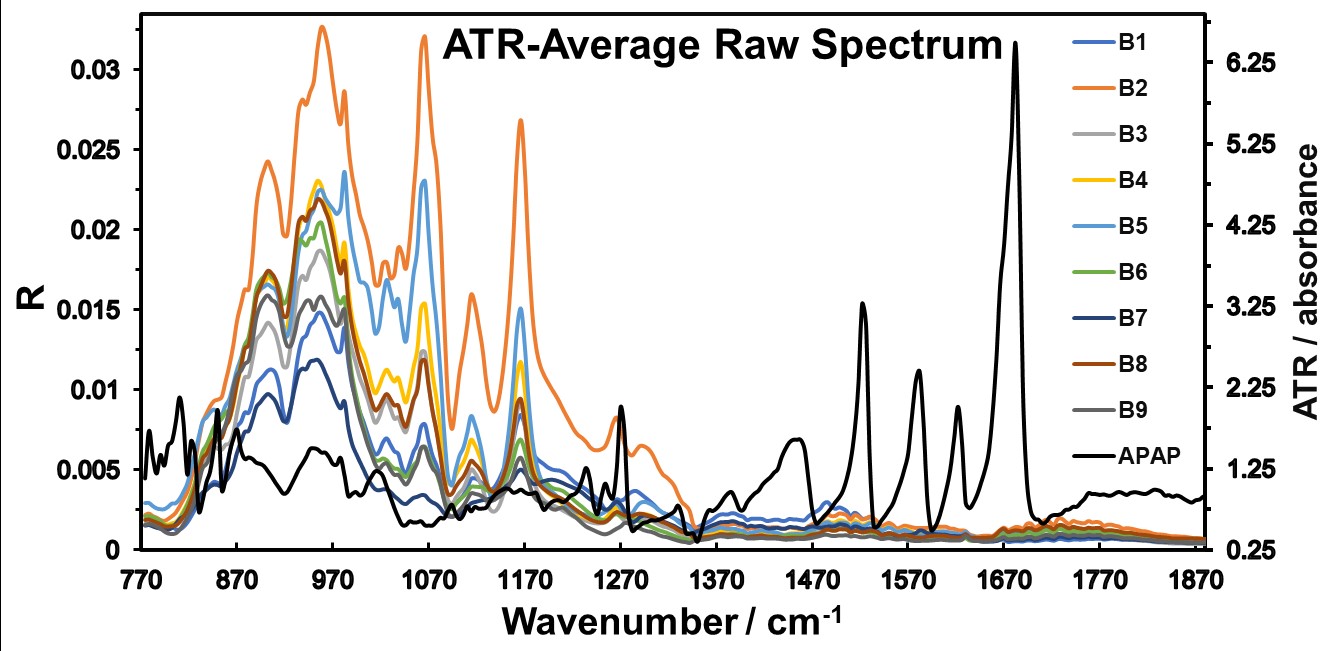
Figure 4: ATR Average Raw Data Spectrum acquired for each of the blends described in Table 1.
The first PCA was performed on the ATR raw data spectra (Figure 5). This PCA analysis was aimed to uncover inherent patterns and potential separations based on API concentrations. However, no distinct separation by concentration was observed, suggesting a complex relationship between the spectral features and the API concentrations.
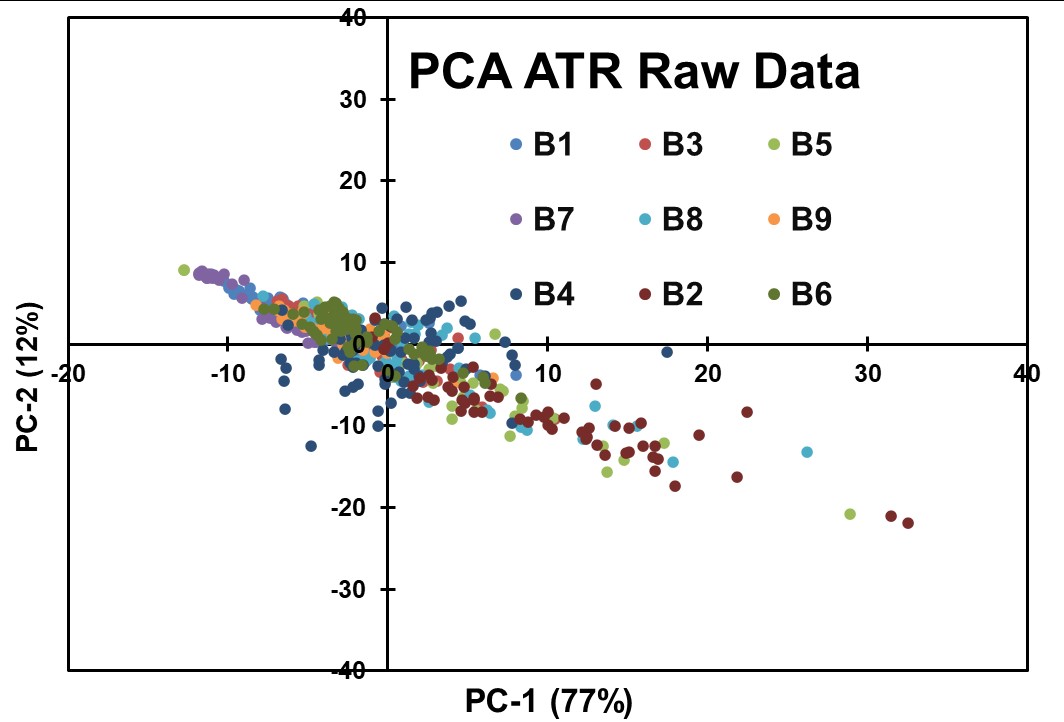
Figure 5: Results obtained for the first exploratory PCA modeling of the ATR Raw Data without data preprocessing.
To facilitate data comparison, Spectral Normalization using the Standard Normal Variate (SNV) algorithm was applied as data pretreatment in conjunction with PCA modeling (Figure 6). Despite this preprocessing step, the resulting PCA scores plot did not reveal significant separation among API concentrations. The spectral variations appeared to be influenced by factors other than concentration alone.
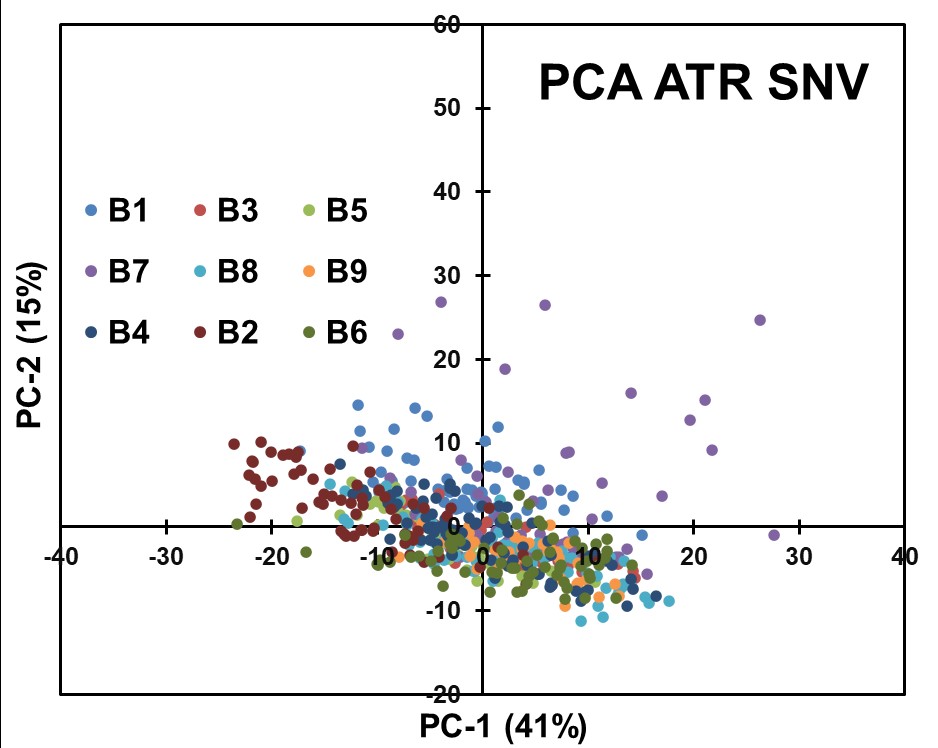
Figure 6: Results obtained for PCA analysis after preprocessing the ATR Raw Data with SNV.
To further explore subtle spectral changes, the ATR data underwent a derivative transformation in combination with SNV preprocessing, followed by PCA analysis (Figure 7). The First Derivative emphasized spectral features associated with API concentration variations. However, the PCA scores plot yielded no effective separation, indicating that this combination of preprocessing techniques did not adequately capture concentration-related spectral differences.
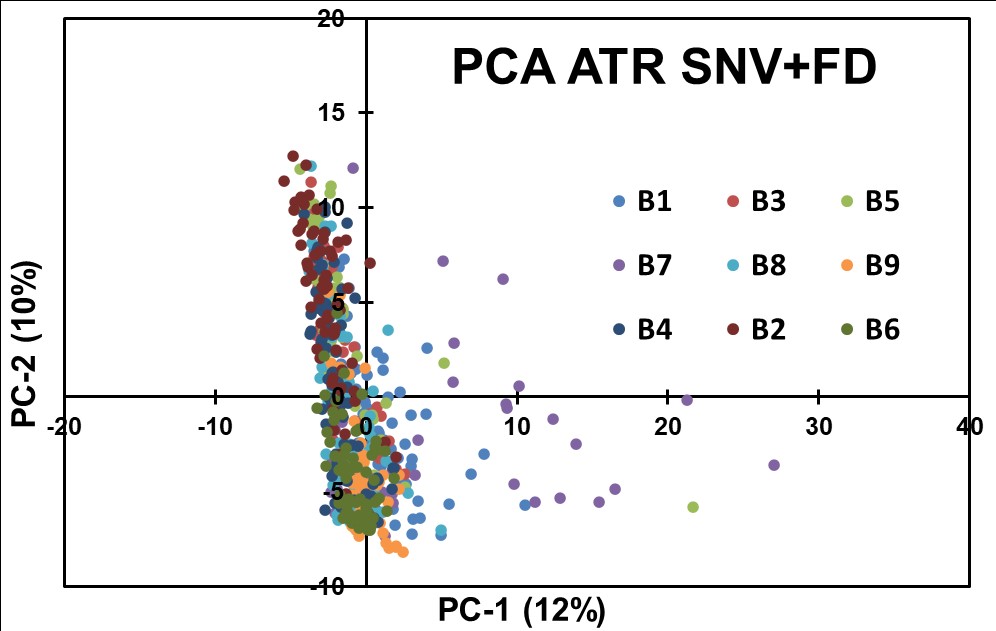
Figure 7: Results obtained for PCA modeling of ATR Data after applying SNV + FD preprocessing steps.
A Second Derivative (SD) transformation was applied to the ATR data after SNV preprocessing to extract additional spectral information (Figure 8). The SD transformation could highlight fine spectral details related to concentration variations. However, as with the previous modeling of the data, no effective separation based on API concentrations was observed in the resulting PCA scores plot.
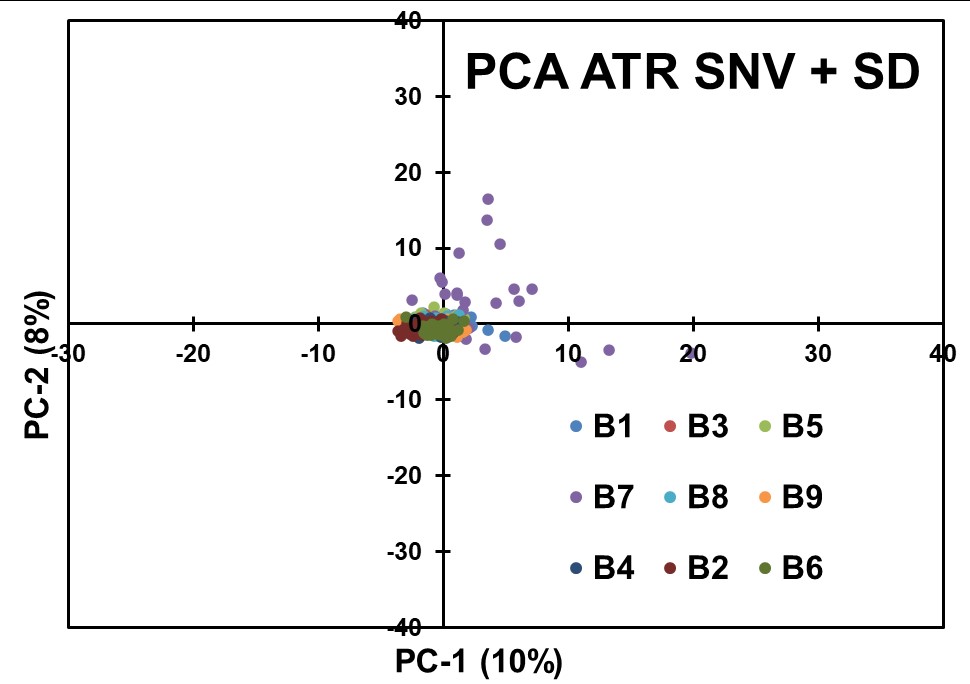
Figure 8: Results obtained for PCA modeling of the ATR Data after applying SNV + SD pretreatments.
The chemometric analyses conducted on the ATR spectral data, employing PCA and various preprocessing techniques, did not yield clear separations based on API concentrations. The data suggest that the concentration-related fluctuations in the ATR spectra may be too low and influenced by complex interactions and factors other than spectral characteristics. The results presented suggest that the QCL-ATR methodology, in its current form, may not be the most suitable approach for achieving content uniformity assessment in pharmaceutical blends.
DRBS Results
The DRBS spectral data examination of chemometric information resulted in a rough separation of the different concentrations. The preprocessing and chemometrics techniques used are the same for ATR data. The effectiveness of these techniques was evaluated based on their ability to separate different concentrations of APIs shown in Table 1 and offer content uniformity assessment. The DRBS spectral was averaged (Figure 9) without any other mathematical treatments, providing a comprehensive overview of the spectral characteristics of the pharmaceutical blends.
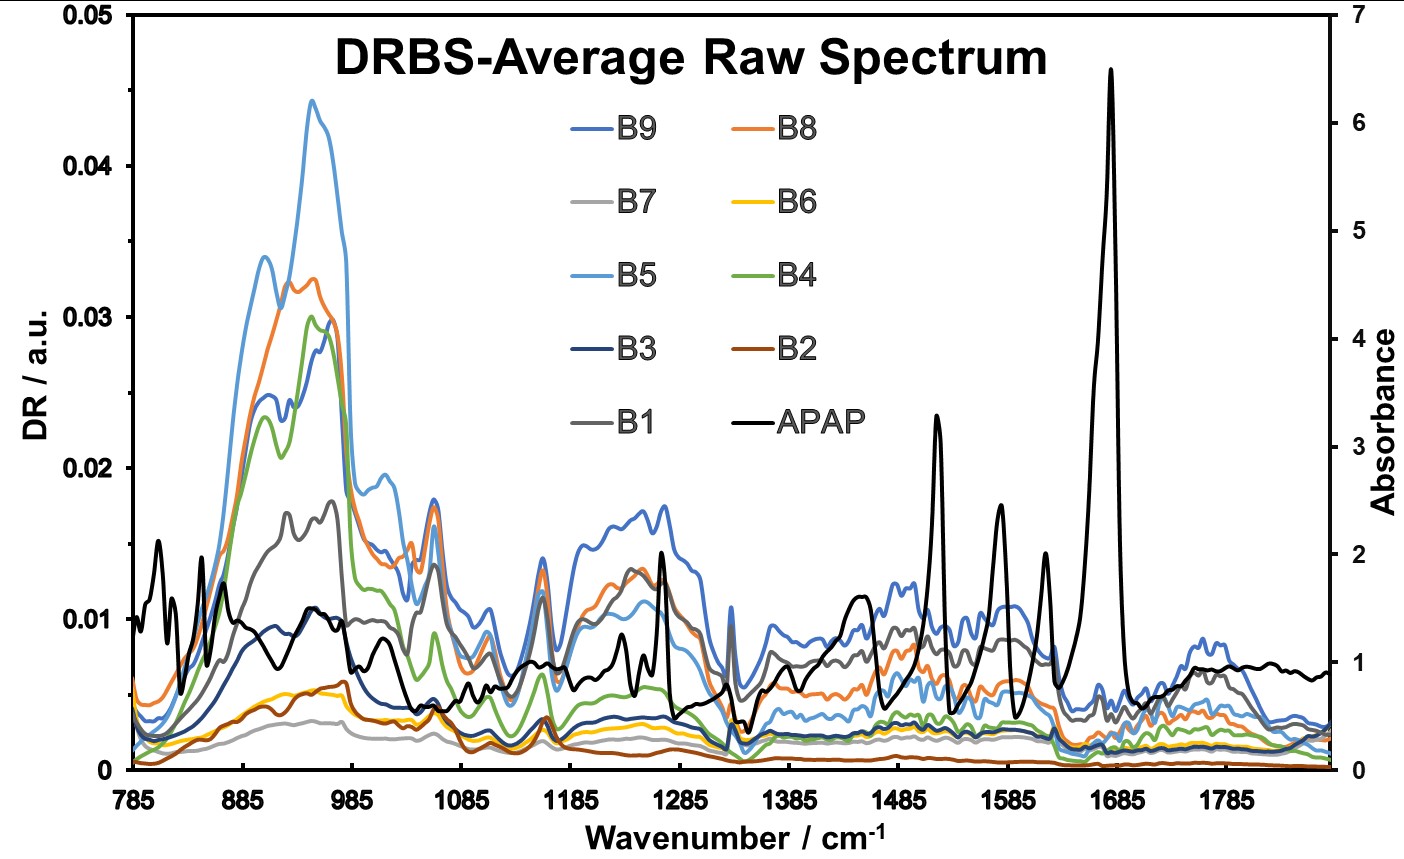
Figure 9: DRBS Average Raw Data Spectra obtained.
An initial exploratory PCA was conducted on the DRBS raw data spectrum and is shown in Figure 10. The PCA analysis was intended to identify inherent patterns and potential separations based on API concentrations. Interestingly, a noticeable separation was observed between samples with none, low, and high concentrations of APIs. However, the separation degree could not effectively distinguish blends with small (1% w/w) concentration differences.
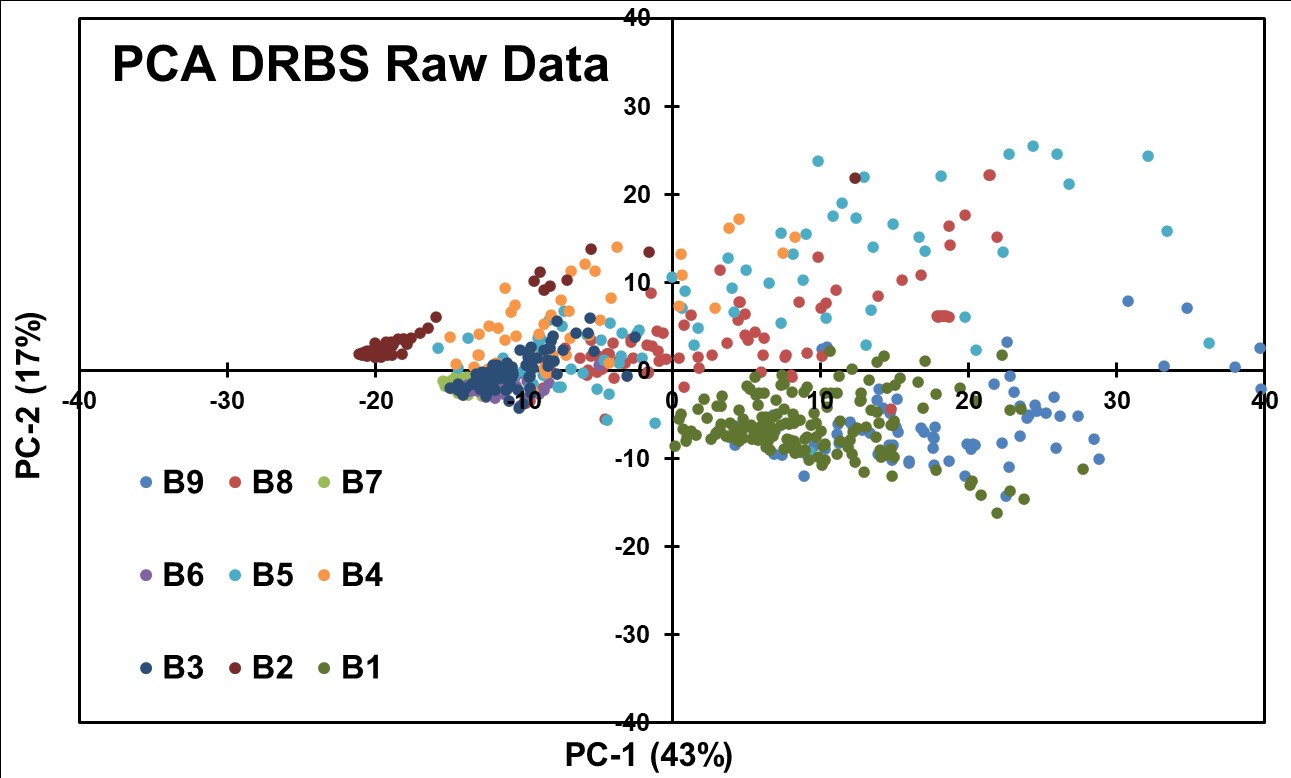
Figure 10: PCA was obtained for DRBS Raw Data without applying any preprocessing routines.
To enhance the spectral patterns and facilitate data comparison, spectral normalization using Standard Normal Variate (SNV) preprocessing algorithm was applied in conjunction with PCA modeling (Figure 11). However, this combination did not yield effective separation of blends based on API concentrations. The data from the PCA is more dispersed than the same PCA made on the ATR data, meaning that SNV is not a viable preprocessing for DRBS data.
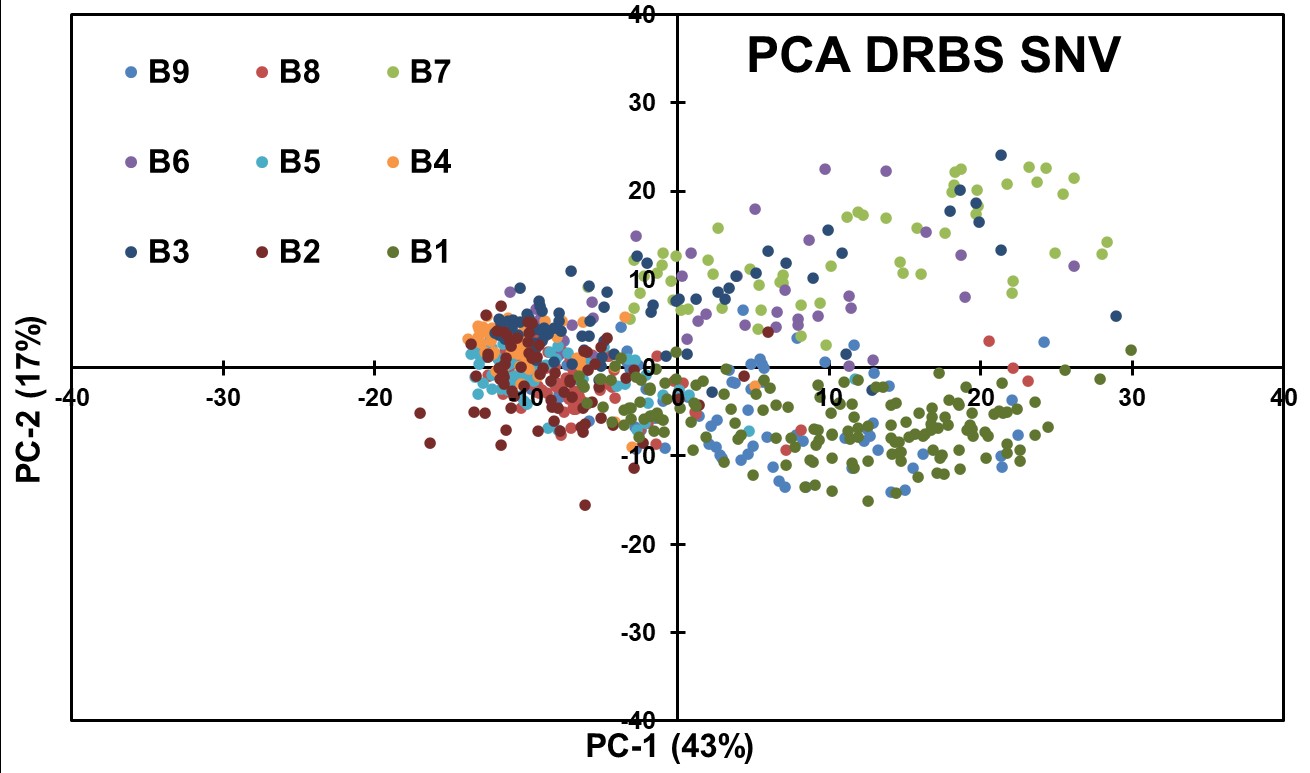
Figure 11: PCA obtained after applying SNV to DRBS Data.
Even with the results for SNV, to further explore concentration-related variations, the DRBS data underwent the First Derivative (FD) transformation after SNV preprocessing, followed by PCA analysis (Figure 12). The results revealed better segregation between different concentrations of APIs compared to the results of ATR, as seen in Figure 7, indicating successful clustering of blend groups. However, the achieved distance separation between some concentration clusters was not optimal.
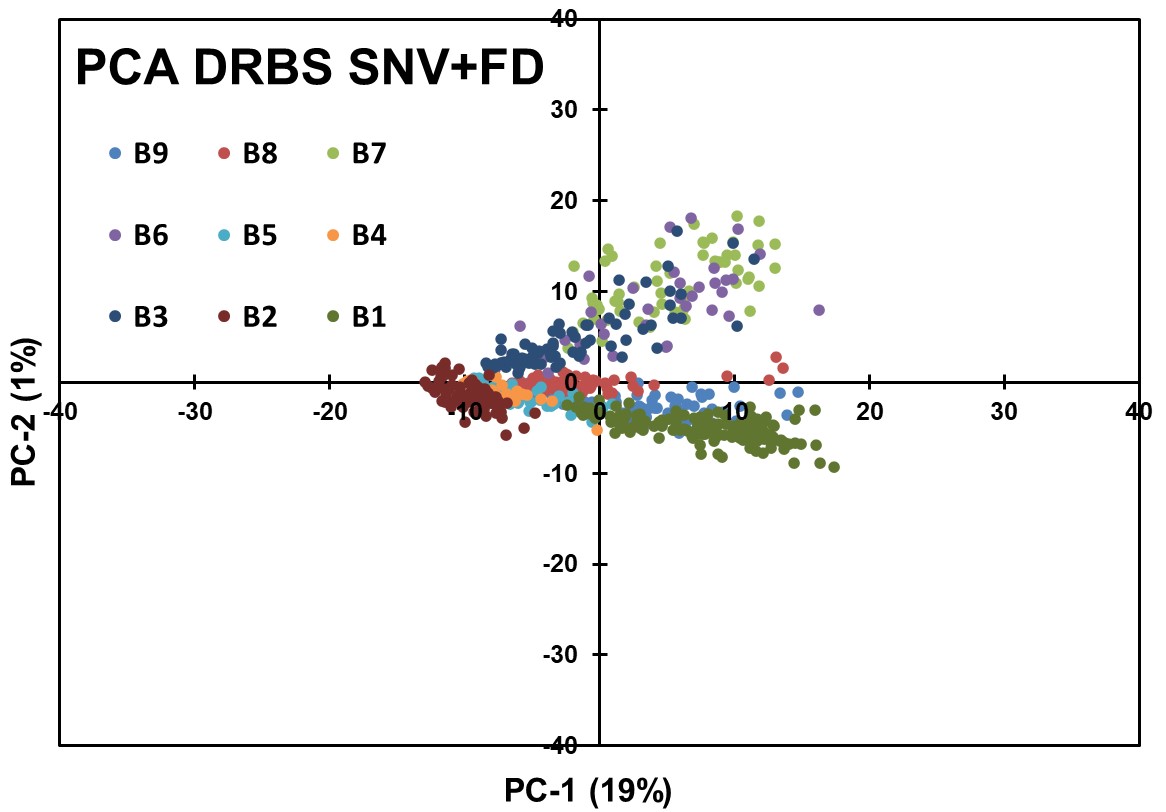
Figure 12: PCA for SNV + FD applied to DRBS Data.
Applying a Second Derivative (SD) transformation after SNV to the DRBS data did not result in an effective separation by API concentration. The results were comparable to the SNV + FD data analysis, indicating that the SD transformation did not provide significant additional information for concentration-based segregation.
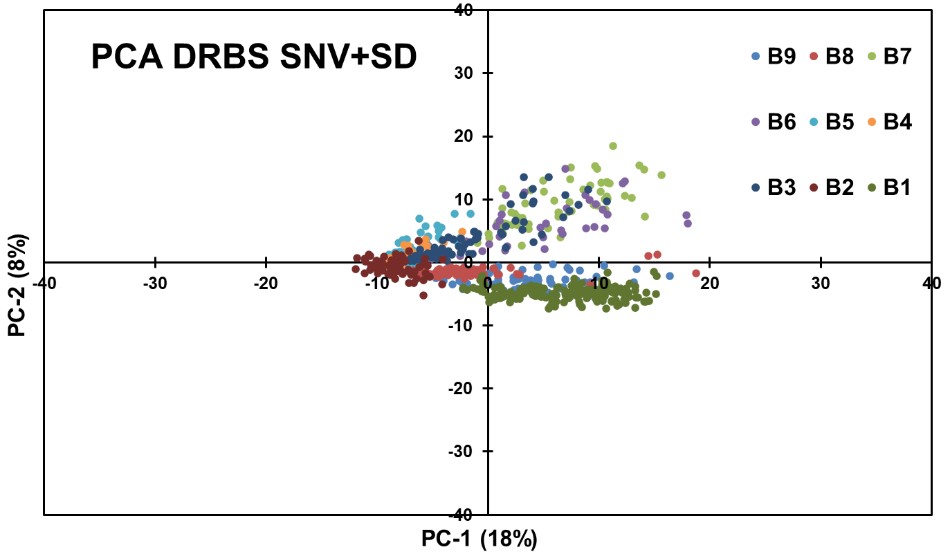
Figure 13: PCA obtained using SNV + SD applied to DRBS Data.
The best PCA results were the concentrations with more separation between clusters, which was performed to the DRBS technique's raw data. FD and SD were used directly to the raw data (Figure 14), resulting in an effective preprocessing before PCA analysis. The PCA obtained after applying SD has better discrimination of the data.
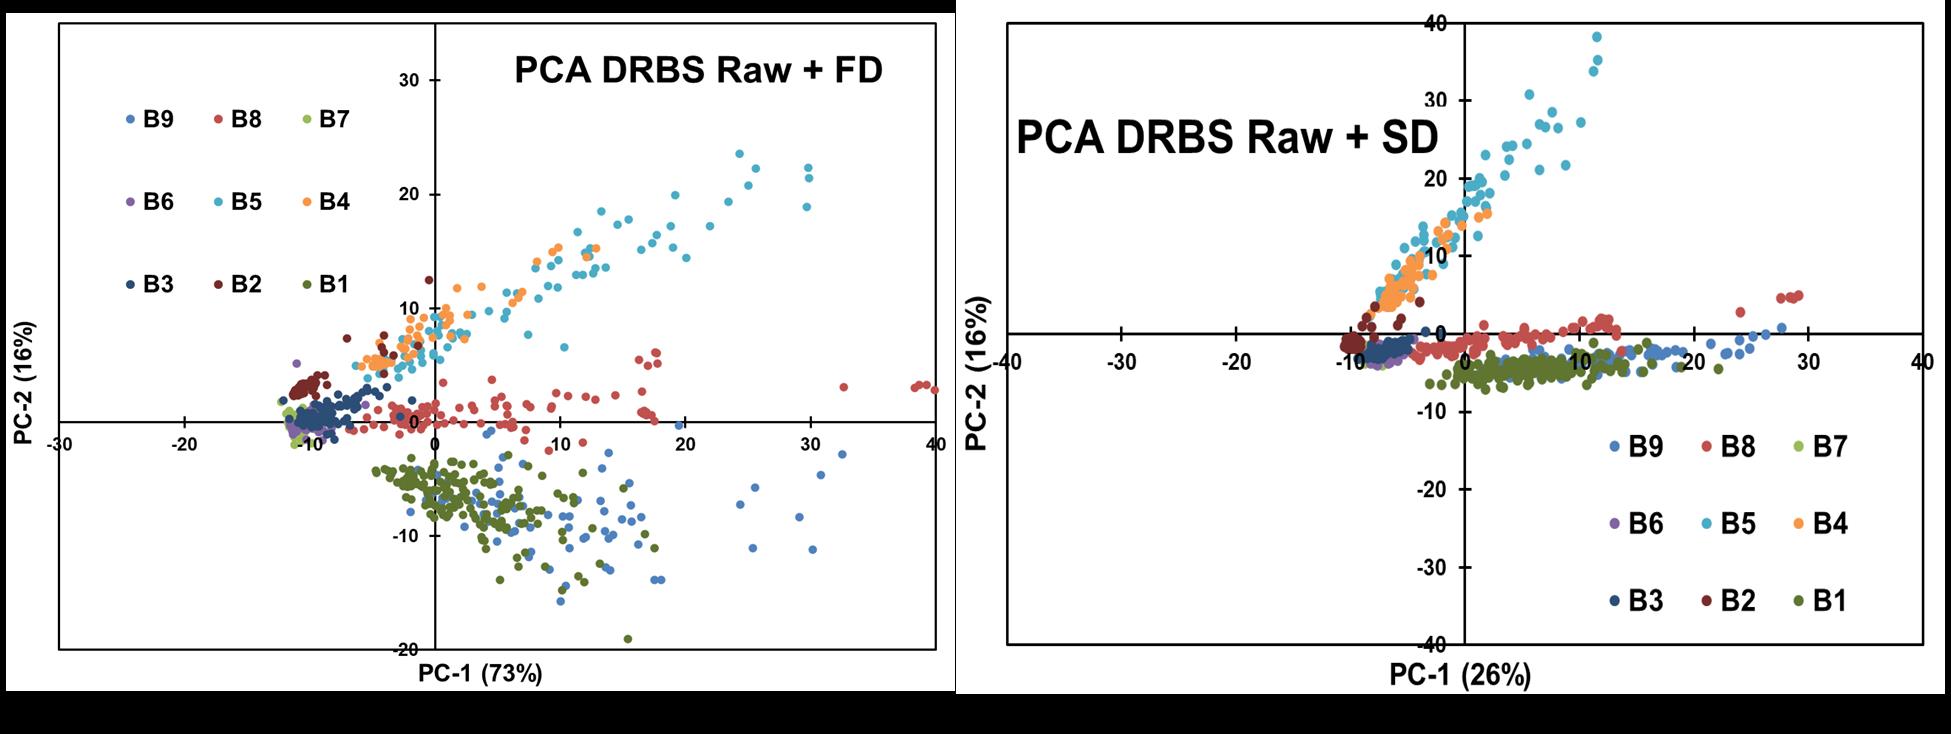
Figure 14: Comparison of FD and SD applied to Raw DRBS Data.
Making a comparison of different blends, B9-B6-B2 (Figure 15a), it can be observed that PC1 was able to perform a good separation between concentrations, although in PC2 is more difficult to see a separation. In the comparison of blends B2-B3-B4 (Figure 15b), 0.1-0.3-0.5 w/w %, respectively. A good separation was observed of B2 and B3 in PC1; in PC2, the discrimination is larger between B4 and B3-B2. As for concentrations B9-B8-B7 (Figure 15c), 3 well-defined clusters are observed but with B9 and B8 with more scattering in both axes.
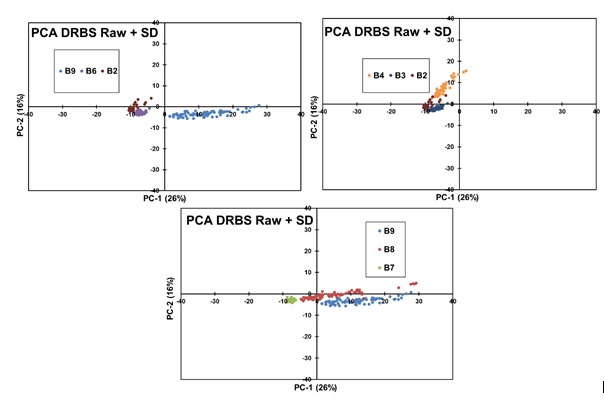
Figure 15: Comparison of PCAs applied to DRBS Data of various blends.
Conclusion
This proof-of-concept experiment and subsequent MVA modeling of the data in a PAT application was successful in providing valuable insights into using chemometric routines for characterizing and quantifying API concentrations in pharmaceutical blends, thus contributing to the knowledge and advancement of content uniformity assessment methodologies using QCL spectroscopy with ATR and DRBS setup. The main conclusion is that ATR, although better for other analyses, like liquid samples, for tablet analysis with QCLS, the DRBS-based methodology is more accurate for predicting the API content.
The DRBS technique still needs to be explored more in-depth since the scattered light not reaching the detector is still very high in this study due to the nature of the sample and the optical setup used. In future work, the distance between the sample and the detector must be explored, or a device to gather more signals would be a good addition to this technique. Furthermore, spectral features such as API concentration, excipient interactions, and particle size should be studied for future work to get more from the DRBS technique.
References
- Ropero J, Beach L, Alcalà M, Rentas R, Davé RN, Romañach RJ. Near-infrared spectroscopy for the in-line characterization of powder voiding part I: Development of the methodology. J Pharm Innov. 2009; 4: 187-97.
- Andrews D, Geentjens K, Igne B, McGeorge G, Owen A, Pedge N, et al. Analytical method development using transmission Raman spectroscopy for pharmaceutical assays and compliance with regulatory guidelines–Part I: Transmission Raman spectroscopy and method development. J Pharm Innov. 2018; 13: 121-32.
- Shimamura R, Koide T, Hisada H, Inoue M, Fukami T, Katori N, et al. Pharmaceutical quantification with univariate analysis using transmission Raman spectroscopy. Drug Dev Ind Pharm. 2019; 45: 1430-6.
- Szostak R, Mazurek S. Quantitative determination of acetylsalicylic acid and acetaminophen in tablets by FT-Raman spectroscopy. Analyst. 2002; 127: 144-8.
- Gómez DA, Coello J, Maspoch S. Raman spectroscopy for the analytical quality control of low-dose break-scored tablets. J Pharm Biomed Anal. 2016; 124: 207-15.
- Townshend N, Nordon A, Littlejohn D, Myrick M, Andrews J, Dallin P. Comparison of the determination of a low-concentration active ingredient in pharmaceutical tablets by backscatter and transmission Raman spectrometry. Anal Chem. 2012; 84: 4671-6.
- The infrared handbook. Vol. 1985 | Wolfe | Publications | Spie. rev ed. 2023.
- Galán-Freyle NJ, Pacheco-Londoño LC, Román-Ospino AD, Hernandez-Rivera SP. Applications of quantum cascade laser spectroscopy in the analysis of pharmaceutical formulations. Appl Spectrosc. 2016; 70: 1511-9.
- Pacheco-Londoño CL, Galán-Freyle NJ, Padilla-Jimenez AC, Castro-Suarez JR, AM Figueroa-Navedo, Ruiz-Caballero J, et al. Mid-Infrared Laser Spectroscopy Applications in Process Analytical Technology: Cleaning Validation, Microorganisms, and Active Pharmaceutical Ingredients in Formulations. Infrared Spectroscopy - Principles, Advances, and Applications. 2019.
- Childs DTD, Hogg RA, Revin DG, Rehman IU, Cockburn JW, Matcher SJ. Sensitivity advantage of QCL tunable-laser mid-infrared spectroscopy over FTIR spectroscopy. Appl Spectrosc Rev. 2015; 50: 822-39.
Citation: Plata-Enríquez JL, Puche-Mercado JF, Palmer-Velázquez S, Carrión-Roca W, Francheska M Colón-González, et al. Analytical Method Development Using Quantum Laser Cascade Spectroscopy with Diffuse and Attenuated Total Reflectance for Determining Low Concentrations of Active Pharmaceutical Ingredients. Austin J Anal Pharm Chem. 2023; 10(1):1157.