
Research Article
Austin J Anal Pharm Chem. 2023; 10(3): 1165.
Spectrophotometric Determination of Copper by using Erythromycin
Sherif A Kolkaila*; Gehan S Elasala; Alaa E Ali
Department of Chemistry, Faculty of Science, Damanhour University, Egypt
*Corresponding author: Sherif A Kolkaila Department of Chemistry, Faculty of Science, Damanhour University, Egypt. Tel: +201273769704 Email: sherifak@Sci.dmu.edu.eg
Received: November 13, 2023 Accepted: December 23, 2023 Published: December 30, 2023
Abstract
Copper (lI) forms a complex with erythromycin at pH 5 which leads to spectroscopic determination of erythromycin using (UV -Vis). Erythromycin-Copper (lI) complex was stabilized and measured at 404 nm while Beer’s law is valid for the concentration range of 2.5-30 μg.ml-1. Sandell’s sensitivity was 0.284738042 μg.cm-1, However the detection limit was 0.274576 μg.ml-1, and the limit of quantitation was 0.915255 μg.ml-1. Mole ratio method was applied with result (1:1 L:M ) Also Continuous Variation Method was applied.
Keywords: Antibiotic drug; Erythromycin; Erythromycin complex; Determination of copper
Introduction
Erythromycin is very active against Gram-positive and some Gram-negative microorganisms which is used for treatment of respiratory, gastrointestinal, and genital tract infections Figure 1. This work develops an easy method and environmental friendly by using Metal Complexation. A complex between a erythromycin and copper ion is used as a chemo sensing that the complexation leads to a change in colour or fluorescence [1-3]. Transition metal complexes often have spectacular colours caused by electronic transitions by the absorption of light [4,5]. Each wavelength of light has a particular energy associated with it and then the solution of the mixture show the colour of the light it absorbs A charge transfer band entails promotion of electrons from a metal-based orbital into an empty ligand-based orbital (Metal-to-Ligand Charge Transfer or MLCT). UV-Vis spectrometry for its simplicity, versatility, speed and cost-effectiveness. UV-Vis spectrophotometers for environmental monitoring receives much attention once again. The metal ion recognition system is based on the interaction/complexation of the various ligands with heavy metals to form highly coloured complexes. There is a wide choice in commercially available chromo-reagents for heavy metal ion sensing [6,7]. Heavy metals can form a strong coloured complex. The molar absorptivity (e, from Beer-Lambert’s Law), is the parameter to evaluate how strong the heavy metals-indicator complex absorbing light at the given wavelength is. It is the intrinsic property of the absorbing species [8,9]. In this work exploring a method for determination of Copper by using erythromycin.
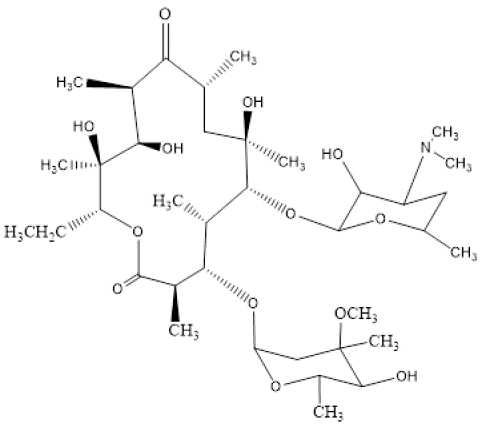
Figure 1: Erythromycin structure.
Apparatus
• UV-Visible recording spectrophotometer Shimadzu Model (160A) with a response time of 0.1s. A quartz cell of 5 ml internal volume and 1cm path length was used for absorbance measurements
• Hotplate Stirrer (Hotplate stirrer Model L-81Labinco bv)
• PH-meter (model BP 3001).
Materials
• A pure grade of erythromycin was obtained from Egyptian International Pharmaceutical Industries Company (EIPICO)
• Stocks solution were prepared from analytical grade BDH
• Preparation of Standard Solutions:All glassware used was cleaned with distilled water and dried at 50°C for 30 minute prior to use. Batch experiments were carried out in to ensure the reproducibility of results and the average value. Metal used were of the highest purity and most solutions were prepared in distill water.
• 250μgml-1Stock solution of erythromycin prepared by dissolving 0.025g from erythromycin(C37H 67NO13 ) in distilled water and diluting to the mark in 100ml volumetric flask.
• A solution of 500 ppm of Cu +2 was prepared by dissolving 2.1557 gm of CuCl2 in small amount of Water and complete the volume to 1000 ml by using volumetric flask.
Interference Solutions of 1000 ppm
1000 μg ml-1 stock solution of interferences is prepared by dissolving 0.1g of the different organic compound such as [Lactose, Starch, Arabic Gum, Glucose and Talc] and inorganic compound such as of Ca3(PO4)2and CaCO3 by 0.2579g and 0.2500g respectively in distilled water and diluting them to the mark in 100 ml volumetric flask.
Results and Discussion
Absorption Spectra
The absorption spectrum of the copper complex product formed was also recorded against the corresponding metal blank between 220 to 900 nm before obtaining optimum conditions show an absorbance at a wave length at 404nm. The molar absorpetivity value is 3.4308×10⁻⁴ L mol-1cm-1. The value of molar absorpitivity enables to carry out the quantitative analysis of Erthromycin .
Effect of pH: The maximum sensitivity was obtained at pH 5 to find the best acidic function at different value of pH 1-14 The results are shown in Figure 2, at pH =5 for Cu(II) show the value of absorbance intensity for the complexes ERY- Cu against the value of pH , the best values of pH recorded for the highest absorbance values were Plotting of the absorbance values versus the value of pH is shown in Figure 2.
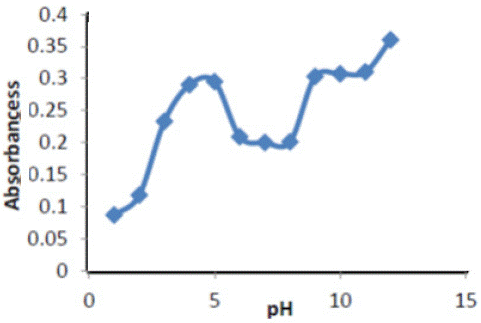
Figure 2: pH effect on absorbance of ( Ery-Cu II ) complex.
Effect of buffer solutions: The best values of buffer pH 5 recorded for the highest absorbance values were, The absorbance is measured the absorbance results are shown in Table 1.for complexes (Cu- Ery )
    Preparation buffer pH 5

    Absorbance


    Sodium citrate

    0.052


    Sodium acetate buffer solutions

    0.392
Table 1: effect of buffers pH 5 on absorbance.
Effect of Volumes buffer solutions: Figure 3 shows the value of absorbance intensity for the complexes Ery- Cu against the value of buffer solutions , the best value of Potassium chloride buffer solutions recorded for the highest absorbance values
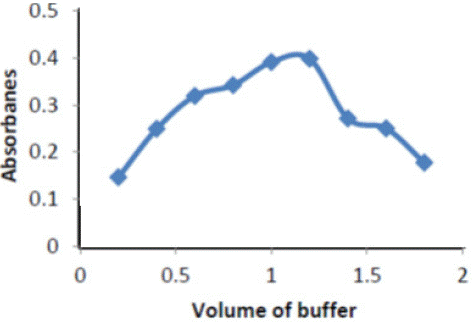
Figure 3: Buffer of pH effect on absorbance of ( Ery-Cu II ) complex
It is evident that absorbance increases with increase the volume of buffer, butsuddenly decrease the absorbance because the decomposition happen when increase basicity.
Effect of the Equilibration Temperature and Time
To optimize this method, it was necessary to examine the effect of the temperature on complex. Temperature that enhances higher range of (35 – 90)°C and (5 - 50 )min, respectively, while keeping all other parameters constant. Excellent absorbance was found at temperature 75°C as shown in Figure 4; therefore choose75°C higher than is probably due to the decomposition of the complex.
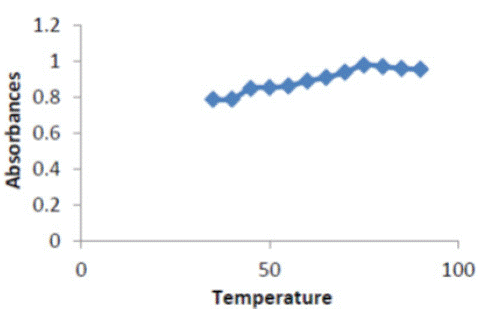
Figure 4: Effect of temperature on absorbance of (ERY-CU II) complex.
Time was investigated in the range of (5-50) min .Excellent absorbance found at 35min and was selected to fulfill efficient separation conditions Figure 5.
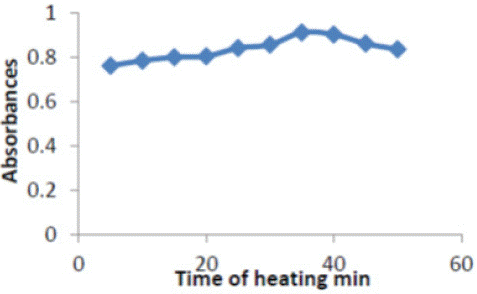
Figure 5: Effect of time on absorbance of (ERY-Cu II) complex.
Effect of Interference: The effect of some foreign compounds, which may found in environmental , were studied by adding 1ml of (100 μg ml-1) Equal amounts organic compounds, Inorganic compounds to 1ml of (100 μg ml-1) of complex . The color was developed following the recommended procedure described earlier Table 2.
    100ppm interference

    Absorbance at λmax =404    for Cu


    With out

    0.982


    Lactose

    0.056


    Starch

    0.232


    Arabic Gum

    0.094


    Talc

    0.046


    Glucose

    0.0001


    Ca3(PO4)2

    0.146


    CaCO3

    0.167
Table 2: Effect of Interference.
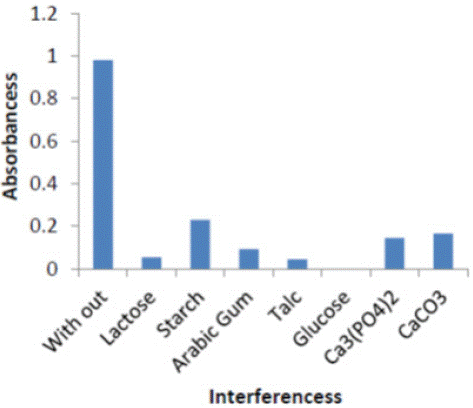
Figure 6: Effect of organic and inorganic Interferences on absorbance of (ERy-Cu II) complex.
Indicating interfering with the determination at levels found in complex form.
Selected Optimum Conditions: The optimum conditions for the proposed procedure were summarized in Table 3 and were used in all subsequent experiments.
    Optimum

    Concentrations

    Range selected

    Optimum quantities of complex ( ery-cu)


    λmax(nm    )

    ----

    220-1100

    404


    Effect of volume of metal ion required

    500 ppm

    0.05-0.55ml

    0.4


    Effect of PH

    0.1M(Na OH)

    14-Jan

    12


    Buffer pH


    ----


    Effect of volume of Buffer

    ----

    0.2-1.8ml

    1.2


    Effect of time heating

    ----

    5-50min

    35min


    ery solution required

    250 ppm

    0.1-1.2ml

    0.5
Table 3: The optimum conditions for the determination of ERY.
Calibration Graph
By applying the optimum conditions which described in the procedure liner calibration graph of Ery with Copper was obtained Figure 7, which show Beer law obeyed over the concentration range of 2.5-30μg ml-1with correlation coefficient equal to 0.9989.All other analytical characteristics data are summarized in Table 4.
    Recovery%

    Found

    RSD%

    Mean    Absorbance

    Conc.    ppm


    89

    2.2478

    0.151903

    0.465

    2.5


    96

    4.8326

    0.240513

    0.587

    5


    95

    7.1843

    0.101087

    0.698

    7.5


    99

    9.9597

    0.085245

    0.829

    10


    105

    13.1377

    0.288615

    0.979

    12.5


    101

    15.2563

    0.065503

    1.079

    15


    101

    17.8411

    0.058852

    1.201

    17.5


    101

    20.2563

    0.214926

    1.315

    20


    100

    22.5021

    0.248719

    1.421

    22.5


    99

    24.875

    0.092191

    1.533

    25


    99

    27.2478

    0.042998

    1.645

    27.5


    99

        29.8326

    0.199917

    1.767

    30
Table 4: The absorbance measurements of standard solutions of complex ( Ery-Cu).
    Parameter

    Complex ( ery-cu)


    Wave length λ max (nm)

    404nm


    Concentration rang (μg ml-1)

    2.5-30 μg ml-1


    Regression equation

    y =0.0472x +0.3589


    Correlation coefficient(r)

    0.9994


    Correlation coefficient (r2)

    0.9989


    Variation coefficient (%)

    99.89


    Limit of Detection (μg ml-1)

    0.274577 μg ml-1


    Limit of Quantitation (μg ml-1)

    0.915255 μg ml-1


    Sandell's sensitivity (μg cm-2)

    0.284738042


    Slope (m)

    0.0472


    Intercept (C)

    0.3589


    Molar absorptivity(L.mol-1.cm-1)

    2.5×10³


    Composition of product

    0.042361111


    C.L for slope (b±tSb) at 95 %

    0.0472±1.0858×10⁻³


    C.L for intercept (a±tSa) at 95 %

    0.3589±1.93298


    C.L for Conc. 5 μg ml-1at 95%

    0.587±4.9653×10⁻³


    C.L for Conc. 15 μg ml-1at 95%

    1.079±2.4826×10⁻³


    C.L for Conc. 25μg ml-1at 95%

    1.533±4.9653×10⁻³
Table 5: shows the main features of the calibration curve and measuring the absorbance at 404 nm.
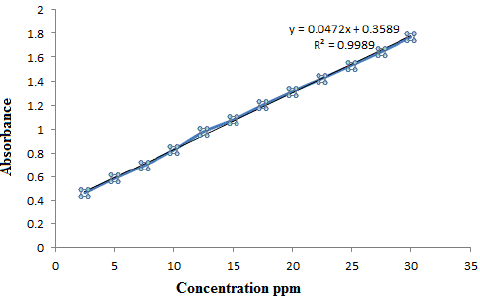
Figure 7: The calibration curve of (ERY-CU).
Optical Characteristics Features of the Calibration Curve
Stoichiometric Determination of Color complex:
Mole – Ratio Method
Aliquots of 10 mL solution containing (1×10⁻⁴) molL-1 of (1mL) Erythromycin and increasing concentrations (1×10⁻⁴) mol L-1 of (0.2, 0.4, 0.6, 0.8, 1.0, 1.2, 1.4, 1.6, 1.8,2 ) mL of ( Cu) Copper (2×10⁻⁶--2×10⁻⁵ )mol L-1 metal. The absorbance of the solutions were measured by UV-Vis spectrophotometer versus blank at λ max= 404 nm the stoichiometric ratio between 1:1 results are shown in the Table 6.
Absorbance
CL/CM
0.053
2×10⁻⁶
0.2
0.098
4×10⁻⁶
0.4
0.159
6×10⁻⁶
0.6
0.208
8 ×10⁻⁶
0.8
0.234
1 ×10⁻⁵
1.0
0.231
1.2 ×10⁻⁵
1.2
0.222
1.4×10⁻⁵
1.4
0.214
1.6 ×10⁻⁵
1.6
0.211
1.8×10⁻⁵
1.8
0.201
2×10⁻⁵
0.2
Table 6: molar ratio of ERy-Cu.
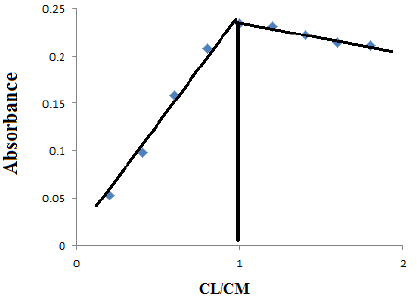
Figure 8: Molar ratio of Ery –copper complex.
Continuous Variation Method (Job`s method)
A series of (0.1, 0.2, 0.3, 0.4, 0.5, 0.6, 0.7,0. 8, 0.9) ml of (1×10 -4) mol L-1of the solution that contain erythromycin was pipette into each of 10 ml volumetric flask then (0.9,0.8,0.7,0.6,0.5,0.4,0.3,0.2,0.1) ml of (1× 10⁻⁴) mol L-1of metal the absorbance of the solution was measured by UV-Vis Spectrophotometer at λ max 404 nm the stoichiometric ratio between erythromycin with metal 1:1 results are shown in the Table 7 Plotting the value of absorbance versus the VD / VT is shown in Figure 9.
    Absorbance at λ= 404 for Color    complex

    VD / VT

    V M mL

    V D mL


    0.0245

    0.1

    0.9

    0.1


    0.078

    0.2

    0.8

    0.2


    0.14

    0.3

    0.7

    0.3


    0.187

    0.4

    0.6

    0.4


    0.262

    0.5

    0.5

    0.5


    0.209

    0.6

    0.4

    0.6


    0.175

    0.7

    0.3

    0.7


    0.111

    0.8

    0.2

    0.8


    0.056

    0.9

    0.1

    0.9


    VD: values of the compound (erythromycin)


      V M: The values of the metal ( copper ).


      VT:    Total (V M+V D)
Table 7: The continuous variation method of erythromycin with metal (copper) complex.
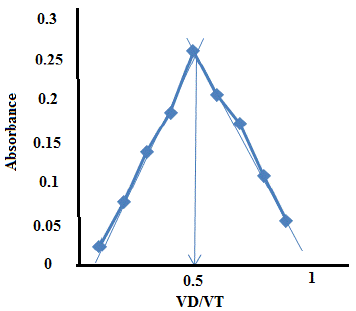
Figure 9: Continuous variation method plot.
Conclusion
Exploring a method for determination of copper ion by erythromycin is an easy, safe and Preconcentration of trace metals in aqueous solutions .The ligand was successfully to formed complex with the copper metal ion. Is a stable, sensitive and selective complexion successfully to determination Cu (II) in some Pharmaceuticals ,the method gives a very low limit of detection and good R.S.D.
References
- Ali AE, Elasala GS, Mohamed EA, Kolkaila SA. Spectral, thermal studies and biological activity of pyrazinamide complexes. Heliyon. 2019; 5: e02912.
- Masoud MS, Ali AE, Elasala GS. kolkaila SA. Spectrochim Acta. 2018; 193: 458-66.
- Masoud MS, Ali AE, Elasala GS. kolkaila SA. J Chem Pharm Res. 2017; 9: 171-9.
- Masoud MS, Ali AE, Elasala GS, sakr SF. kolkaila S.A. J Chem Pharm Res. 2020; 12: 29-41.
- Kokosa JM. Automation of liquid phase microextraction. U.S. Patent 7,178,414. 2007; B1.
- Ouyang G, Zhao W, Pawliszyn J. Automation and optimization of liquid-phase microextraction by gas chromatography. J Chromatogr A. 2007; 1138: 47-54.
- Lee J, Lee HK. Fully automated dynamic in-syringe liquid-phase microextraction and on-column derivatization of carbamate pesticides with gas chromatography/mass spectrometric analysis. Anal Chem. 2011; 83: 6856-61.
- Guo L, Lee HK. Automated dispersive liquid-liquid microextraction-gas chromatography-mass spectrometry. Anal Chem. 2014; 86: 3743-9.
- Kocúrová L, Balogh IS, Andruch V. Solvent microextraction: a review of recent efforts at automation. Microchem J. 2013; 110: 599-607.