
Research Article
Austin J Anal Pharm Chem. 2015;2(3): 1044.
Spectrophotometric Methods for Quantitative Determination of Binary Mixture of Naproxen Sodium and Domperidone Maleate
Lotfy HM1,2, Amer SM¹, Zaazaa HE¹ and Mostafa NS¹*
1¹Analytical Chemistry Department, Faculty of Pharmacy, Cairo University, Cairo, Egypt
2²Pharmaceutical Chemistry Department, Faculty of Pharmaceutical Science and Pharmaceutical Industries, Future University, Cairo, Egypt
*Corresponding author: Mostafa NS, Analytical Chemistry Department, Faculty of Pharmacy, Cairo University, Cairo, Egypt.
Received: April 29, 2015; Accepted: June 01, 2015; Published: June 03, 2015
Abstract
Simple, accurate, sensitive and precise UV spectrophotometric methods were developed and validated for quantitative determination of binary mixture of Naproxen sodium (NAP) and Domperidone maleate (DOM) in their bulk powder and pharmaceutical dosage forms. NAP was determined in presence of DOM by direct spectrophtometry at λmax 331 nm. Four spectrophotometric methods, namely; isoabsorptive point (I), ratio subtraction (II), ratio difference (III) and mean centering (IV) were developed for the spectral resolution of DOM when present in mixture with NAP without preliminary separation. In method (I), the isoabsorptive point (Aiso) at 274.7nm was chosen for determination of DOM while in method (II), DOM was determined at λmax 287 nm after subtraction of interference exerted by NAP. In method (III), absorption spectra of DOM were recorded, divided by suitable divisor of NAP then measuring the absorption difference at 280 and 294 nm to obtain the corresponding concentrations of DOM. In method (IV), absorption spectra of each drug were recorded, DOM spectra were divided by suitable divisor of NAP and the obtained ratio spectra were mean centered. The concentrations of DOM was then determined from the calibration graphs obtained by measuring amplitudes at 295nm. The developed methods were validated according to ICH guidelines demonstrating good accuracy and precision.
Keywords: Naproxen sodium; Domperidone maleate; Isoabsorptive point; Ratio subtraction; Ratio difference; Mean centering of ratio spectra; Spectrophotometry
Introduction
Naproxen (Figure 1a), (S)-2-(6-methoxynapthalen-2-yl) propionic acid is used as non steroidal anti-inflammatory drug (NSAID) commonly used for the reduction of pain, fever and inflammation caused by conditions such as osteoarthritis, rheumatoid arthritis and primary dysmenorrhea. It works by inhibiting both the COX-1 and COX-2 enzymes. It acts by inhibiting Prostaglandin (PGs) synthesis and their release at the site of injury and antagonizes prostaglandin actions [1].

    Figure 1:  Chemical structures of (a) Naproxen sodium, (b) Domperidone
maleate.
Domperidone (Figure 1b), 6-chloro-3-[1-[3-(2-oxo-3Hbenzimidazol- 1yl) propyl] piperidin-4-yl]] -1H-benzimidazol-2-one, is a dopamine antagonist which does not penetrate fully into the central nervous system. It stimulates gastro-intestinal motility and is used as an antiemetic for the short-term treatment of nausea and vomiting of various etiologies [2].
A new formulation containing Naproxen sodium (NAP) 250 mg and Domperidone maleate (DOM) 10 mg is commercially available in Indian market for treatment of osteoarthritis, rheumatoid arthritis and fever with reduction in gastro-intestinal problems that NSAIDs can cause.
Naproxen itself is rapidly and completely absorbed from the GI tract with an in vivo bioavailability of 95%. Although naproxen itself is well absorbed, the sodium salt form is more rapidly absorbed resulting in higher peak plasma levels for a given dose. Naproxen is extensively metabolized to 6-O-desmethyl naproxen and both parent and metabolites don’t induce metabolizing enzymes. Naproxen gives out O-Desmethylnaproxen by the action of cytochrome P450 2C9, cytochrome P450 2CB and cytochrome P450 1A2. Also gives out Naproxen O-glucuronide by the action of UDPglucuronosyltransferase 1-1 and UDP-glucuronosyltransferase 2B7.
Domperidone undergoes rapid and extensive hepatic metabolism by hydroxylation and N-dealkaylation. In vitro metabolism experiments with diagnostic inhibitors revealed that CYP3A4 is the major form of cytochrome P-450 involved in the N-dealkylation of domperidone, whereas CYP3A4, CYP1A2 and CYP2E1 are involved in domperidone aromatic hydroxylation.
The official method for determination of Naproxen is by acidbase titration and that for Domperidone is non aqueous titration using naphthalobenzine as an indicator [3]. Literatures are enriched with several methods for Naproxen determination such as UV spectrophotometeric methods [4–10], spectrofluorimetry [11,12], Colorimetry [13] , HPLC in pharmaceutical dosage form [14–19], HPLC using CD detector [20], HPTLC [21,22], potentiometry [23– 26], molecular imprinted polymerization for extraction from urine [27,28], and from pharmaceutical dosage forms [29].
For domperidone, literature reveals some UV spectrophotometric methods and UV through charge transfer complexation [30–33], voltametry [34], HPLC with fluorescence detection [35], redox method [36]. The method based on the reaction of imidazole group of the drug with a mixture ammonium metavanadate in polymeric micelllar medium at room temperature. It was observed that by oxidation of domperidone in the presence of polyvinylpyrrolidone (PVP) at first a pink red solution was obtained which becomes a purple solution after sometimes. The reaction is followed spectrophotometrically by measuring the decrease in absorbance 355 nm.
Some literatures reveal determination of NAP and DOM in combination including simultaneous equation spectrophotometric method [37], HPLC in pharmaceutical dosage form [38–43] and HPTLC [44].
This work aims to develop novel methods and apply recent, accurate and simple methods to resolve sever overlapping spectra in their mixture and pharmaceutical formulation, without preliminary separation steps. Subsequently, a comparative study was conducted between the proposed methods and the previously reported ones to confirm their effectiveness. The methods are simple, accurate, precise and do not necessitate any sophisticated apparatus or complicated software.
Experimental
Instruments
• A double beam UV-Visible spectrophotometer (SHIMADZU, Japan) model UV-1601 PC with quartz cell of 1 cm and UV-PC personal software version 3.7 was used. The spectral band width is 2 nm and wavelength-scanning speed 2800 nm/min. For MCR computations, Matlab 7 was used along with PLS toolbox.
• Sonicator, Bandelin-Sornex TK (Germany).
Materials
Authentic samples: Standard NAP was kindly supplied by Multi Apex Pharmaceuticals – Egypt , and standard DOM was kindly donated by Sigma Pharmaceuticals Industries (El Monofeya, Egypt) with claimed purities of 99.96% ±1.56 and 99.88± 0.97, respectively according to the Official methods [3].
Pharmaceutical dosage forms: Naxdom® tablets containing 250 mg Naproxen sodium and 10 mg Domperidone maleate were purchased from the Indian market.
Solvents: Methanol HPLC grade (CHROMASOLVE®, Sigma -Aldrich Chemie GmbH, Germany).
Standard solutions:
a. Standard stock solution of NAP and DOM were prepared in methanol in the concentration of 1 mg /mL.
b. Standard working solutions of NAP and DOM were prepared in methanol in the concentration of 0.2 mg /mL and 0.1 mg /mL, respectively.
Procedures
Linearity:
1) Isoabsorptive spectrophotometric method: Aliquots (0.5, 1, 2, 3, and 4 mL) of NAP and (1, 2, 4, 6, 8 mL) DOM equivalent to 100-800 μg were separately transferred from their respective standard working solutions (0.2 mg/ mL) and (0.1mg/mL); respectively into two separate series of 10-mL volumetric flasks and the volume was completed using methanol to obtain final concentrations ranges of 10-80 μg /mL. The zero order absorption spectra were recorded for both drugs using methanol as blank, then the absorbance was measured at 331 nm for NAP and 274.7 nm (Aiso) for NAP and DOM. Two calibration graphs were constructed for each drug relating the absorbance at the selected wavelength to the corresponding drug concentrations and the regression equations were computed.
2) Ratio subtraction spectrophotometric method: Aliquots (0. 6, 1, 2, 3, 4 and 5 mL) equivalent to 60–500μg from DOM working solution (0.1mg/mL) were transferred into a series of 10 mL volumetric flasks, completed to volume with methanol then the spectra of the prepared standard solutions were scanned. A calibration curve was constructed relating the absorbance of zero order spectra of DOM at λmax 287 nm to the corresponding concentrations and the regression equation was computed.
3) Ratio difference spectrophotometric method: Aliquots (0. 4, 1, 2, 3, 4 and 5 mL) equivalent to 40–500 μg from DOM working solution (0.1mg/mL) were transferred into a series of 10 mL volumetric flasks then completed to volume with methanol. The zero order absorption spectra of each solution were recorded then divided by the standard spectrum of 80 μg /mL of NAP as suitable divisor to obtain ratio spectra. Calibration curve was constructed relating the difference in absorbance of the resultant ratio spectra at 294 and 280 nm (ΔA= 294 – 280 nm) to the corresponding DOM concentrations and the regression equation was computed.
4) Mean centering of ratio spectra (MCR) method: Aliquots (0.4, 1, 2, 3, 4 and 5 mL) of DOM equivalent to 40-500 μg were accurately transferred from its standard working solution (0.1 mg/ mL) into a set of 10 mL measuring flasks and the volume was adjusted using methanol to obtain final concentration range of 4-50 μg/mL. The absorption spectra of the prepared solutions were recorded in the range of 250-310 nm and divided by the standard spectrum of 80 μg/mL of NAP to obtain the ratio spectra which were then mean centered.
Laboratory prepared mixtures:
1) Isoabsorpative spectrophotometric method: Accurate aliquots (1, 2, 3, 4, 5, 6, 7 and 8 mL) equivalent to (200 -1600 μg) and (0.4, 1, 2, 3, 4 and 5 mL) equivalent to (40 - 500 μg) of NAP and DOM; respectively were transferred from their working solutions into a series of 10 mL volumetric flasks, and volumes were completed to the mark with methanol and mixed well. Absorbance of each mixture was measured at 331 nm and 274.7nm Aiso). The total concentration of the two drugs and NAP alone were calculated respectively from their corresponding regression equations; then by subtraction of NAP concentration from the total mixture concentration, yielding the actual concentration of DOM in the mixture.
Different laboratory preparations of the combinations containing different ratios of (NAP and DOM) were mixed and the procedures under construction of calibration graphs for each method were followed. Concentrations of DOM In the prepared samples were calculated from the computed regression equations.
2) Ratio subtraction spectrophotometric method: The absorption spectra of the laboratory-prepared mixtures containing different ratios of NAP and DOM were scanned and recorded then divided by the standard spectrum of 80 μg /mL of NAP as suitable divisor to obtain ratio spectra and the absorbance in the plateau region (the constant) was subtracted. By multiplication of the obtained spectra by the spectrum of the divisor the original curves for direct determination of DOM at 287 nm were obtained and the concentration was calculated from the corresponding regression equation
3) Ratio difference (RD) spectrophotometric method: Laboratory-prepared mixtures were assayed by applying the procedure under linearity and the concentrations of each drug was calculated from the corresponding regression equation.
4) Mean centering of ratio spectra (MCR) spectrophotometric method: Laboratory-prepared mixtures were assayed by applying the procedure under linearity and the concentrations of each drug was calculated from the corresponding regression equation.
Analysis of pharmaceutical dosage forms: Ten tablets of Naxodom® tablets were powdered and mixed well after removal of the colored coat. Accurately weighed amount of the powdered tablets equivalent to 100 mg of DOM and NAP were transferred into 100 mL volumetric flasks. 50 mL methanol was added and ultrasonicated for 30 min, cooled and then the volume was completed to obtain (1 mg/ mL) stock solution. The solution was filtered and appropriate dilutions were then made to prepare a working solution (0.2 mg/ mL) and the procedures under linearity or laboratory prepared mixtures of each method were followed.
Validity of the methods was assessed by spiking the pharmaceutical dosage forms by known amounts of standard drug powders (standard addition technique). The recovery of the added standards was then calculated after applying the proposed methods.
Results and Discussion
The aim of this work is to develop simple spectrophotometric methods for the determination of binary mixture without previous separation. NAP can be determined by direct measurement of absorbance at 331nm, while DOM cannot be measured by convential measurements due to the interference exerted by NAP on the absorption spectra of DOM which hinders the determination of DOM in their mixture (Figure 2). In this work; four simple spectrophotometric methods; namely isoabsorptive, ratio subtraction , ratio difference and mean centering methods have been described for analysis of DOM in bulk powder and pharmaceutical dosage forms which have the advantage of no need to any sophisticated manipulation steps like other spectrophotometric methods, and less costly than published chromatographic methods.
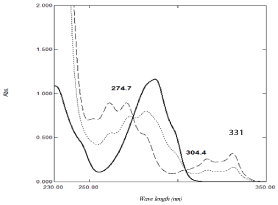
    Figure 2:  Zero order absorption spectra of 40 μg /mL of DOM ( ), 40 μg/ mL
of NAP (…...) and (1:1) mixture containing 20 μg/mL of each (-----) using
methanol as blank.
Isoabsorptive spectrophotometric method
The proposed method was developed by Erram and Tipnis [45] and is used for determination of DOM in presence of NAP in the presented work. At the isoabsorptive point the mixture of drugs acts as a single component and gives the same absorbance value as pure drug. Selection of suitable isoabsorptive point plays an important role with respect to selectivity and sensitivity; hence different isoabsorptive points were tried (as shown in Figure 2) but the best results regarding selectivity and sensitivity were obtained by using the isoabsorptive point at 274.7 nm Aiso). The total concentration of both drugs could be calculated at this isoabsorptive point, while the concentration of NAP in the mixture could be calculated, without any interference, at 331nm. Accordingly, the concentration of DOM could be calculated by difference. The advantage of this method is the simultaneous determination of both drug using the zero order absorption spectrum without any need to divisor with minimum manipulation steps.
Ratio subtraction spectrophotometric method
Following the theory of ratio subtraction [46]; NAP could be determined in presence of DOM in binary mixture. NAP has extended spectrum than DOM as shown in (Figure 2). Determination of DOM could be achieved by dividing the mixtures’ spectra containing DOM and NAP by suitable divisor of NAP (80 μg /mL) to produce a new ratio spectra as shown in (Figure 3a); then subtraction of the absorbance values of these constants in plateau as shown in (Figure 3b); followed by multiplication of the obtained spectra by the divisor as shown in (Figure 3c); then finally the original spectra of DOM which are used for direct determination of DOM at 287 nm could be obtained and the concentrations from regression equation could be calculated. The correct choice of the divisor is fundamental, as, if the concentration of the divisor increases or decreases, the resulting constant value will be proportionally decreased or increased [47]. The main advantage of this method that one of the drug could be determined at its maxima with optimum accuracy and precision.
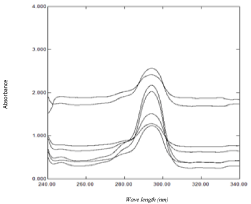
    Figure 3a:  Ratio spectra of laboratory prepared mixtures of NAP and DOM
using 80 μg /mL of NAP as a divisor and methanol as a blank.
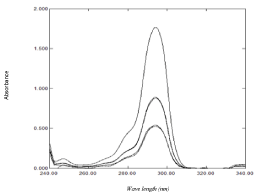
    Figure 3b:  Ratio spectra of laboratory prepared mixtures of NAP and DOM
using 80 μg /mL of NAP as a divisor and methanol as a blank after subtraction
of the constant.
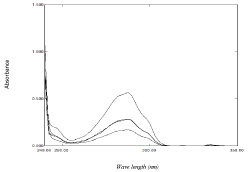
    Figure 3c:  The zero order absorption spectra of DOM obtained by the
proposed ratio subtraction method for the analysis of laboratory prepared
mixtures after multiplication by 80 μg/mL of NAP divisor.
Ratio difference spectrophotometric method
The amplitude difference between two points on the ratio spectra of a mixture is directly proportional to the concentration of the component of interest. It is affected by two critical steps; the first is the choice of the suitable divisor where the selected divisor should be compromise between minimal noise and maximum sensitivity. The second one is the choice of the wavelengths at which measurements are recorded. Any two wavelengths can be chosen provided that they exhibit different absorbance in the ratio spectrum and a good linearity is present at each wavelength individually [48]. The mathematical explanation of the method was illustrated by Lotfy et al.[49]. Accordingly, to optimize the method, different concentrations of NAP as divisors and wavelengths were tested, but the best result was obtained when using 80 μg/mL of NAP as a divisor and measuring absorbance difference between 294 and 280 nm (ΔA 294 – 280 nm) (Figure 4a). The main advantage of this method that the constant will be cancelled along with any other instrumental error without a needs of derivatization so enhance signal to noise ratio.
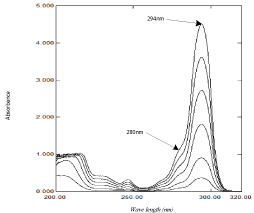
    Figure 4a:  Ratio spectra of (4-50) μg /mL DOM using 80 μg/ mL of NAP as
a divisor and methanol as a blank.
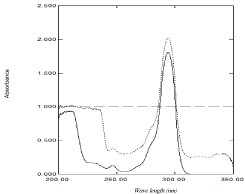
    Figure 4b:  Ratio spectra of 80 μg /mL NAP (-----) and 20 μg /mL DOM ( )
and (1:1) mixture containing 20 μg /ml of each (……) using 80 μg /mL NAP
as divisor.
Mean centering of ratio spectra (MCR) spectrophotometric method
The developed MCR method is based on the mean centering of ratio spectra; the mathematical explanation of the developed method was illustrated by Afkhami and Bahram [50]. This method was applied for resolving binary and ternary mixtures in the complex samples with unknown matrices [50]. In order to optimize the developed MCR method, different parameters were tested. Since the wavelength range taken has great effect on the obtained mean centering ratio spectra, different wavelength ranges were tested and the best results were obtained when using the wavelength range from (250-310 nm), also the effect of the divisor concentration on the selectivity of the method was checked by testing several concentrations of NAP, the best results regarding sensitivity and selectivity were obtained by using 80 μg/mL. Beer’s Lambert law was obeyed for DOM in the range of 4-50 μg/mL at 295 nm (Figure 5). The main advantage of this method that the constant will be cancelled along with any other instrumental error without needs of derivatization so enhance signal to noise ratio while its drawback is the need of special software in the mat lab.
The selectivity of the proposed methods was evaluated by analysis of different laboratory prepared mixtures containing different ratios of the suggested drugs, where satisfactory results were obtained, (Table 1).
    Parameters
    Direct determination of NAP at    331nm
    Isoabsorptive method at 274.7nm
    Ratio subtraction method
    Ratio difference method
    Mean centering


    Calibration range
    20-160µg/ml
    10-80µg/ml
    6-50µg/ml
    4-50µg/ml
    4-50µg/ml


    Slope
    0.008
    0.0186
    0.0291
    0.0672
    0.0639


    Intercept
    0.0093
    0.0104
    0.0023
    0.0056
    0.0045


    correlation coefficient
    0.9999
    1
    0.9999
    1
    1


    Accuracy (%) ±SD
    99.97±0.95
    100.2±0.88
    99.94 ±0.8
    99.75±0.52
    100.21±0.82


    Specificity (%) ±SD
    99.69±0.66
    99.79±0.8
    99.6±0.7
    99.57±0.79
    100.66±0.89


    Repeatability (RSD%)a*
    0.303
    0.612
    0.826
    0.635
    0.334


    Intermediate percision (RSD%)b*
    0.618
    1.052
    0.896
    0.598
    0.953


    LOD**
    1.72
    0.39
    0.425
    0.355
    0.267


    LOQ**
    5.2
    1.96
    1.288
    1.06
    0.8077


    *a. The    intraday precision (n=3), average of three different concentrations repeated    three times within day. *b. The interday precision (n=3), average of three    different concentrations repeated three times in three successive days.
        ** Limit of detection and quantitation are determined via    calculations LOD = (SD of the response/slope) × 3.3; LOQ = (SD of the    response/slope) × 10.
Table 1: Regression and validation parameters of the proposed methods for determination of DOM in presence of NAP.
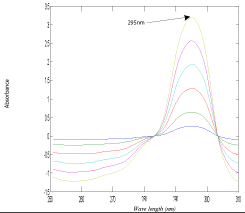
    Figure 5:  Mean centered ratio spectra of DOM (4-50) μg/mL using 80 μg/mL
of NAP as a divisor and methanol as solvent.
The developed spectrophotometric methods were successfully applied for the determination of NAP and DOM in Naxdom® tablets without interferences from tablets excipients and satisfactory results were obtained. The validity of the methods was further assessed by applying standard addition technique which also confirmed the accuracy of the proposed methods (Table 2). The results obtained by applying the proposed methods were statistically compared to the official methods [3] (Table 3) and the values of the calculated t and F are less than the tabulated ones, which reveals that there is no significant difference with respect to accuracy and precision between the proposed methods and the official one. Furthermore, statistical analysis of the results obtained by the proposed methods and official method were carried out using one way ANOVA at (P < 0.05). Calculated F-value was found to be less than tabulated F-value (Table 4). The test ascertains that the proposed methods are as precise and accurate as the official one [3] and are comparable to one another.
    Method
    Taken (μg /mL)
    Founda (%) ± SD
    Added (μg /mL)
    % Recoveryb
    Mean (%) ± SD


    Determination of NAP at 331 nm
    150*
    100.02± 0.96
    65
    100.84
    99.63± 1.16


    75
    99.5


    85
    98.54


    Isoabsorptive method
    6*
    99.79±0.68
    1
    101.6
    101.4±1.07


    1.5
    102.3


    3
    100.2


    Ratio subtraction method
    6
    100.36± 0.92
    6
    100.24
    99.85± 0.34


    8
    99.6


    10
    99.7


    Ratio difference method
    6
    99.5±0.76
    4
    100.13
    99.99± 0.29


    6
    100.3


    8
    99.98


    Mean centering
    6
    100.95±0.46
    4
    101.32
    100.13±0.44


    6
    100.5


    8
    101.17


    a: average of six experiments.
      b: average of three experiments.
        *Represent their ratio in the dosage form.
Table 2: Quantitative determination of NAP and DOM in Naxdom® tablets by the proposed methods and application of standard addition technique.
    Parameters
    NAP at 331nm
    DOM
    NAP
    DOM


    Isoabsorptive method at 274.7nm
    Ratio subtraction method
    Ratio difference method
    Mean centering
    Official method


    Mean
    99.52
    99.89
    100.44
    99.74
    100.2
    99.97
    99.88


    SD
    0.79
    0.85
    0.88
    0.59
    0.732
    1.56
    0.97


    n
    8
    5
    6
    6
    6
    5
    5


    Variance
    0.616
    0.714
    0.77
    0.35
    0.537
    2.43
    0.942


    t –test (tab.)
    2.2
    2.262
    2.228
    2.228
    2.228


    t -test (cal.)
    0.6
    0.174
    0.995
    0.14
    0.607


    F (tab.)
    4.12
    6.39
    5.1922
    5.1922
    5.1922


    F (cal.)
    3.94
    1.27
    1.22
    2.69
    1.754


    *Figures in    parentheses represent the corresponding tabulated of t and F at P = 0.05.
Table 3: Statistical analysis of the proposed methods and the official method for determination of NAP and DOM in their pure form.
    Source
    DF
    Sum of squares
    Mean square
    F value
    F crit


    NAP


    Between exp.
    1
    1.914
    1.914
    3.768
    4.844


    Within exp.
    11
    5.59
    0.508


    DOM


    Between exp.
    4
    1.912
    0.478
    0.737
    2.796


    Within exp.
    23
    14.911
    0.648


    At the 0.05 level.
      The    population means are not significantly different.
Table 4:  One way ANOVA testing for the different proposed and the Official
methods used for determination of Naproxen (NAP) and domperidone (DOM)
in their pure form.
Method Validation
Method validation of the proposed methods was performed according to ICH guidelines [51].
Linearity and range
The calibration ranges for NAP and DOM were established through considerations of the practical range necessary according to adherence to Beer-lambert’s law to give accurate, precise and linear results. Linearity ranges of NAP and DOM are shown in (Table 1).
Accuracy
Accuracy of the proposed methods was calculated as the percentage recoveries of blind pure samples of the studied drugs. The concentrations were calculated from the corresponding regression equations and the results are shown in (Table 1).
Precision
1) Repeatability. Three concentrations (40, 60 and 120μg /mL) of NAP and (10, 30 and 50μg/mL) DOM were analyzed three times intra-daily using the proposed methods. Good results and acceptable relative standard deviations (RSDs) were obtained, (Table 1).
2) Intermediate precision. The previous procedures were repeated inter-daily on three different days for the analysis of the selected concentrations. Good results and acceptable RSDs were obtained, (Table 1).
Specificity
Specificity of the proposed methods was assessed by the analysis of different synthetic laboratory prepared mixtures containing different ratios of NAP and DOM within their linearity ranges. Satisfactory results are obtained as shown in (Table 1).
LOD and LOQ
ICH recommendations [51] were followed to calculate the LOD and LOQ values of NAP and DOM. Low LOD and LOQ values indicate the high sensitivity of the proposed methods (Table 1).
Conclusion
The developed methods have advantages over the published methods in being simpler, rapid, and cost effective. Spectrophotometric methods can be regarded as a useful alternative to chromatographic techniques in the routine quality control analysis of pharmaceutical formulations allowing rapid determination at relatively low cost. The developed isoabsorptive, ratio subtraction and ratio difference spectrophotometric methods and mean centering were successfully applied for simultaneous determination of NAP and DOM in their combined marketed dosage forms. Furthermore, the proposed methods considered simple and accurate. Accordingly, they can be used in routine quality control analysis of NAP and DOM in pharmaceutical formulations.
References
- Analgesics. in: Wilson and Gisvod’s Textbook of Organic Medicinal and Pharmaceutical Chemistry. 8th ed : p. 800,802,804.
- R LJEF, Martindale. Royal Pharmaceutical Society of Great Britain, London, 1996; Part 1: 31.
- British Pharmacopoeia, Her Majesty’s Stationary Office, London, 2009.
- S.R. Dharmalingam, Srinivasan Ramamurthy, S.N. Kumarappan Chidambaram. Development and validation of UV Spectrophotometeric Method for the estimation of naproxen in bulk and semi-solid formulation. International Journal of Analytical, Pharmaceutical and Biomedical Sciences. 2013; 2: 49–55.
- IU Khan, T Aman, A Ashraf, AA Kazi. Spectrophotometric determination of naproxen in pure and pharmaceutical preparations. Analytical Letters. 1999; 32: 2035–2050.
- S Kulsum, M Padmalatha, K Sandeep, B Saptasila, G Vidyasagar. Spectrophotometric methods for the determination of naproxen sodium in Pure and pharmaceutical dosage Forms. International Journal of Research in Pharmaceutical and Biomedical Sciences. 2011; 2: 1303–1307.
- RK Maheshwari, S Lakkadwala, R Vyas, P Ghode. Spectrophotometric determination of naproxen tablets using niacinamide as hydrotropic solubilizing additive. Journal of Current Pharmaceutical Research. 2010; 04: 11–14.
- P Mehta, CS Sharma, D Nikam, MS Ranawat. Development and validation of stability indicating UV spectrophotometeric method for estimation of naproxen in pharmaceutical dosage form. Asian Journal of Biochemical and Pharmaceutical Research. 2012; 2: 291–303.
- CSP Sastry, AR Rao. Spectrophotometric determination of some analgesic and anti-inflammatory agents with 3-methyl-2-benzothiazolinone hydrazone hydrochloride. Mikrochimica Acta. 1989; 97: 237–244.
- V Wamorkar, P Santhosh, SY Manjunth. Validated spectroscopic method for estimation of naproxen from tablet formulation. Journal of Pharmacy Research. 2011; 4: 2633–2635.
- M Ahmadi, T Madrakian, A Afkhami. Enantioselective solid phase extraction prior to spectrofluorometric determination: a procedure for the determination of naproxen enantiomers in the presence of each other. RSC Adv. 2015; 5: 5450–5457.
- JF García-Reyes, P Ortega-Barrales, A Molina-Díaz. Multicommuted fluorometric multiparameter sensor for simultaneous determination of naproxen and salicylic acid in biological fluids. Analytical Sciences?: The International Journal of the Japan Society for Analytical Chemistry. 2007; 23: 423–428.
- SO Idowu, OA Adegoke, AO Adeniji, AA Olaniyi. Colorimetric assay of naproxen tablets by derivatization using 4-carboxyl-2, 6-dinitrobenzene diazonium ion. East and Central Journal of Pharmaceutical Sciences. 2009; 12: 8–14.
- SH Amrohi, M Nasare, PK K, T Kumar, G Nivedita, P V Diwan. Analytical method development and validation for the estimation of Naproxen using RP-HPLC. IOSR Journal of Pharmacy. 2012; 2: 19–24.
- AA Smith, K Jasim, K Varaprasad. Development and validation of a stability indicating RP-HPLC method for analysis of naproxen sodium. International Journal of Chemical Applications.2013; 2: 40–50.
- P Zakeri-Milani, M Barzegar-Jalali, H Tajerzadeh, Y Azarmi, H Valizadeh. Simultaneous determination of naproxen, ketoprofen and phenol red in samples from rat intestinal permeability studies: HPLC method development and validation. Journal of Pharmaceutical and Biomedical Analysis. 2005; 39: 624–630.
- MS Kaynak, S Sahin. A new Hplc approach for determination of in-vitro solubility of naproxen sodium. Hacettepe University Journal of the Faculty of Pharmacy. 2008; 28: 49–62.
- S Tanjin, F Islam, Z Sultan, A Rahman, S Reza, T Sharmin, et al. Development and validation of a simple RP-HPLC method for determination of naproxen in pharmaceutical dosage forms. Bangladesh Pharmaceutical Journal. 2013; 16: 137–141.
- P Mehta, CS Sharma, D Nikam, MS Ranawat. Development and validation of related substances method by HPLC for analysis of naproxen in naproxen tablet formulations. International Journal of Pharmaceutical Science and Drug Research. 2012; 4: 63–69.
- Jenkins AL, Hedgepeth WA. Analysis of chiral pharmaceuticals using HPLC with CD detection. Chirality. 2005; 17 Suppl: S24-29.
- KK & DGAP Ewa Wiatra. Validation thin layar Chromatography for the determination of naproxen in tablets and comparison with a pharmacopeal method. Journal of Liquid Chromatography & Related Technologies. 2011; 34: 829–847.
- PB Desphande, SV Gandhi, RA Mantri, KP Luniya, SU Dubey, SK Bharani. Validated Method Development for Estimation of Naproxen sodium as Bulk Drug and in Tablet Dosage Form by HPTLC. Eurasian Journal of Analytical Chemistry. 2012; 7: 1–6.
- N Adhoum, L Monser, M Toumi, K Boujlel. Determination of naproxen in pharmaceuticals by differential pulse voltammetry at a platinum electrode. Analytica Chimica Acta. 2003; 495: 69–75.
- GY Aguilar-Lira, GAÁ Romero, A Rojas-Hernández, ME Páez-Hernández, JA Rodríguez-Ávila, MA Romero-Romo. Voltammetric Analysis of Naproxen in Graphite Electrodes and Its Determination in Pharmaceutical Samples. Electroanalysis. 2014; 26: 1573–1581.
- P Norouzi, F Dousty, MR Ganjali, P Daneshgar. Dysprosium nanowire modified carbon paste electrode for the simultaneous determination of naproxen and paracetamol: Application in pharmaceutical formulation and biological fluid. International Journal of Electrochemical Science. 2009; 4: 1373–1386.
- AO Santini, JE de Oliveira, HR Pezza, L Pezza. A novel potentiometric naproxenate ion sensor immobilized in a graphite matrix for determination of naproxen in pharmaceutics. Microchemical Journal. 2006; 17: 785–791.
- T Madrakian, M Ahmadi, A Afkhami, M Soleimani. Selective solid-phase extraction of naproxen drug from human urine samples using molecularly imprinted polymer-coated magnetic multi-walled carbon nanotubes prior to its spectrofluorometric determination. The Analyst. 2013; 138: 4542–4549.
- Panahi HA, Feizbakhsh A, Khaledi S, Moniri E. Fabrication of new drug imprinting polymer beads for selective extraction of naproxen in human urine and pharmaceutical samples. Int J Pharm. 2013; 441: 776-780.
- Lian H, Hu Y, Li G. Novel metal ion-mediated complex imprinted membrane for selective recognition and direct determination of naproxen in pharmaceuticals by solid surface fluorescence. Talanta. 2013; 116: 460-467.
- Md Jakaria, A Hasanat, I Tarek. In vitro comparative degradation study of different brands of domperidone using UV Spectrophotometer. British Journal of Research. 2015; 2: 42–47.
- M Sasikala, K Sayanna, G Venkateshwarlu. Quantitative determination of drugs by using Chloramine-T and Methyl orange Couple: A spectrophotometric study. Asian Journal of Research in Chemistry. 2015; 8: 117–122.
- Amin AS, Ragab GH. Spectrophotometric methods for the determination of anti-emetic drugs in bulk and in pharmaceutical preparations. Anal Sci. 2003; 19: 747-751.
- OZ Devi, K Basavaiah. Simple and selective spectrophotometric methods for the determination of domperidone in pharmaceuticals through charge transfer complex formation reaction. Turk J. Pharm. Sci. 2012; 9: 27–40.
- Wahdan T, El-Ghany NA. "Determination of domperidone in tablet dosage form by anodic differential pulse voltammetry". Farmaco. 2005; 60: 830-833.
- Michaud V, Simard C, Turgeon J. An improved HPLC assay with fluorescence detection for the determination of domperidone and three major metabolites for application to in vitro drug metabolism studies. J Chromatogr B Analyt Technol Biomed Life Sci. 2007; 852: 611-616.
- N Nema, A Pandey. Determination of Domperidon in Polymeric Micellar Media by Redox Method. 2010; 2: 1066–1069.
- S Singh, S Sharma, AK Yadav, H Gautam. Simultaneous estimation of naproxen and domperidone using UV spectrophotometery in tablet dosage form. Bulletin of Pharmaceutical Research. 2013; 3: 66–70.
- S Mondal, A Haque, MS Islam, SMA Islam. Development and validation of RP-HPLC method for the simultaneous estimation of domperidone and naproxen in tablet dosage form. Journal of Applied Pharmaceutical Science. 2011; 01: 145–148.
- EC Sekhar, RS Kumar, MR Sankar, P Prasanthi. Simultaneous estimation of naproxen Sodium and domperidone maleate in bulk and pharmaceutical dosage form by modified RP-HPLC Method. International Journal of Pharmaceutical and Chemical Sciences. 2012; 1: 1615–1623.
- S M pawar, J D Fegade, RY Chaudhari. Validated RP-HPLC method for simultaneous quantitation of domperidone maleate and naproxen sodium in bulk drug and formulation. Der Pharmacia Letter. 2010; 2: 229–236.
- M Pandey, P Chawla, SA Saraf. Simultaneous estimation of sumatriptan succinate, naproxen and domperidone by reversed phase HPLC. Asian Journal of Pharmaceutical and Clinical Research. 2012; 5: 176-178.
- MK Joshi, S Kumar, YC Yadav, AK Seth. New analytical method development and validation of domperidone and naproxen in pharmaceutical formulation. International Journal of Drug Discovery and Medical Research. 2012; 1: 30–39.
- A Haque, M Shahriar, MN Parvin, SMA Islam. Validated RP-HPLC method for estimation of ranitidine hydrochloride , domperidone and naproxen in solid dosage form. Asian J. Pharm. Ana. 2011; 1: 59–63.
- SM Pawar, BS Patil, RY Patil. Validated HPTLC method for simultaneous quantitation of domperidone maleate and naproxen Sodium in bulk drug and formulation. Eurasian Journal of Analytical Chemistry. 2010; 5: 284–292.
- ESV and T HP. Simple spectrometric analysis of propranolol hydrochloride and hydrochlorothiazide from combined pharmaceutical dosages. Indian Drugs. 1994; 31: 65–80.
- HM Lotfy, HH Mounir, A Abd-Elaleem. Quantitative analysis of the cholesterol-lowering drugs ezetimibe and simvastatin in pure powder, binary mixtures, and a combined dosage form by spectrophotometry, chemometry, and high-performance column liquid chromatography. J AOAC Int. 2010; 93: 1844 – 1855.
- MF El-Bardicy, MG, Lotfy, HM, El Sayed, MA, et al. Smart stability-indicating spectrophotometric methods for determination of binary mixtures without prior separation. J AOAC Int. 2008; 91: 299–310.
- ES Elzanfaly, AS Saad, AB Abd-Elaleem. A smart simple spectrophotomertic method for simultaneous determination of binary mixtures. Journal of Pharmaceutical Analysis. 2012; 2: 382 – 385.
- HM Lotfy, HH Monir, AB Abd-Elaleem. Novel spectrophotometric methods for the determination of fluconazole in the presence of its oxidative degradation product. Journal of the Chilean Chemical Society. 2012; 57: 1447 – 1455.
- Afkhami A, Bahram M. Mean centering of ratio spectra as a new spectrophotometric method for the analysis of binary and ternary mixtures. Talanta. 2005; 66: 712-720.
- Peinado A, Hammond J, Scott A. Development, validation and transfer of a near infrared method to determine in-line the end point of a fluidised drying process for commercial production batches of an approved oral solid dose pharmaceutical product. J Pharm Biomed Anal. 2011; 54: 13-20.