
Research Article
Austin J Anal Pharm Chem. 2015;2(4): 1046.
Development and Validation of Analytical Method for Estimation of Leflunomide in Bulk and their Pharmaceutical Dosage Form
Patel SK¹*, Patel KH¹, Karkhanis VV² and Captain AD³
¹Department of Quality Assurance, AR College of Pharmacy and GH Patel Institute of Pharmacy, India
²Department of Pharmaceutical Chemistry, AR College of Pharmacy and GH Patel Institute of Pharmacy, India
³Department of Pharmaceutical Analysis, AR College of Pharmacy and GH Patel Institute of Pharmacy, India
*Corresponding author: Shraddha K Patel, Department of Quality Assurance, AR College of Pharmacy and GH Patel Institute of Pharmacy, India.
Received: April 30, 2015; Accepted: July 07, 2015; Published: July 09, 2015
Abstract
The analytical method was developed for estimation of Leflunomide in bulk and their pharmaceutical dosage form. Stability indicating HPTLC method was developed and validated. A simple and accurate High Performance Thin Layer Chromatography method was developed using aluminium sheet precoated with silica gel 60 F254 & mobile phase n-Hexane: Ethyl Acetate (7:3 v/v). The detection wavelength was 271 nm. The method was validated as per ICH guidelines. The linearity was found to be 75-450 ng/band. The correlation coefficient of calibration curve was found to be 0.9985. The method was found to be accurate, precise, specific and robust according to ICH guidelines. The limit of detection (LOD) for Leflunomide was found to be 3.604 ng/band and the limit of quantification (LOQ) for Leflunomide was found to be 10.923 ng/ band. The proposed HPTLC method was successfully applied for the forced degradation study of Leflunomide in bulk and tablet dosage form. Forced degradation study was carried out in acidic condition- 1N HCl at (80±2°C) for 3 hrs, in basic condition- 0.01 N NaOH at room temperature for 3 hrs, in oxidative condition- 6% w/v H2O2 at (60±2°C) for 1 hour, in thermal condition at 80°C for 24 hours and in photolytic condition for 24 hours in UV light. Degradation products were well separated by proposed HPTLC method and the method was found to be specific according to ICH guidelines. The developed method can be used in routine analysis for estimation and for stability study assessment of Leflunomide in Pharmaceutical dosage form.
Keywords: HPTLC; Leflunomide; Forced degradation; Validation
Abbreviation
API: Active Pharmaceutical Ingredient; AR: Analytical Reagent Grade; B.P: British Pharmacopoeia; CDSCO: Central Drug Standard Control Organization; DMARDS: Disease Modifying Antirheumatic Drug; HPLC: High Performance Liquid Chromatography; HPTLC: High Performance Thin Layer Chromatography; ICH: International Conference on Harmonization; I.P: Indian Pharmacopoeia; IUPAC: International Union of Pure & Applied Chemistry; LC: Liquid Chromatography; LOD: Limit Of Detection; LOQ: Limit Of Quantification; MS: Mass Spectrometry; Rf: Retention Factor; RPC: Reverse Phase Chromatography; RSD: Relative Standard Deviation; SD: Standard Deviation; UPLC: Ultra Performance Liquid Chromatoraphy; UV: Ultra Violet; U.S.P: United States Pharmacopoeia; USFDA: United States Food and Drug Administration.
Introduction
Leflunomide is chemically 5-methyl-N-(4-(trifluromethylphenyl)- 4-isoxazolecarboxamide has empirical formula C12H9F3N2O2 with molecular weight 270.21 (g/mol) (Figure 1) [1,2,3]. Leflunomide is a pyrimidine synthesis inhibitor belonging to the DMARD (diseasemodifying antirheumatic drug) class of drugs, which are chemically and pharmacologically very heterogeneous. Leflunomide was first approved by FDA for treatment of active rheumatoid arthritis on 11 September, 1998. Leflunomide was approved by CDSCO on 1st October, 2001. Leflunomide is one of the new drugs used in the treatment of rheumatoid arthritis. It works by suppressing the immune system because rheumatoid arthritis is caused by damage from an overacting immune system [5]. After oral doses Leflunomide undergoes first-pass metabolism to teriflunomide, which is responsible for the majority of the in vivo activity. The bioavailability of Leflunomide after oral doses ranges from 82 to 95%. Peak plasma concentrations of the active metabolite may occur from 1 to 24 hours after a dose. About 43% of a dose is eliminated in the urine, mainly as tablets. This research article reports a precise, accurate and sensitive HPTLC method with UV detection, useful for routine quality control of Leflunomide and its degradation products in solid oral formulation. The method was validated by parameters such as linearity, accuracy, precision and robustness. Leflunomide is official in IP-2014, BP-2010 and USP-2011. Literature review reveals that the methods like HPLC, UV-Spectroscopic, LC-MS/MS, RP-HPLC, and UPLC have been reported for estimation of Leflunomide in bulk and tablet dosage form. But, HPTLC method has not been reported for estimation of Leflunomide. So, aim of dissertation work is to develop and validate precise and accurate HPTLC method. HPTLC method is widely used for routine drug analysis. Less amount of mobile phase is required which is one of the advantages of this method. Solvents need no prior treatment like filtration and degassing. High sample throughout of similar or different nature of samples. Low cost precoated HPTLC plates are available. Hence, this method is more economic and lower analysis time as compare to reported HPLC methods [7]. Our work deals with the forced degradation of Leflunomide under stress condition like acid hydrolysis, base hydrolysis, and oxidation, thermal and photolytic stress. The developed method is useful for routine quality control analysis and determination of stability.
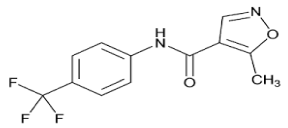
Figure 1: Chemical structure of Leflunomide.
Experimental
HPTLC method development
Instruments: A Camag HPTLC System (Switzerland) HPTLC instrument consists of CAMAG (Muttenz, Switzerland) Linomat V sample applicator with 100μL applicator syringe (Hamilton, Bonadauz, Switzerland). Chromatography was performed on 10 cm × 10 cm aluminum TLC plates precoated with silica gel 60- F254 (E. Merck, Darmstadt, Germany). CAMAG TLC scanner 3 was used for the densitometric scanning of the developed chromatogram. All drugs and chemicals were weighed on Shimadzu electronic balance (AX 200, Shimadzu Corp., and Japan). Detection by UV cabinet with dual wavelength UV lamp (254 nm & 366 nm) and data analysis by Camag win-CATS software.
Chemicals and Reagents: Standard Leflunomide was obtained as gift sample by Alembic Pharmaceuticals Limited, Vadodara, India. The marketed formulation LEFRA-10 tablets (Each film coated tablet contains Leflunomide I.P. 10 mg) manufactured by Torrent pharmaceuticals Limited was procured from local market. Methanol was obtained from Allied Chemicals Corporation, Vadodara. Ethyl acetate and n-Hexane were obtained from Chemdyes Corporation, Vadodara.
Chromatographic system
Sample application: Standard and formulation sample of Leflunomide were applied on the HPTLC plates in the form of narrow bands of 6 mm length. The bands were applied 10 mm above from the bottom and 15 mm away from left edge of the plate. Samples were applied under a continuous drying stream of nitrogen gas.
Mobile phase and development: Plate was developed using a mobile phase consisting of n-Hexane: Ethyl Acetate (7:3 v/v). Linear ascending development was carried out in a twin-trough glass chamber equilibrated with the mobile phase vapors for 20 min. Mobile phase (10 ml) was used for development and allowed to migrate at up to 70 mm. After development, the HPTLC plate was air dried completely.
Densitometric analysis: Densitometric scanning was performed in the absorbance mode under control by win CATS planar chromatography software (CAMAG, Muttenz, Switzerland). The source of radiation was the deuterium lamp and bands were scanned at 271 nm. The slit dimensions were 6 mm length and 0.45 mm width, with a scanning rate of 10 mm/s. Concentration of the compound was determined from the intensity of diffusely reflected light and evaluated as peak areas against concentrations using a linear regression equation.
Preparation of standard stock solution: 10 mg of Standard Leflunomide was weighed and transferred to a 10 ml volumetric flask and dissolved in methanol. The volume was made up to the mark with methanol to yield a solution containing 1000 μg /ml of Leflunomide. An aliquot of 0.25 ml was transferred into 10 ml volumetric flask and volume was made up to the mark with methanol to give a solution containing 25μg/ml Leflunomide.
Test preparation: Total 20 tablets of LEFRA brand containing API as Leflunomide were taken. They were individually weighed. Then average weight of 20 tablets was taken. The tablets were crushed and powdered. The quantity of tablet powder equivalent to 10 mg of Leflunomide was taken and transferred into 10 ml of volumetric flask and dissolved in methanol and volume was made up to the mark. The solution was filtered with whatman filter paper (0.45μm). From this solution 0.25 ml volume was transferred into 10 ml volumetric flask and diluted to mark with methanol to obtain working Standard solution (25μg/ml).
Method validation [8,9]
Validation of the developed HPTLC method was carried out according to the International Conference on Harmonization (ICH) guidelines Q2 (R1) [10].
Specificity: Specificity of the method was ascertained by analysing standard drug and sample. The mobile phase resolved the drug very efficiently. The spot for Leflunomide was confirmed by comparing the Rf and spectra of the spot with that of standard. The wavelength 271 nm for detecting peak purity of Leflunomide was assessed by comparing the spectra at three different levels, i.e, Peak start (s), Peak apex (M), and Peak end (E) Position of the band.
Forced degradation study [10]
Procedure for stress degradation in acidic condition for API: An accurately weighed 50 mg of Leflunomide was dissolved and diluted upto 10 ml with methanol. From this stock solution 2.5 ml of solution was refluxed at (80ºC±2°C) with 20 ml of 1N HCl for 3 hour in 250 ml round bottom flask. Then, solution was neutralized with 1 N NaOH solution to avoid further degradation. Then solution was diluted upto 50 ml with methanol. From this solution 1 ml of solution was diluted upto 10 ml with methanol. From resulting solution 6μl (150 ng/band of Leflunomide) was applied and chromatogram was recorded at the 271 nm and the amount of the drug and acid degradation products were calculated.
For Tablet sample: An accurately weighed quantity of tablet powder equivalent to 50 mg of Leflunomide was dissolved and diluted upto 10 ml with methanol and sonicated for about 10 mins with occasional shaking. From this stock solution 2.5 ml of solution was refluxed at (80ºC±2°C) with 20 ml of 1N HCl for 3 hour in 250 ml round bottom flask. After exposure to degradation condition, it was neutralised with 1 N NaOH and make up the volume 50 ml with methanol. The solution was filtered with 0.45μ filter discarding the first 5 ml of solution. From this stock solution, 1 ml of solution was diluted upto 10 ml with methanol. From resulting solution 6μl (150 ng/band for Leflunomide) was applied to TLC plates and the chromatogram was run under the optimized chromatographic conditions.
Procedure for stress degradation in basic condition
For API: An accurately weighed 50 mg of Leflunomide was dissolved and diluted upto 10 ml with methanol. From this stock solution 2.5 ml of solution was treated with 20 ml of 0.01N NaOH at room temperature for 3 hours. Then, solution was neutralized with 0.01N HCl solution and diluted up to 50 ml with methanol. From this solution 1 ml of solution was diluted upto 10 ml with methanol. From resulting solution 6μl (150 ng/band of Leflunomide) was applied and chromatogram was recorded at the 271 nm and the amount of the drug and base degradation products were calculated.
For tablet sample: An accurately weighed quantity of tablet powder equivalent to 50 mg of Leflunomide was dissolved and diluted upto 10 ml with methanol and sonicated for about 10 mins with occasional shaking. From this stock solution 2.5 ml of solution was treated with 20 ml of 0.01N NaOH at room temperature for 3 hours. After exposure to degradation condition, it was neutralised with 0.01N HCl solution and diluted up to 50 ml with methanol. The solution was filtered with 0.45μ filter discarding the first 5 ml of solution. From this stock solution, 1 ml solution was diluted upto 10 ml with methanol. From resulting solution 6μl (150 ng/band for Leflunomide) was applied to TLC plates and the chromatogram was run under the optimized chromatographic conditions.
Procedure for stress degradation in oxidative condition
For API: An accurately weighed 30 mg of Leflunomide was dissolved and diluted upto 10 ml with methanol. From this stock solution 5 ml of solution was refluxed with 10 ml of 6% w/v H2O2 at (60ºC±2°C) for 1 hour in 250 ml round bottom flask. From this solution 0.25 ml of solution diluted upto 10 ml with methanol. From resulting solution 6μl (150 ng/band of Leflunomide) was applied and chromatogram was recorded at the 271 nm and the amount of the drug and oxidative degradation products were calculated.
For tablet sample: An accurately weighed quantity of tablet powder equivalent to 30 mg of Leflunomide was dissolved and diluted upto 10 ml with methanol and sonicated for about 10 mins with occasional shaking. From this stock solution 5 ml of solution was refluxed with 10 ml of 6% w/v H2O2 at (60ºC±2°C) for 1 hour in 250 ml round bottom flask. After exposure to degradation condition, the solution was filtered with 0.45μ filter discarding the first 5 ml of solution. From this stock solution, 0.25 ml solution was diluted upto 10 ml with methanol. From resulting solution 6μl (150 ng/band for Leflunomide) was applied to TLC plates and the chromatogram was run under the optimized chromatographic conditions.
Procedure for stress degradation in thermal condition
For API: An accurately weighed 25 mg of Leflunomide was taken in porcelain dish and exposed to a temperature of 80ºC for 24 hours in hot air oven. After 24 hours, sample powder was transferred to a 25 ml volumetric flask, dissolved in methanol and diluted up to the mark with the same solvent (1000 μg/ml ). From this solution 0.25 ml of solution was diluted upto 10 ml with methanol. From resulting solution 6μl (150 ng/band of Leflunomide) was applied and, chromatogram was recorded at the 271 nm and the amount of the drugs were calculated.
For tablet sample: An accurately weighed quantity of tablet powder equivalent to 25 mg of Leflunomide was taken in porcelain dish and exposed to a temperature of 80ºC for 24 hours in hot air oven. After 24 hours, sample powder was transferred to a 25 ml volumetric flask, dissolved in methanol and diluted up to the mark with the same solvent (1000 μg/ml) and sonicated for about 10 mins with occasional shaking. The solution was filtered with 0.45μ filter. From this stock solution, 0.25 ml solution was diluted upto 10 ml with methanol. From resulting solution 6μl (150 ng/band for Leflunomide) was applied to TLC plates and the chromatograms were run under the optimized chromatographic conditions.
Procedure for stress degradation in photolytic condition
For API: An accurately weighed 25 mg of Leflunomide was taken in porcelain dish and exposed to a UV Light for 24 hours in UV Chamber. After 24 hours, sample powder was transferred to a 25 ml volumetric flask, dissolved in methanol and diluted up to the mark with the same solvent (1000 μg/ml ). From this solution 0.25 ml of solution was diluted upto 10 ml with methanol. From resulting solution 6μl (150 ng/band of Leflunomide) was applied and, chromatogram was recorded at the 271 nm and the amount of the drug was calculated.
For tablet sample: An accurately Weighed quantity of tablet powder equivalent to 25 mg of Leflunomide was taken in porcelain dish and exposed to a UV Light for 24 hours in UV Chamber. After 24 hours, sample powder was transferred to a 25 ml volumetric flask, dissolved in methanol and diluted up to the mark with the same solvent (1000 μg/ml ) and sonicated for about 10 mins with occasional shaking and made up the volume with Methanol. The solution was filtered with 0.45μm filter. From this stock solution, 0.25 ml solution was diluted upto 10 ml with methanol. From resulting solution 6μl (150 ng/band for Leflunomide) was applied to TLC plates and the chromatograms were run under the optimized chromatographic
Linearity of calibration curves: The linearity of analytical method is its ability to elicit test results that are directly proportional to concentration of analyte in sample within given range. The linearity range of analytical method is interval between upper and lower level of analyte including level that have been demonstrated to be determining with precision and accuracy using method. The linearity is express in term of correlation co-efficient of linear regression analysis. Linearity of the method was evaluated by constructing calibration curve at six different concentration levels (75, 150, 225,300, 375, 450 ng/band) for Leflunomide using working Standard solution having concentration of 25 ng/band. The area at each level was calculated and a graph of mean area v/s concentration (ng) was plotted. The correlation co efficient (r2), intercept (c), and slope of regression line (m) were calculated and recorded (Figure 2).
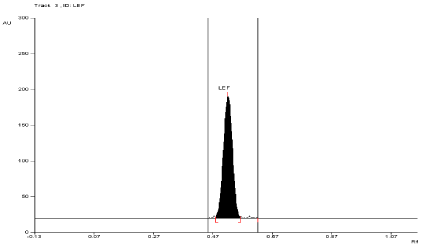
Figure 2: Densitogram of Leflunomide (250 ng/band).
Accuracy: Accuracy of an analysis is determined by calculating systemic error involved. It was determined by calculating recovery of both the drug by standard addition method at three different concentration levels (80%, 100% and 120%) of drug. Standard was prepared as per method. Along with standard calibration curve, assay formulation 6 μl (150 ng/band of Leflunomide) of solution containing Leflunomide was spotted on TLC plate under nitrogen atmosphere. 4.2, 6 and 7.8 μl of standard solution (Containing 120, 150, 180 ng/ band of Leflunomide) was added on succeeding spots to obtain final concentration range of 270, 300, 330 ng/band for Leflunomide. The plate was developed, dried and photometrically analyzed. The amount of drug was calculated by employing corresponding calibration curve equations. Amount found, % Recovery and Mean Recovery was calculated at each level and recorded.
Assay of formulation: Tablet powder equivalent to 10 mg Leflunomide was taken in 10 ml volumetric flask. Methanol was added to the above flask, and the flask was sonicated for 10 min. The solution was filtered using Whatman filter paper No. 41, and the volume was made up to the mark with methanol in order to obtain a solution 1000 μg/ml of Leflunomide. From this solution 0.25 ml volume was taken and transferred into 10 ml volumetric flask and diluted to mark with methanol to obtain working Standard solution (25μg/ml). From which 10 μl was applied in the form of band to obtain a concentration of Leflunomide (250 ng/ band).
Precision
Method precision (Repeatability): Method precision was established by assaying six samples preparations under same conditions. Repeatability of sample application was assessed by spotting 10μl (250ng/band Leflunomide) of drug solution six times on a TLC plate, followed by development of plate and recording the peak area for six spots. Individual assay values, Mean assay value, %RSD was calculated and recorded.
Intra-day and Inter-day precision (Intermediate Precision): Variation of results within the same day (intra day), variation of results between days (inter day) was analyzed.
Intra day precision was determined by analyzing Leflunomide for three times on the same day at 271 nm.
Inter day precision was determined by analyzing the drug daily for three days at 271 nm.
Sensitivity: The sensitivity of measurement of Leflunomide by the use of proposed method was estimated in terms of Limit of Detection (LOD) and Limit of Quantification (LOQ). The LOD and LOQ were calculated by equation. Based on the standard deviation of the response and the slope, LOD and LOQ were estimated using the formula:
LOD and LOQ
LOD and LOQ of the drug were derived by calculating the signal -to-noise (i.e. 3.3 for LOD and 10 for LOQ) ratio using the following equations as per ICH guideline.
LOD = 3.3 × σ/S
LOQ = 10 × σ/S
Where, σ = the standard deviation of the response.
S= slope of the calibration curve
LOD and LOQ were determined from the standard deviations of the responses for six replicate determinations.
Robustness: The effect of small, deliberate variation of the analytical conditions on the peak areas of the drugs was examined. Change in chamber saturation time and change in volume of mobile phase were investigated and %RSD was assessed.
Solution stability
The standard and sample solutions were prepared as per method and initial absorbance was noted down. The standard and sample preparations were analyzed by examining at regular intervals for 24 hours and recorded.
Results and Discussion
Optimization of the mobile phase
To develop the HPTLC method for the estimation of Leflunomide, selection of the mobile phase was carried out on the basis of polarity. A mobile phase that would give a dense and compact band with an appropriate Rf value for Leflunomide is desired. Various mobile phases were tried at initial stage of method development. The mobile phase such as Toluene, n-Hexane and Ethyl acetate were tried initially.
Mixture of Ethyl Acetate: Toluene (7:3 v/v), Ethyl Acetate: Toluene (6:4 v/v), Ethyl Acetate: Toluene (5:5 v/v), n-Hexane: Ethyl Acetate (5:5 v/v), n-Hexane: Ethyl Acetate (6:4 v/v) were tried as mobile phase, but satisfactory results were not achieved.
The mobile phase n-Hexane: Ethyl Acetate (7:3 v/v) mobile phase with a chamber saturation time of 20 min at ambient condition and solvent migration distance of 70 mm was selected as an optimum condition. These chromatographic conditions produced a welldefined, compact band of Leflunomide with Rf 0.55 ± 0.02. (Table 1)
    Mobile phase
    Proportion(v/v)
    Observed Rf value
    Remarks


    Toluene
    10
    0.777
    Tailing observed.


    Ethyl Acetate
    10
    0.82
    Rf was found to be above the range.


    n-Hexane
    10
    0.04
    Compound was not found to be run with mobile    phase


    Ethyl Acetate: Toluene
    5:5
    0.76
    Tailing observed.


    Ethyl Acetate: Toluene
    6:4
    0.79
    Tailing observed.


    Ethyl Acetate: Toluene
    7:3
    0.82
    Tailing observed.


    n-Hexane:Ethyl Acetate
    5:5
    0.81
    Rf was found to be above the range.


    n-Hexane:Ethyl acetate
    6:4
    0.73
    Rf was found to be high with good peak shape


    n-Hexane:Ethyl acetate
    7:3
    0.547
    Rf was found to be optimum with good peak    shape
Table 1: Mobile phase optimization.
Selection of detection wavelength
The sensitivity of HPTLC method that uses ultraviolet (UV) detection depends upon proper selection of detection wavelength. An ideal wavelength is the one that gives good response for the drug that is to be detected. In the present study, solution was applied in the form of a band in concentration ranges of 75–450 ng/band of Leflunomide, was prepared in methanol. A solution was filled in the syringe and under nitrogen stream; it was applied in form of band on a single plate. The plate was developed using n-Hexane: Ethyl Acetate (7:3 v/v) at ambient condition and dried in air. The developed plate was subjected to densitometric measurements in scanning mode in the UV region of 200–400 nm and the overlaid spectrum was recorded using CAMAG TLC Scanner 3. The overlaid spectra showed that drug absorb appreciably at 271 nm (Figure 3).
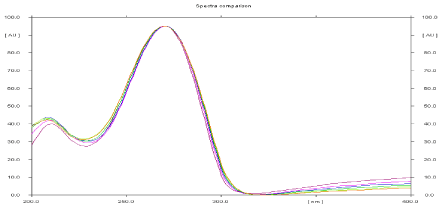
Figure 3: Overlain spectra of absorbance spectra of Leflunomide.
Validation
Specificity: The peak purity index for the main peaks and known impurities peaks in standard preparation and sample preparation should be equal to or more than 0.990. The high value of r indicates specificity of method. Peak purity of Leflunomide was assessed by comparing spectra at the start, apex and end of the peak obtained from the scanning of spot, i.e. r, s, m and r, m, e (Table 2, Figure 4).
    Peak    purity index


    r(s,m)
    r(m,e)


    0.999995
    0.999988


    0.999969
    0.999961
Table 2: Specificity result of the leflunomide.
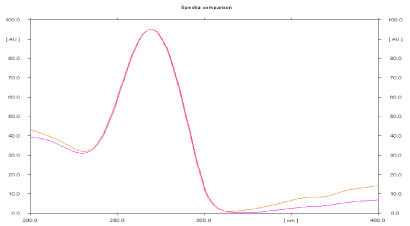
Figure 4: Overlain spectra of Standard Leflunomide and Sample drug.
Forced degradation study: The forced degradation study of Leflunomide was carried out using n-Hexane: Ethyl Acetate (7:3 v/v) as a mobile phase. This mobile phase was found to be capable of separating the degradation products of drug formed during exposure to various stress conditions from main peak of Leflunomide. The percentage of degradation of drug under various stress conditions were described as following:
Stress degradation study in acidic medium
For API and tablet: Leflunomide was found to be acid sensitive. After refluxing the mixture for 3 hours at (80°±2°C) in 1 N HCl, the degradation of both API and tablet were found to be 10.52 % and 11.24 %, respectively with formation of one degradation product. The Rf value of Leflunomide was found to be 0.54 and 0.27 for degraded product of both API and tablet (Figure 5, Figure 6).
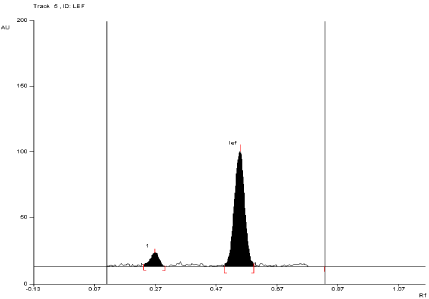
    Figure 5:  Densitogram of API of Leflunomide (150ng/band) and its
degradation products in the acid degradation study using mobile phase
n-Hexane: Ethyl Acetate (7:3 v/v).
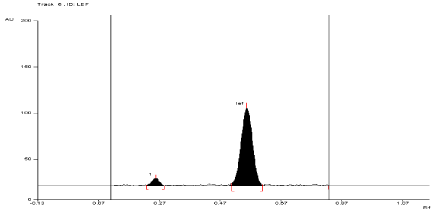
    Figure 6:  Densitogram of sample of Leflunomide (150 ng/band) and its
degradation products in the acid degradation study using mobile phase
n-Hexane: Ethyl Acetate (7:3 v/v).
Stress degradation study in basic medium
For API and tablet: Leflunomide was found to be sensitive to degradation in basic condition. After exposing the mixture for 3 hour at room temperature in 0.01 N NaOH, Leflunomide formed two degradation products. In basic condition, the degradation of both products of API and tablet were found to be 17.28% and 9.54%, 17.84% and 10.4%, respectively. The Rf values of Leflunomide was found to be 0.57 and Rf values of both degradation products of API and tablet were found to be 0.39 and 0.47, 0.39 and 0.44, respectively (Figure 7, Figure 8).
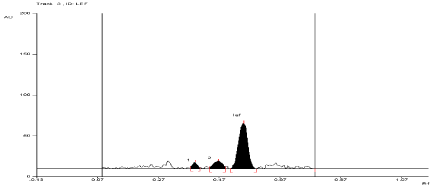
    Figure 7:  Densitogram of API of Leflunomide (150 ng/band) and its
degradation products in the base degradation study using mobile phase
n-Hexane: Ethyl Acetate (7:3v/v).
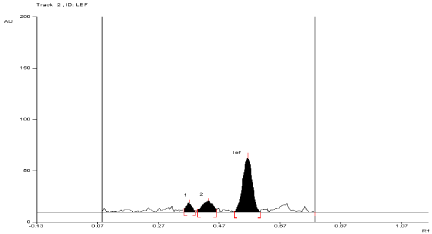
    Figure 8:  Densitogram of sample of Leflunomide (150 ng/band) and its
degradation products in the base degradation study using mobile phase
n-Hexane: Ethyl Acetate (7:3v/v).
Stress degradation study in oxidative condition
For API and tablet: Leflunomide was found to be sensitive to oxidation in 6 %w/v of H2O2. After refluxing the mixture for 1 hour at (60°±2°C) in 6 % w/v of H2O2, the degradation of API and tablet were found to be 12.26 % and 13.42%, respectively. The Rf value of Leflunomide was found to be 0.57 and 0.79 for degraded product of API and tablet (Figure 9, Figure 10).
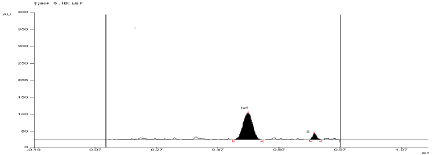
    Figure 9:  Densitogram of API of Leflunomide (150 ng/band) and its
degradation products in the oxidative degradation study using mobile phase
n-Hexane: Ethyl Acetate (7:3 v/v).
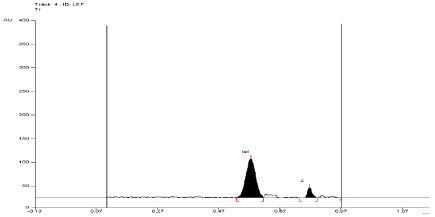
    Figure 10:  Densitogram of sample of Leflunomide (150 ng/band) and its
degradation products in the oxidative degradation study using mobile phase
n-Hexane: Ethyl Acetate (7:3 v/v).
Stress degradation study in thermal condition
For API and tablet: Leflunomide was found to be stable in selected Thermal condition. The Rf value of Leflunomide was found to be 0.55 (Figure 11, Figure 12).
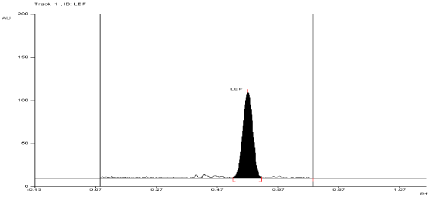
    Figure 11:  Densitogram of API of Leflunomide (150 ng/band) and its
degradation products in the thermal degradation study using mobile phase
n-Hexane: Ethyl Acetate (7:3 v/v).
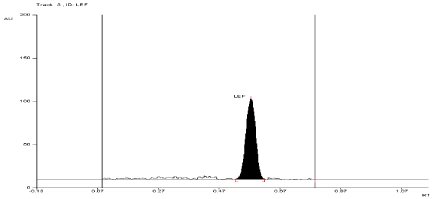
    Figure 12:  Densitogram of sample of Leflunomide (150 ng/band) and its
degradation products in the thermal degradation study using mobile phase
n-Hexane: Ethyl Acetate (7:3 v/v).
Stress degradation study in photolytic condition
For API and tablet: Leflunomide was found to be stable in selected photolytic condition. The Rf value of Leflunomide was found to be 0.57 (Figure 13, Figure 14, Table 3).
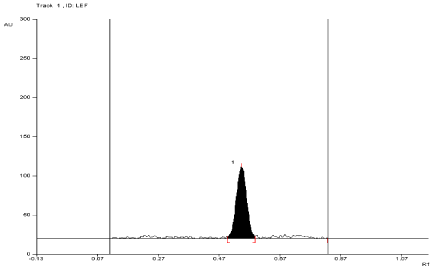
    Figure 13:  Densitogram of API of Leflunomide (150 ng/band) and its
degradation products in the photolytic degradation study using mobile phase
n-Hexane: Ethyl Acetate (7:3 v/v).
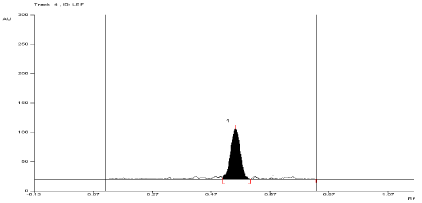
    Figure 14:  Densitogram of sample of Leflunomide (150 ng/band) and its
degradation products in the photolytic degradation study using mobile phase
n-Hexane: Ethyl Acetate (7:3 v/v).
    Degradation    Condition
    Number of    Degradation Product/s
      With Rf
    % Degradation
      (based on area)*
    %Assay


    API
    Sample
    API
    Sample
    API
    Sample


    Acidic
    1(0.26)
    1(0.27)
    10.52
    11.24
    89.48
    88.76


    Basic
    2(0.39,0.47)
    2(0.36,0.44)
    26.82
    28.24
    73.18
    71.76


    Oxidative
    1(0.79)
    1(0.79)
    12.26
    13.42
    87.74
    86.58


    Thermal
    -
    -
    -
    -
    99.12
    98.92


    Photolytic
    -
    -
    -
    -
    98.38
    98.29
Table 3: Result of Force Degradation Study.
Linearity and calibration curves: Linearity of an analytical method is its ability, within a given range, to obtain test results that are directly, or through a mathematical transformation, proportional to the concentration of the analyte. The method was found to be linear in concentration ranges of 75-450 ng/ band of Leflunomide (Figure 4). Three dimensional overlay of HPTLC densitogram of Calibration bands of Leflunomide was obtained in above concentration ranges. The regression data showed a good linear relationship over the concentration range studied, demonstrating the suitability of the method for analysis (Table 4, Figure 15, and Figure 16).
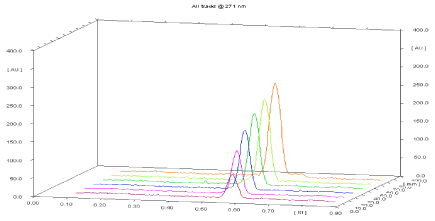
    Figure 15:  Three dimensional overlay of HPTLC densitogram of calibration
bands of Leflunomide.
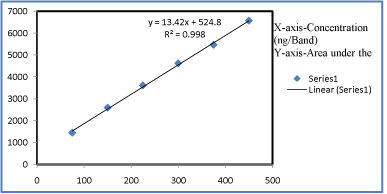
Figure 16: Regression graph of Leflunomide.
    Parameter
    Leflunomide (271 nm)


    Linear Range (ng/band)
    75-450


    Correlation coefficient (r2)
    0.9985


    Slope (m)
    13.421


    Intercept (c)
    524.8


    Standard deviation of intercept
    14.66107
Table 4: Statistical data for Leflunomide by HPTLC method.
Accuracy: Accuracy of an analytical method is the closeness of test results to the true value (100%). It was determined by the application of analytical procedure to recovery studies, where a known amount of standard is spiked into pre-analyzed sample solutions. % Recoveries was found to be 99.41-100.42% for Leflunomide. Values demonstrated the accuracy of the method is in the desired range (98- 102%) (Table 5).
    Amount  of    sample drug taken (ng/band)
    Amount     of  standard drug added    (ng/band)
    Total amount      of Drug (ng/band)
    Amount of drug recovered (ng/band)
    %Recovery
    Mean % Recovery ±SD
    %
      RSD


    150
    -
    150
    149.27
    99.51
    99.43
      ±0.99
    1.0


    150
    -
    150
    150.57
    100.38


    150
    -
    150
    147.59
    98.39


    150
    120
    270
    274.64
    101.72
    100.42
      ±1.19
    1.19


    150
    120
    270
    270.44
    100.16


    150
    120
    270
    268.37
    99.39


    150
    150
    300
    304.33
    101.44
    100.36
      ±1.44
    1.43


    150
    150
    300
    302.77
    100.92


    150
    150
    300
    296.16
    98.72


    150
    180
    330
    324.82
    98.43
    99.41
      ±1.0
    1.01


    150
    180
    330
    331.44
    100.43


    150
    180
    330
    327.90
    99.36
Table 5: Data derived from Accuracy experiment.
Analysis of formulation: The formulation was analyzed using the proposed method which gave percentage recovery of more than 98.0% for Leflunomide. A single band at Rf 0.55 ± 0.02 was observed in the chromatogram for Leflunomide, and no interference from the excipients present in the formulation was observed (Table 6).
    Parameter
    Tablet formulation (LEFRA)


    Concentration [ng/band]
    250


    Concentration found [ng/band] (n=6)
    248.57±1.21


    %purity
    99.41±1.03


    %RSD
    1.03
Table 6: Assay result of marketed formulation.
Precision: Intra-day precision refers to the use of an analytical procedure within a laboratory over a short period of time by the same operator with the same equipment, whereas inter-day precision involves estimation of variations in analysis when a method is used within a laboratory on different days. The RSD values of the response were less than 2% for intra-day and inter-day precision. Repeatability of the scanning device and injection was studied by applying and analyzing Leflunomide samples (150 ng/band) 6 times. The RSD values obtained were less than 2%, which was under the acceptance criteria of ICH method validation guideline (<2%). The results indicated that the method is repeatable and reproducible (Table 7, Table 8, Table 9).
    Concentration
    Leflunomide (250 ng/band)


    Area
    3969.4


    3883.2


    3923.4


    3944.3


    3957.5


    3973.6


    Mean
    3941.9


    SD
    34.05349


    % RSD
    0.86
Table 7: Repeatability data for Leflunomide.
    Concentration(ng/band)
    Mean Area (n=3)
    SD
    %RSD


    225
    3604.7
    23.17995
    0.64


    300
    4605.367
    22.5775
    0.49


    375
    5453.1
    16.59729
    0.30
Table 8: Intra-day precision data for Leflunomide at 271 nm.
    Concentration(ng/band)
    Mean Area (n=3)
    SD
    %RSD


    225
    3612.5
    27.56211
    0.76


    300
    4625.067
    26.10485
    0.56


    375
    5476.867
    27.49079
    0.50
Table 9: Inter day precision data for Leflunomide at 271 nm.
Limit of detection and limit of quantification: Under the experimental conditions used, the lowest amounts of drug that could be detected (LOD) for Leflunomide was found to be 3.604 ng/band. The limit of quantification (LOQ) for Leflunomide was found to be 10.923 ng/band. This indicates that the nanogram quantity of drug can be estimated accurately and precisely which means the method is sensitive.
Robustness: The %RSD values less than 2% were obtained after introducing small, deliberate changes in parameters of the developed HPTLC method, confirming its robustness (Table 10).
    Conc.    of Sample taken (ng/band)
    Parameters
    Level
    Mean Peak Area (n=3)
    SD
    % RSD


    Leflunomide 250
    Chamber saturation time
    15 mins
    3864.5
    31.5996
    0.82


    25 mins
    3915.4
    40.2945
    1.02


    Volume of mobile phase
    +0.5 ml
    3934.2
    35.3261
    0.89


    -0.5 ml
    3884.9
    38.6384
    0.99
Table 10: Results of robustness studies.
Solution stability: The stability of sample solutions was studied at ambient condition for 24hrs. The drug was found to be stable with a recovery of more than 98% (Table 11, Table 12).
    Times (Hrs.)
    Area
    %Assay


    Standard
    Sample
    Standard
    Sample


    Initial
    3899.3
    3871.6
    100.57
    99.74


    4
    3879.2
    3864.5
    99.97
    99.53


    8
    3854.5
    3845.2
    99.23
    98.96


    12
    3834.2
    3828.6
    98.63
    98.47


    24
    3826.6
    3816.9
    98.41
    98.12
Table 11: Solution stability study.
    Parameters
    Accepatance criteria
    Results


    Linearity (ng/band)
    ≥0.995
    0.9985


    Recovery%
    98-102%
    99.41-100.42%


    Precision


    Repeatability (%RSD,n=6)
    ≤2%
    0.86


    Intraday (%RSD,n=3)
    ≤2%
    0.49


    Interday (%RSD,n=3)
    ≤2%
    0.61


    Sensitivity


    LOD(ng/spot)
    -
    3.604


    LOQ(ng/spot)
    3 times higher than LOD
    10.923


    Specificity
    No interference with the spectra
    Specific


    Robustness
    ≤2%
    Robust
Table 12: Summary of validation parameters of HPTLC method.
Conclusion
HPTLC method was developed and validated for estimation of Leflunomide. The method was found to be simple, sensitive, accurate and precise with low level of LOD and LOQ. Statistical analysis proved that method was reproducible and specific for the analysis of Leflunomide without any interference from the excipients. Forced degradation study was carried out for both the API and tablet formulation. Degradation products were well separated by proposed HPTLC method. So, it can be concluded that current work satisfies all necessary requirements for method development and can be used routinely for estimation of Leflunomide from bulk and pharmaceutical dosage forms.
Equations and Formula
LOD=3.3 × σ/S
LOQ=10 × σ/S
where, σ = The standard deviation of the response.
S= Slope of the calibration curve.
%RSD = SD/Mean × 100
where, RSD = Relative standard deviation.
SD = Standard deviation.
where, σ= Standard deviation xi=each value of dataset.
x = The arithmetic mean of data.
N=Total number of data points.
Σ( Xi- x )2=The sum of ( Xi- x )2 for all data point.
Y= mx+c
Where, y= Peak area of different concentration (AU).
m= Slope of calibration curve.
x= Concentration of solution (ng/band).
c= Intercept of calibration of curve.
References
- The British Pharmacopoeia, 14th edn, London: British Pharmacopoeia Commission Office, Market Towers. 2010.
- United States Pharmacopeia 34 and National Formulary 29, 29th edn, Rockville: The United States Pharmacopeial Convection. 2011.
- Indian Pharmacopoeia, Ministry of Health and Family Welfare, 7th edn, Ghaziabad: Indian Pharamcopoeia Commission. 2014.
- Mehta V, Kisalay S, Balachandran C. Leflunomide. Indian J Dermatol Venereol Leprol. 2009; 75: 422-424.
- Yadav B, Nagariya K and Sonaje GR. RP–HPLC Stability Indicating Method Development and Validation for the Estimation of the Leflunomide and Related Substance in Solid Oral Formulations. J Glob Pharma Tech. 2010; 6: 40-45.
- Kher GJ, Ram VR, Dubal KL, Bapodara AH and Joshi HS. Validation of a Stability-Indicating LC Method for Assay of Leflunomide in Tablets and for Determination of Content Uniformity. Int J ChemTech Res. 2011; 3: 523-530.
- Sethi PD. In Sethi’s HPTLC- High Performance Liquid Chromatography – Quantitative Analysis of Pharmaceutical Formulations, 1st edn, New Delhi: CBS Publishers & Distributers Pvt. Ltd. 2013.
- Patel R, Patel M, Dubey N, Dubey N and Patel B. HPTLC Method Development and Validation: Strategy to Minimize Methodological Failures. J F & D Anal. 2012; 4: 794-804.
- Peinado A, Hammond J, Scott A. Development, validation and transfer of a near infrared method to determine in-line the end point of a fluidised drying process for commercial production batches of an approved oral solid dose pharmaceutical product. J Pharm Biomed Anal. 2011; 54: 13-20.
- Food and Drug Administration, HHS. International Conference on Harmonisation; Stability Data Package for Registration Applications in Climatic Zones III and IV; Stability Testing of New Drug Substances and Products; availability. Notice. Fed Regist. 2003; 68: 65717-65718.