
Research Article
Austin J Anal Pharm Chem. 2016; 3(1): 1061.
Development and Validation of HPLC Method for Estimation of Etodolac in Rat Plasma
Bachhav DG1*, Khadabadi SS2 and Deore LP1
1M.G.V.’s SPH College of Pharmacy, Malegaon, Nashik, India
2Government College of Pharmacy, Amravati, India
*Corresponding author: Bachhav DG, Department of Pharmaceutics, M.G.V.’s S.P.H.College of Pharmacy, Malegaon, Nashik (MS), India
Received: March 20, 2016; Accepted: April 11, 2016; Published: April 14, 2016
Abstract
Etodolac is 1, 8-diethyl-1, 3, 4, 8- tetrahydropyrano [3,4-b] indole-1-acetic acid, used for osteoarthritis. This study was designed to develop and validate high performance liquid chromatography method of etodolac in rat plasma. The samples were analyzed by HiQ Sil C18 HS (250 × 4.6 mm, 5μ.) columns, using Acetonitrile: 0.02M potassium dihydrogen orthophosphate (65: 35 v/v) as a mobile phase. The method showed linearity (r2= 0.9964) over a concentration range of (1-25μg/ml). The method showed good mean recovery (97.53%) for etodolac. The method was found to be accurate, precise, linear, specific, sensitive and stable.
Keywords: Etodolac; HPLC; Rat plasma; Analytical method; Validation
Abbreviations
HPLC: High Performance Liquid Chromatography; ETDO: Etodolac; THIO: Thiocolchicoside; NSAID: Non-steroidal Antiinflammatory Drug; RP-HPLC: Reverse Phase High Performance Liquid Chromatography; GC-MS: Gas Chromatography Mass Spectroscopy; ICH: International Conference on Harmonization; Rpm: Revolution per minute; ISTD: Internal Standard; ACN: Acetonitrile; DMSO: Dimethyl Sulfoxide; LLOQ: Lower Limit of Quantification; CV: Coefficient of Variation; LQC: Low Quality Control; MQC: Middle Quality Control; HQC: High Quality Control
Introduction
Etodolac is 1, 8-diethyl-1, 3, 4, 8 - tetrahydropyrano [3, 4-b] indole- 1-acetic acid. Etodolac contains not less than 98.0% and not more than 102.0% of C17H21NO3, calculated on the anhydrous basis [1]. Etodolac is a nonsteriodal anti-inflammatory drug (NSAID) that exhibits antiinflammatory, analgesic, and antipyretic activities. The mechanism of action of etodolac, like that of other NSAIDs, is not completely understood, but may be related to prostaglandin synthetase inhibition [2]. Well absorbed following oral administration; bioavailability is about 80%. Peak plasma concentration usually attained within about 1.4 hours (conventional capsules and tablets) or 6.7 hours (extendedrelease tablets) [3]. Etodolac is white or almost white crystalline powder [1]. Soluble in water (<1 mg/ml), methanol (9.80-10.20mg/ ml), chloroform, DMSO (58mg/ml), and ethanol (58mg/ml) [4-6]. Several spectroscopic and chromatographic methods are available in literature to determine concentration of Etodolac, individually or in combination with other drugs or metabolites as UV [7-8], HPLC- UV [9], RP-HPLC [10-11], GC-MS [12]. The present article describes a simple HPLC method for estimation of Etodolac and validation of the method as per the guidelines of ICH [13].
Materials and Methods
Reagents and chemicals
Etodolac (Ipca Laboratories, Mumbai), Acetonitrile HPLC grade, Methanol HPLC grade. (Merck Laboratories, Mumbai), Double distilled water, Glacial Acetic Acid, Potassium dihydrogen orthophosphate.
Selection of mobile phase
Different mobile phases like methanol with Phosphate buffer of different molarities at various pH, acetonitrile and Phosphate buffer, methanol and water were tried in different ratio in order to find the best conditions for Etodolac (ETO). After several trials Acetonitrile: 0.02M potassium dihydrogen orthophosphate (65: 35 v/v) was chosen as the mobile phase for analysis in which optimum system suitability parameters were obtained.
Preparation of mobile phase
130 ml of HPLC grade Acetonitrile was added in 70ml of 0.02M potassium dihydrogen orthophosphate i.e. in 65: 35 v/v proportions. The solution was further filtered through 0.45μ membrane filter and sonicated in sonicator bath for 10min.
Preparation of standard stock solutions of Etodolac (100μg/ml)
10 mg of Etodolac was dissolved in 10ml of Acetonitrile and 1ml of this solution was diluted with Acetonitrile to final volume of 10ml in volumetric flask to get concentration 100μg/ml (stock I).
Preparation of intermediate stock solution by using stock solutions of Etodolac (100μg/ml) for plasma calibration curve
Using a calibrated pipette 0.4, 1, 2, 4, 6 and 8 ml of stock solution I was transferred to separate volumetric flasks and then diluted to 10ml with acetonitrile to get concentrations 4, 10, 20, 40, 60 and 80μg/ml.
Preparation of internal standard stock solution of Thiocolchicoside (100μg/ml)
10 mg of Thiocolchicoside was dissolved in 10 ml of Acetonitrile and 1 ml of this solution was diluted with Acetonitrile to final volume of 10 ml in volumetric flask to get concentration 100 μg/ml (stock I). Using a calibrated pipette, 4 ml of ISTD stock solution (100μg/ml) was pipette into a 10.0 ml volumetric flask and made up the volume with the mobile phase to get concentration of 40μg/ml.
Preparation of plasma sample solution
To 0.5ml of rat plasma, 0.5ml of stock solution of Etodolac (Concentrations: 4, 10, 20, 40, 60, 80 and 100μg/ml), 0.5ml of an internal standard solution (Thiocolchicoside, 40μg/ml) and 0.5 ml Acetonitrile were added in a glass tubes (Table 1). Each sample tube was vortex mixed for 10min and centrifuged (3000rpm for 10min). After centrifugation 20μl aliquots of supernatant of each concentration were injected into the HPLC system.
    Rat
      Plasma
    Stock solution of ETO
      (0.5 ml)
    Stock solution of THIO
      (0.5 ml)
    ACN
    Conc. of ETO
      (μg/ml)
    Conc. of THIO
      (μg/ml)


    0.5 ml
    Mobile phase
    Mobile phase
    0.5 ml
    Blank
    Blank


    0.5 ml
    4 μg/ml
    40 μg/ml
    0.5 ml
    1
    10


    0.5 ml
    10 μg/ml
    40 μg/ml
    0.5 ml
    2.5
    10


    0.5 ml
    20 μg/ml
    40 μg/ml
    0.5 ml
    5
    10


    0.5 ml
    40 μg/ml
    40 μg/ml
    0.5 ml
    10
    10


    0.5 ml
    60 μg/ml
    40 μg/ml
    0.5 ml
    15
    10


    0.5 ml
    80 μg/ml
    40 μg/ml
    0.5 ml
    20
    10


    0.5 ml
    100 μg/ml
    40 μg/ml
    0.5 ml
    25
    10
Table 1: Plasma sample preparation.
Selection of analytical wavelength
From the standard stock solution further dilutions were done using mobile phase and scanned over the range of 200-400nm and the spectra were overlain (Figure 1).
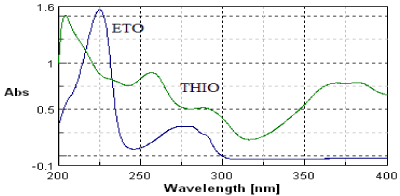
Figure 1: Zero order overlain spectra of ETO (10μg/ml) and THIO (10μg/ml).
Summary of chromatographic parameters selected
1. Column : HiQ Sil C18 HS (250 × 4.6mm, 5μ.)
2. Mobile phase : Acetonitrile : 0.02M potassium dihydrogen
orthophosphate (65: 35 v/v)
3. Flow rate : 1.00 ml/min
4. Detection Wavelength : 225nm
5. Sample injector : 20μl loop
6. Temperature : Ambient
7. Internal standard : Thiocolchicoside
Method validation
Selectivity/Specificity: Selectivity is the ability of an analytical method to differentiate and quantify the analytes in the presence of other components in the sample. The selectivity of the method was evaluated by analyzing 6 replicates of plasma samples spiked at LLOQ (Lower Limit of Quantification - 1μg/ml).
Linearity: Linearity was tested for the range of concentrations 1 - 25 μg/ml. Each standard in three replicates were analyzed and peak areas were recorded. The response factors were plotted against the corresponding concentrations to obtain the calibration graphs.
Accuracy: The accuracy of the assay was calculated as the absolute value of the ratio of the calculated mean values of the quality control samples to their respective nominal values, expressed as percentage. Accuracy should be measured using minimum five determinations per three concentrations (2.5, 10, 20μg/ml). 20-μl aliquots of supernatant of each concentration were injected in to the HPLC system.
Precision: The precision of this method was evaluated by the % CV at different concentration levels corresponding to LQC, MQC and HQC during the course of validation.
Interday precision (Reproducibility): The % CV of calculated concentrations for all quality control samples of LQC, MQC and HQC concentration levels are ranged from 2.24 to 7.15 %, which is within the acceptance limit of 15.00%. The reproducibility (interassay precision) was evaluated in three replicates for three different concentrations of ETO (2.5, 10, 20μg/ml) on three consecutive days (fresh samples were prepared every day).
Intraday precision (Repeatability): The repeatability (intraassay precision) of the method was evaluated in five replicates on the same day for three different concentrations of ETO (5, 15, 20μg/ml). The results, expressed as mean amount of drug found in plasma and summarized.
Recovery: The % mean recoveries were determined by measuring the responses of the extracted plasma quality control samples against unextracted quality control samples at HQC, MQC and LQC levels. Recovery from human plasma samples was evaluated in triplicate for each three concentrations of ETO (2.5, 10, 20μg/ml). 20-μl aliquots of supernatant of each concentration were injected in to the HPLC system.
Stability: Drug stability in a biological fluid was a function of the storage conditions, the chemical properties of the drug, the matrix, and the container system. Stability procedures should evaluate the stability of the analytes during sample collection and handling, after long-term (frozen at the intended storage temperature) and shortterm (bench top, room temperature) storage conditions.
Freeze and Thaw stability: Freeze thaw stability of the spiked quality control samples was determined after three freeze thaw cycles stored at -5°C ± 0°C. Comparing them against the freshly spiked quality control samples assessed stability.
Bench top stability: Bench top stability of the spiked quality control samples was determined for a period of 5 hours 30min stored at room temperature. Comparing them against the freshly spiked quality control samples assessed stability.
Stock solution stability: Stock solution stability of the HQC and LQC was determined for a period of 5hours 30min stored at room temperature. Comparing them against the freshly weighed stock solution assessed for stability.
Result and Discussion
Selection of analytical wavelength
It was observed that both drugs showed considerable absorbance at 257nm (Figure 1). No endogenous interferences are noted at the retention time of the drugs as shown in Figure 2.
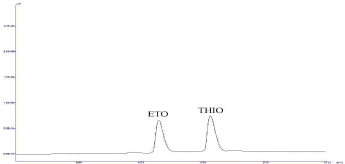
    Figure 2:  Chromatograph of Standard Etodolac (tR-5.105) and
Thiocolchicoside (tR-6.257).
Method validation
Selectivity/Specificity: The precision and accuracy for at LLOQ level are found to be 4.083% (as % CV) and 104.08% (as % recovery), respectively. The results are summarized in Table 2. No endogenous interferences are noted at the retention time of the drugs as shown in Figure 3 and 4.
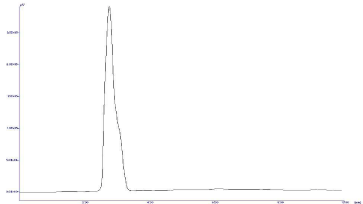
Figure 3: Chromatograph of Blank Plasma.
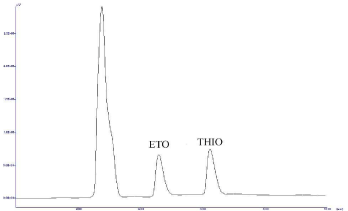
    Figure 1:  Chromatograph of Plasma spiked with Etodolac (tR-5.128) and
Thiocolchicoside (tR-6.262).
    Replicate No.
    Nominal Conc. (LLOQ)
      (0.2 µg/ml)


    Calculated Conc. (µg/ml)


    1
    1.00


    2
    1.10


    3
    1.06


    4
    0.99


    5
    1.07


    6
    1.02


    Mean
    1.04


    SD
    0.04249


    % CV
    4.083


    % Mean Accuracy
    104.08


    Acceptance    Criteria: At least 67 % (4 out of 6) sample should be within 80.00-120.00 %.    The % Mean accuracy should be within 80.00-120.00 %. The % CV should be ≤    20.00 %.
Table 2: Results for selectivity.
Linearity: All the calibration curves analyzed during the course of validation were found to be linear for the standards concentration ranging from 1-25μg/ml (Table 3 and 4) and best fitted by a linear equation y = mx + c, the coefficient of determination for plain ETO (R2) is 0.998 and plasma containing ETO (R2) is 0.996. An averaged calibration curves are shown in Figure 5 and 6.
    Concentration (µg/ml)
      (n=3)
    Response Factor*


    1
    0.6833


    2.5
    0.9959


    5
    1.7539


    10
    3.6666


    15
    5.2310


    20
    6.6110


    25
    8.4985


    *Average    of three determinations.
Table 3: Observation table for Linearity of ETO plain sample.
    Concentration (µg/ml) (n=3)
    Response Factor*


    1
    0.6853


    2.5
    0.9859


    5
    1.7486


    10
    3.6510


    15
    5.4339


    20
    6.8026


    25
    8.1686


    *Average    of three determinations.
Table 4: Observation table for Linearity of ETO in plasma sample.
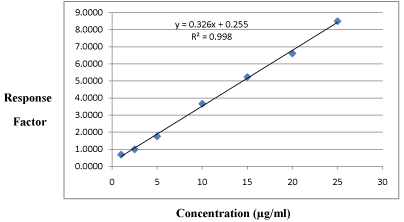
Figure 5: Calibration curve plain ETO sample.
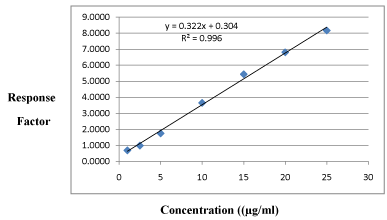
Figure 6: Calibration curve ETO in plasma sample.
Accuracy: The % mean accuracy of calculated concentrations for all quality control samples at LQC, MQC and HQC concentration levels are ranged from 96.08% to 99.56%, which is within acceptance limit 85.00 - 115.00 % (Table 5).
    Replicate      No.
    LQC
    MQC
    LQC                   HQC


    Nominal concentration (µg/ml)


    2.5
    10
    20


    Calculated Concentration (µg/ml)


    1
    2.246
    9.429
    16.821


    2
    2.366
    10.290
    20.402


    3
    2.561
    9.781
    18.966


    4
    2.649
    10.467
    20.117


    5
    2.263
    9.810
    19.777


    Mean
    2.42
    9.96
    19.22


    SD
    0.180
    0.419
    1.443


    %CV
    7.46
    4.21
    7.51


    % Mean Accuracy
    96.69
    99.56
    96.08


    Acceptance    Criteria: The % Mean Accuracy for HQC, MQC, and LQC sample should be within    85.00-115.00 %.
Table 5: Results for Accuracy.
Precision: The precision of this method was evaluated by the % CV at different concentration levels corresponding to LQC, MQC and HQC during the course of validation.
A] Inter Day Precision (Reproducibility): The % CV of calculated concentrations for all quality control samples of LQC, MQC and HQC concentration levels are ranged from 2.24 to 7.15 %, which is within the acceptance limit of 15.00%. The reproducibility (interassay precision) was evaluated in three replicates for three different concentrations of ETO (2.5, 10, 20 μg/ml) on three consecutive days (fresh samples were prepared every day). The results, expressed as mean amounts of drug found in plasma and summarized in the Table 6.
    A
    DAY 1
    DAY 2
    DAY 3


    Nominal concentration 2.5 µg/ml    (LQC)


    Calculated concentration    (µg/ml)


    1
    2.355
    2.430
    2.474


    2
    2.420
    2.331
    2.355


    3
    2.298
    2.341
    2.328


    Mean
    2.358
    2.367
    2.385


    SD
    0.0611
    0.0545
    0.0777


    % CV
    2.59
    2.30
    3.26


    B
    Nominal concentration 10 µg/ml    (MQC)


    Calculated concentrations    (µg/ml)


    1
    10.733
    10.139
    10.046


    2
    9.677
    10.102
    11.310


    3
    10.375
    9.435
    10.731


    Mean
    10.262
    9.892
    10.696


    SD
    0.5372
    0.3963
    0.6327


    % CV
    5.23
    4.01
    5.92


    C
    Nominal concentration 20 µg/ml    (HQC)


    Calculated concentrations    (µg/ml)


    1
    20.266
    20.422
    17.994


    2
    19.439
    19.689
    18.657


    3
    20.148
    19.318
    20.619


    Mean
    19.951
    19.810
    19.090


    SD
    0.4476
    0.5617
    1.3646


    % CV
    2.24
    2.84
    7.15


    Acceptance    Criteria: The % CV for LQC, MQC and HQC samples should be within 15.00 %.
Table 6: Observation table for Inter Day Precision.
B] Intra Day Precision (Repeatability): The % CV of calculated concentrations for all quality control samples at LQC, MQC and HQC concentration levels are ranged from 3.26 to 3.67 %, which is within acceptance limit 15.00 % as shown in Table 7.
      Replicate
      No.
    Nominal    concentrations


    (LQC)
      (5    µg/ml)
    (MQC)
      (15    µg/ml)
    (HQC)
      (20    µg/ml)


    Calculated    concentrations (µg/ml)


    1
    4.743
    15.164
    19.210


    2
    4.432
    15.715
    20.352


    3
    4.364
    16.778
    20.228


    4
    4.460
    15.785
    18.914


    5
    4.615
    15.842
    19.371


    Mean
    4.523
    15.857
    19.615


    SD
    0.1535
    0.5817
    0.6391


    %    CV
    3.39
    3.67
    3.26


    Acceptance    Criteria: The % CV for HQC, MQC, and LQC samples should be within15.00 %.
Table 7: Observation table for Intra Day Precision.
Recovery: The % mean recovery for ETO at HQC, MQC and LQC levels are found to be 97.85%, 99.89% and 94.86% respectively. Over all % CV at all QC levels is 2.59%, which is within the acceptance limit of 15.00% and % over all mean recovery is 97.53%, which is within the acceptance limit of 20.00%. The results are summarized in the Table 8.
      Replicate
      No.
    LQC
      (2.5 µg/ml)
    MQC
      (10 µg/ml)
    HQC
      (20 µg/ml)


    Plain sample
    Plasma sample
    Plain     sample
    Plasma sample
    Plain     sample
    Plasma
      sample


    Calculated concentrations (µg/ml)


    1
    2.307
    2.090
    9.114
    9.588
    20.583
    19.633


    2
    2.338
    2.295
    9.739
    9.340
    20.704
    19.181


    3
    2.152
    2.265
    9.414
    9.310
    19.501
    18.853


    Mean
    2.265
    2.217
    9.423
    9.412
    20.263
    19.222


    SD
    0.0997
    0.1108
    0.3126
    0.1526
    0.6623
    0.3917


    % CV
    4.40
    5.00
    3.32
    1.62
    3.27
    2.04


    % Mean
      Recovery
    97.85
    99.89
    94.86


    % Overall
      Mean Recovery
    97.53


    Overall SD
    2.53


    Overall % CV
    2.59


    Acceptance    Criteria: The % CV of recovery at each QC levels should be ≤ 15.00 %. The    overall mean recovery for all QC levels should be ≤ 20.00 %.
Table 8: Observation table for Recovery.
Stability
Freeze and Thaw stability: The % mean stability for HQC (20μg/ml) and LQC (2.5μg/ml) are found to be 86.18% and 94.47% respectively, which is within the acceptance limit of 85.00 - 115.00 %. The results are summarized in the Table 9.
      Replicate      No.

    Nominal concentrations


    LQC (2.5 µg/ml)
    HQC (20 µg/ml)


    Comparison
      Sample
    Stability
      Sample
    Comparison sample
    Stability sample


    Calculated concentrations    (µg/ml)


    1
    2.153
    2.091
    20.521
    18.829


    2
    2.408
    2.086
    20.445
    17.120


    3
    2.204
    2.214
    21.249
    17.666


    Mean
    2.255
    2.130
    20.738
    17.872


    SD
    0.1354
    0.0725
    0.4440
    0.8730


    % CV
    6.00
    3.40
    2.14
    4.88


    % Mean           stability
    94.47
    86.18


    Acceptance    Criteria: The % CV for LQC and HQC should be sample should be ≤ 15.00. The %    mean stability of LQC and HQC sample should be within 85.00-115.00 %.
Table 9: Results for Freeze and Thaw stability Study.
Bench top stability: The % mean stability for HQC (20μg/ml) and LQC (2.5μg/ml) are found to be 88.65% and 93.86% respectively, which is within the acceptance limit of 85.00 - 115.00 %. The results are summarized in the Table 10.
    Replicate
      No.

    Nominal concentrations


    LQC (2.5 µg/ml)
    HQC (20 µg/ml)


    Comparison      sample
    Stability       Sample
    Comparison sample
    Stability         Sample


    Calculated concentrations (µg/ml )


    1
    2.374
    2.154
    20.422
    17.783


    2
    2.265
    2.241
    19.234
    17.774


    3
    2.287
    2.107
    21.811
    18.935


    Mean
    2.309
    2.167
    20.489
    18.164


    SD
    0.0575
    0.0679
    1.2899
    0.6679


    % CV
    2.49

    3.14

    6.30

    3.68


    % Mean
      Stability
    93.86
    88.65


    Acceptance    Criteria: The % CV for LQC and HQC should be sample should be ≤ 15.00. The %    mean stability of LQC and HQC sample should be within 85.00-115.00 %.
Table 10: Results for Bench top Stability Study.
Stock solution stability: The % mean stability for HQC (20μg/ml) and LQC (2.5μg/ml) are found to be 94.07% and 96.14% respectively, which is within the acceptance limit of 90.00 - 110.00 %. The results are summarized in the Table 11.
      Replicate      No.

    Nominal concentrations


    LQC (0.5 µg/ml)
    HQC (4 µg/ml)


    Comparison sample
    Stability sample
    Comparison sample
    Stability sample


    Calculated concentrations (µg/ml)


    1
    2.315
    2.285
    18.790
    18.583


    2
    2.212
    2.167
    19.047
    18.179


    3
    2.231
    2.046
    19.755
    17.417


    Mean
    2.253
    2.166
    19.197
    18.059


    SD
    0.0549
    0.1196
    0.5000
    0.5916


    % CV
    2.44

    5.52

    2.60

    3.28


    % Mean          stability

      96.14

    94.07


    Acceptance    Criteria: The % mean solution stability for drug should be within range    90.00-110.00 %.
Table 11: Results for Stock solution Stability Study.
Conclusion
This study presents a simple and validated HPLC method for estimation of Etodolac from rat plasma.
References
- Indian Pharmacopoeia, Vol-II, 7th ed. Indian Pharmacopoeia Commission, Ghaziabad, 2014; 1718.
- RxList.
- Etodolac.
- Cheng J, Imanishi H, Liu W et al. Involvement of cell cycle regulatory proteins and MAP kinase signaling pathway in growth inhibition and cell cycle arrest by a selective cyclooxygenase 2 inhibitor, etodolac, in human hepatocellular carcinoma cell lines. Cancer Sci. 2004; 95: 666-673.
- Takeda J, Kitajima K, Fujii S et al. Inhibitory effects of etodolac, a selective COX-2 inhibitor, on the occurrence of tumors in colitis-induced tumorigenesis model in rats. Oncol Rep. 2004; 11: 981-985.
- Lynch S, Brogden RN. A preliminary review of its pharmacodynamic activity and therapeutic use. Drugs. 1986; 31: 288-300.
- Jadhav Shailaja B. et.al, Development and validation of stability indicating assay method of etodolac by using UV-visible spectrophotometer. Int. J. of Pharmaceutical and Chemical Sci. 2013; 2: 678-685.
- Balan et.al. Method development and validation of etodolac in tablet dosage form by UV-visible spectrophoscopy. Inventi Rapid Pharm Anal Qual Assu. 2011; 2: 112.
- Mohammed R. Koupai-Abyazani, et.al. Etodolac in Equine urine and serum: Determination by HPLC-UV detection, confirmation and metabolite identification by atmospheric pressure ionization mass spectroscopy. J. of Analytical toxicology. 1999; 23 : 209-220.
- Kallur HJ et.al. Simultaneous estimation of Etodolac and Paracetamol in bulk drug dosage form by RP-HPLC. IJAPA. 2013; 3: 56-67.
- Khandal Rakesh Kumar et.al. Development and Validation of a stability indicating reverse phase HPLC method for simultaneous determination of Etodolac and Paracetamol in its tablet dosage formulation. Int. J of Sci. Engin, and Tech. 2015; 4: 19046-19074.
- Claudio G, et.al. Gas chromatography-mass spectroscopy determination of Etodolac in human plasma following single epicutaneous administration. Biomed Chromatography. 1994; 8: 180-183.
- Validation of analytical procedures: text and methodology; Q2 (R1).