
Research Article
Austin J Anal Pharm Chem. 2016; 3(2): 1067.
Spectrodensitometric Determination of Certain Pharmaceutical Binary Mixtures Containing Angiotensin Converting Enzyme Inhibitors and Hydrochlorothiazide
Mohamed HA1, Khashaba PY1 and Shahin RY2*
1Pharmaceutical Analytical Chemistry Department, Faculty of Pharmacy, Assiut University, 71526 Assiut, Egypt
2Drug Research Center, Assiut University, 71526 Assiut, Egypt
*Corresponding author: Reem Y. Shahin, Drug Research Center, Assiut University, 71526 Assiut, Egypt
Received: June 23, 2016; Accepted: July 18, 2016; Published: July 20, 2016
Abstract
A validated HPTLC method was developed for the simultaneous determination of three angiotensin converting enzyme inhibitors namely enalapril maleate, moexipril HCl, and ramipril HCl, in binary mixture with hydrochlorothiazide. Separation was achieved on silica gel 60 F254 HPTLC plates using mobile phases: as chloroform- ethylacetate- methanol (10:1:5 v/v/v) for enalapril maleate : hydrochlorothiazide (Rf: 0.27: 0.67); ethylacetate-chloroformglacial acetic acid (8:2:0.2 v/v/v) for moexipril HCl: hydrochlorothiazide (Rf : 0.15 : 0.45); and benzene- methanol- glacial acetic acid (8:2.5:0.4 v/v/v) for ramipril HCl : hydrochlorothiazide (Rf: 0.50: 0.65). Measurements were recorded with UV densitometry at 223, 216 and 210 nm for the simultaneous determination of the three binary mixtures of enalapril maleate, moexipril HCl, and ramipril HCl each with hydrochlorothiazide, respectively. The proposed method was validated according to ICH and was found to be specific, accurate, precise and robust. It was also successfully applied to the simultaneous determination of EN; RAM each with HCT in tablet dosage form without interference from common excipients.
Keywords: Angiotensin converting enzyme; Hydrochlorothiazide; HPTLC; Binary mixtures
Introduction
High performance thin layer chromatography (HPTLC) is one of the most widely used techniques for the separation and identification of drugs. It is an ideal technique because of its simplicity, low cost, selectivity, and ability to be performed without a remote area (away from a laboratory) with limited volume of solvents. Angiotensin converting enzyme inhibitors (ACEIs) are commonly prescribed with the diuretic drug hydrochlorothiazide (HCT) in binary mixture for the treatment of essential hypertension, stable chronic heart failure, myocardial infarction and diabetic nephropathy. They are sometimes administered separately and commonly administered as binary mixture form in tablets. Enalapril (EN) (2S)-1-[(2S)-2-{[(2S)-1- ethoxy-1-oxo-4-phenylbutan-2-yl]amino}propanoyl]pyrrolidine-2- carboxylic acid, moexipril (MOX)(3S)-2-[(2S)-2-{[(2S)-1-ethoxy-1- oxo-4-phenylbutan-2-yl]amino}propanoyl]-6,7-dimethoxy-1,2,3,4- tetrahydroisoquinoline-3-carboxylic acid and ramipril (RAM) (2S,3aS,6aS)-1-[(2S)-2-{[(2S)-1-ethoxy-1-oxo-4-phenylbutan-2-yl] amino}propanoyl]-octahydrocyclopenta pyrrole-2-carboxylic acid (III), belong to the class of dicarboxylate containing group of ACEIs. Figure 1 shows the chemical structure of the studied drugs. The reported methods for the determination of the studied binary mixtures include ultraviolet (UV) derivative spectrophotometric methods [1-5], high performance liquid chromatography (HPLC) methods [6-10]. For our knowledge only one TLC method [11] was reported for simultaneous determination of EN-HCT, no methods were reported for the determination of binary mixtures of RAM or MOX with HCT by TLC. So the aim of work in this part depends on HPTLC separation of three binary mixtures: EN-HCT, RAMHCT, and MOX-HCT followed by simultaneous determination at their isoabsorbtive points in the range of 210-223 nm. Dosage forms containing ACEIs (EN or RAM) with HCT are available in the Egyptian, European and American markets, while -till now- MOX-HCT tablets aren’t available in the Egyptian market, but are available in the European and American markets such as Uritec® tablets. Therefore synthetic mixture of MOX-HCT was prepared in our laboratory and subjected to the proposed spectrodensitometric method. The proposed method was applied successfully for the assay of the studied binary mixtures in their pharmaceutical dosage forms.
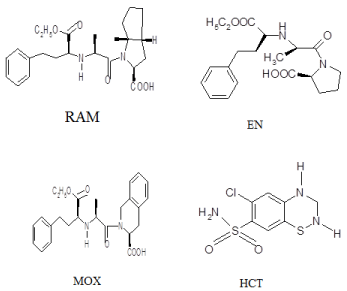
    Figure 1:  chemical structure of the studied the investigated ACEIs and
HCT.
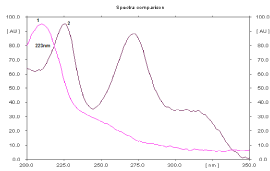
    Figure 2:  Absorption spectra of EN (1) and HCT (2) (concentration is 360 and
450 ng/spot respectively).
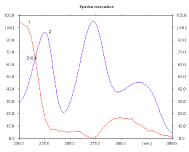
    Figure 3:  Absorbtion spectra of RAM (1) and HCT (2) (concentration is 360
and 1800 ng/spot respectively).
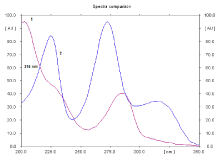
    Figure 4:  Absorbtion spectra of MOX (1) and HCT (2) (concentration is 540
and 900 ng/spot respectively).
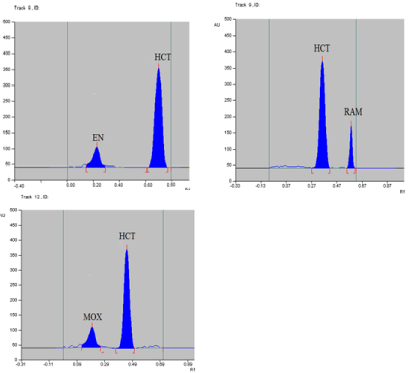
Figure 5: TLC-densitograms of the separated binary mixture containing the studied ACEIs and HCT.
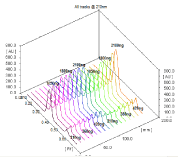
    Figure 6:  Spectrodensitometric analysis of Tritace comb® tablets for its
content of RAM (Rf 0.58) and HCT (Rf 0.35) {Tracks 10 to 18} compared with
standard solution of the indicated concentrations {Tracks 1 to 9}.
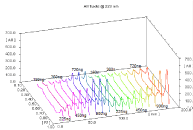
    Figure 7:  Spectrodensitometric analysis of Enalazide® tablets for its content
of EN (Rf 0.27) and HCT (Rf 0.67) {Tracks 10 to 18} compared with standard
solution of the indicated concentrations {Tracks 1 to 9}.
Experimental
Materials and reagents
Reagents: Methanol (Fisons Scientific, United Kingdom), chloroform, benzene (E-Merck, Dermstadt, Germany) was HPLC grade while glacial acetic acid, ethyl acetate and methanol (El-Nasr chemical Co., Cairo, Egypt) were analytical grade. Water used is double distilled water.
Pharmaceuticals: EN and HCT were supplied as a gift from Global-Nabi Pharmaceuticals, Egypt, MOX was supplied as a gift from Mina Pharm, Cairo, Egypt and RAM was supplied by quality control centre, Giza, Egypt. All drugs were checked for purity by pharmacoepial methods [12,13] and were found to be 99.67, 99.84, 100.94 and 101.02% for EN, MOX, RAM and HCT respectively. Enalazide® tablets were obtained from the local market (manufactured by Acapi pharmaceuticals, Cairo, Egypt). Each tablet is labeled to contain 10mg EN and 12.5mg HCT. Tritace Comb® tablets were obtained from the local market (manufactured by Aventis, Cairo, Egypt). Each tablet is labled to contain 5mg RAM and 25mg HCT.
Apparatus
- CAMAG TLC scanner with Linomat 5 (Muttenz, Switzerland).
- High performance thin layer chromatographic aluminium sheets (precoated silica gel GF254 plates 20x20 cm, 0.2mm layer thickness) (E. Merck, Darmstadt, Germany).
- UV lamp short wavelength 254 nm (Vilber Lournate 220V, 50Hz, Marne-la-Valle’e cedex, France).
-Thin layer chromatographic spotting syringe (25μL) (Hamilton, LKB, Bromma, Sweden).
-TLC tank (27.0cm width x 26.5cm height x 7.0cm diameter) (Sigma-Aldrich Co., USA).
Preparation of standard synthetic mixture
Standard preparation: An accurately weighed amount of 30, 37.5 mg of EN and HCT, 10, 50 mg of RAM and HCT and 15, 25 mg of MOX and HCT each as a separate binary mixture was transferred into 50ml volumetric flask containing 25ml methanol, shaken for five minutes and sonicated for another five minutes. the mixture was then completed to volume with methanol, then aliquot volumes 1.0, 2.0, 3.0, 3.5, 4.0, 4.5 ml (EN-HCT), 1.3, 3.5, 4.5, 6.0, 7.0, 9.0 ml (RAM and HCT), and 2.5, 3.0,5.0, 6.0, 8.0. 9.0 ml (MOX-HCT) of the prepared synthetic mixture was transferred into 10ml volumetric flask and completed to the mark with methanol.
Preparation of sample solution
Ten tablets were weighed, finely powdered and mixed thoroughly. An accurately weighed amount of the powder obtained equivalent to 30mg EN and 37.5mg HCT (Enalazide tablets) and 10 mg RAM and 50mg HCT (Tritace comb tablets) were each transferred into 50ml volumetric flask, dissolved in about 25ml methanol and sonicated for 15 minutes . The solution was diluted to volume with methanol, then it was filtered and the first portion of the filtrate was rejected. The procedure was completed as under standard preparation starting from (aliquot volumes …..).
Chromatographic conditions
One hundred milliliters of the mobile phase were poured into TLC tank that was lined with thick filter paper to help saturation of the tank. The tank was then tightly covered with a lid and presaturated with mobile phase system vapors for at least 30 min at room temperature (25 ± 1°C) before use. The size of the plate used directly for the analysis was 10cm x 10cm. The samples were spotted in the form of bands of 6mm width with CAMAG micro liter syringe on silica gel F254 nm (10cm x 10cm with 0.2mm thickness; E. Merck, Germany) using CAMAG Linomat 5. A constant application rate of 150nL s-1 was employed, and space between bands was 1.0cm. The sample-loaded TLC plate was transferred to the TLC tank, and the plate was then developed until the solvent front moved about threefourth of the length of the plate (about 10min). The TLC plate was taken off and air-dried for 5min. The slit dimension was kept at 6mm x 0.45mm, using CAMAG TLC scanner in reflectance-absorbance mode. The source of radiation used was deuterium lamp emitting radiation in the range of 190nm to 350nm.
General procedure
Three microliters of the working standard solutions were spotted on the start line of the TLC plate using the specified TLC Hamilton syringe. The plate was then allowed to be air dried for 5 minutes before its transfer to the TLC tank for the development. The mobile phase used was: chloroform: ethyl acetate: methanol (50:5:25) for EN_HCT mixture, benzene: methanol: glacial acetic acid (80:25:0.4) for RAM-HCT mixture and chloroform: ethyl acetate: glacial acetic acid (80:20:2) for MOX-HCT mixture. Ascending development was performed in the TLC chamber; the mobile phase migration distance in all experiments was 9.0 cm. The plate was then air- dreid for about 5 minutes. Then it was measured using TLC scanner at the following wavelengths, taking the isoabsorbtive point for the measurement of the studied mixtures: EN-HCT (223nm), RAM-HCT (210nm) and MOX-HCT (216nm).
Results and Discussion
Optimization of chromatographic conditions
Mobile phase: Different solvent systems were tried for the separation of each of the studied mixtures. Compact spots and complete separation of all studied drugs were obtained using mixture of chloroform- ethylacetate- methanol (10:1:5 v/v/v), benzenemethanol- glacial acetic acid (8:2.5:0.4 v/v/v) and ethylacetatechloroform- glacial acetic acid (8:2:0.2 v/v/v) for EN-HCT, RAMHCT and MOX-HCT respectively.
Spectral analysis: Absorption spectra of each studied binary mixture were recorded at wavelengths from 200-350 nm to determine isoabsorptive points which was found to be 223nm, 210nm and 216nm for EN- HCT, RAM-HCT and MOX-HCT mixtures respectively. Figures (2-4) show absorbtion spectra of the studied drugs after scanning with Camag TLC scanner, while Figure 5 shows densitograms of the separated binary mixtures.
Analytical method validation
The method was validated according to the International Conference on Harmonization (ICH) guidelines on validation of analytical methods [14], and complied with USP validation guidelines [15]. All results were expressed as percentages, where n represents the number of values. For the statistical analysis, Excel 2007 (Microsoft Office) was used. A 5% significance level was selected. The developed TLC method was validated for the following parameters:
Linearity: The linear regression data [16] for three calibration curves show good linear relationship over the concentration ranges cited in Table 1. The detection limits for ACEIs and HCT were 28.76- 36.2 and 27.71- 67.51 ng/spot respectively. While the quantitation limits were 87.15- 90.84 and 83.96- 165 ng/spot for ACEIs and HCT, respectively. Calibration curves for both methods had excellent correlation coefficients for all the studied mixtures.
    Validation    parameter
    EN-HCT
    MOX-HCT
    RAM-HCT


    EN
    HCT
    MOX
    HCT
    RAM
    HCT


    Linearity range    (ng/spot)
    90-540
    450-2700
    150-810
    187.5-1012.5
    225-810
    375-1350


    Correlation    coefficient° (r) ± SD
    0.9993
      ± 2.97×10⁻³
    0.9999
      ± 0.14×10-
    0.9995
      ± 0.03×10-
    0.999
      ± 0.11×10⁻³
    0.9987
      ± 0.03×10-
    0.9953± 0.23×10⁻³


    Slope ± SD°
    4.83 ± 0.05
    9.1
      ±  0.21
    4.4
      ±  0.07
    7.34
      ± 0.12
    4.04±  0.10
    2.70 ± 0.13


    Intercept ± SD°
    346.93
      ± 31.51
    2184.99
      ± 150.15
    487.913
      ± 36.70
    1953.35
      ± 111.29
    -30.4707
      ± 35.21
    1893.56±22.67


    [LOD]* (ng/spot)
    21.52
    54.45
    29.98
    67.51
    28.76
    27.71


    [LOQ]** ( ng/ spot)
    65.21
    165
    90.84
    151.6
    87.15
    83.96


    Standard deviation of three results. *LOD: Limit of detection.    **LOQ: Limit of quantitation.
Table 1: Quantitative parameters of the spectrodensitometric determination of ACEIs–HCT binary mixtures.
Accuracy: Applying the suggested spectrodensitometric procedure for the analysis of commercially available tablets (Tritace comb®, Enalazide® tablets) validated the accuracy of the proposed method. Table 2 shows mean percentage recoveries of 99.22- 100.89 (± 0.96- 1.62) of the labeled amount. This indicates an excellent concordance between experimental and nominal values. The performance of the current method was judged by comparing with other UV-derivative spectrophotometric methods. According to the variance ratio test (F-test), and t-test, the calculated values of F and t listed in Table 2 indicate there is no significant difference between the proposed and reported method [3,5] with respect to precision and accuracy. Figures 6 and Figures 7 show the developed HPTLC plate for RAM-HCT and EN-HCT in their respective dosage forms.
    Pharm.
      formulation
    Authentic drug
    % Recovery ± SDa
    t-valueb
    F-valueb
    Ref.


    Proposed
    Reported


    Enalazide®
    EN
    99.8 ± 0.96
    99.7 ± 1.32
    0.95
    1.53
    [14]


    HCT
    99.2 ± 1.22
    100.6± 0.54
    2.08
    2.14


    Trtace Comb®
    RAM
    99.6 ± 1.62
    98.6 ± 1.06
    0.35
    2.33
    [16]


    HCT
    100.9 ± 1.13
    100.5± 1.19
    0.68
    1.9


    aStandard deviation of three results. bTheoritical value for t and F at 95%    confidence limit, t= 2.447 and F= 9.28.
Table 2: Accuracy of the proposed spectrodensitometric method for the analysis of the studied binary mixtures in tablets.
Precision: Repeatability of the sample application and measurement of the optical density, expressed as peak area were carried out using six replicates of the same spot at three concentration levels. These ranges cover the low, medium and higher ranges of the calibration curve (six replicates of each concentration). The inter-day and intra-day precisions were evaluated by the corresponding peak areas. The obtained results (Table 3) proved good precision of the proposed assay method with %RSD ≤1.5.
    Studied
      mixture
    Angiotensin    converting enzyme inhibitors
    Hydrochlorothiazide


    Intra-day precision
    Inter-day precision
    Intra-day precision
    Inter-day precision


    Conc.
      (ng/spot)
    %Recovery*
      ± SD
    CV
    Recovery*
      ± SD
    CV
    Conc.
      (ng/spot)
    %Recovery*
      ± SD
    CV
    Recovery*
      ± SD
    CV


    RAM-HCT
    120
    99.6 ± 0.89
    0.89
    101.3 ± 1.33
    1.31
    600
    99.9 ± 1.23
    1.23
    97.5 ± 1.42
    1.46


    360
    101.1 ± 1.03
    1.02
    99.6 ± 0.43
    0.43
    1800
    99.2 ± 0.89
    0.9
    99.7 ± 0.68
    0.68


    420
    100.8 ± 0.24
    0.24
    101.6 ± 1.41
    1.39
    2100
    97.1 ± 0.27
    0.28
    99.8 ± 0.53
    0.53


    EN-HCT
    180
    97.9 ± 1.72
    1.76
    97.7 ± 2.30
    2.35
    225
    97.3 ± 0.57
    0.59
    98.4 ± 1.78
    1.81


    360
    100.6 ± 2.24
    2.23
    100.2 ± 1.39
    1.39
    450
    98.5 ± 2.41
    2.45
    98.1 ± 1.55
    1.58


    720
    98.4 ± 2.35
    2.39
    98.6 ± 1.30
    1.32
    900
    98.2 ± 1.70
    1.73
    99.2 ± 1.67
    1.68


    MOX-HCT
    270
    98.6 ± 2.50
    2.54
    100.7 ± 3.15
    3.13
    450
    99.7 ± 1.24
    1.24
    100.0 ± 1.31
    1.31


    540
    97.1 ± 0.93
    0.96
    99.7 ± 0.88
    0.88
    900
    97.8 ± 1.42
    1.45
    99.8 ± 1.46
    1.46


    720
    98.9 ± 0.75
    0.76
    99.4 ± 1.42
    1.43
    1200
    99.6 ± 1.53
    1.54
    99.6 ± 0.96
    0.96


    *Average of six replicates.
Table 3: Intraday and interday precision of the proposed spectrodensitometric method for ACEIs-HCT binary mixtures.
Sensitivity: The sensitivity of the method was determined in terms of linear range, limit of detection (LOD) and limit of quantitation (LOQ) for all components of the studied mixtures: LOD or LOQ= K. SDa/b Where K is a numerical constant, K= 3.3 for LOD, K= 10 for LOQ, SDa is the standard deviation of the intercept and b is the slope of the calibration curve. The limit of detection and quantitation for all the studied drugs indicate high sensitivity of the proposed method as shown in Table 1.
Robustness: Robustness was examined by evaluating the influence of small variation in the experimental parameters on the analytical performance of the proposed method [17]. The studied parameters were: percent composition of the mobile phase, time from spotting to development and time from development to scanning (Tables 4 and 5). It was found that slight variation of these variables didn’t significantly affect the performance of the method, indicating that the proposed method is robust.
    variables
    MOX-HCT


    MOX*
    HCT*


    %Recovery** ± SD
    CV
    %Recovery** ± SD
    CV


    No variation
    100.7 ± 1.02
    1.01
    99.1 ± 0.98
    0.99


    % composition of    mobile phase (± 10%)
    100.7 ± 2.01
    2
    99.4 ± 0.45
    0.45


    Time from spotting    to development (5±1 min.)
    99.2 ± 1.36
    1.37
    99.6 ± 0.13
    0.13


    Time from    development to scanning (5±1 min.)
    99.9 ± 1.61
    1.61
    100.2 ± 0.76
    0.76


    *Drug concentration is (540,900) for MOX-HCT respectively.    **Average of four replicates.
Table 4: Robustness of the proposed spectrodensitometric method for the determination of the investigated binary mixtures (MOX-HCT).
    Variables
    RAM-HCT
    EN-HCT


    RAM*
    HCT*
    EN*
    HCT*


    %Recovery**
      ± SD
    CV
    %Recovery**
      ± SD
    CV
    %Recovery**
      ± SD
    CV
    %Recovery**
      ± SD
    CV


    No variation
    100.1 ± 1.27
    1.27
    100.6 ± 1.83
    1.82
    100.9 ± 1.29
    1.29
    100.3 ± 1.46
    1.46


    % Composition of    mobile phase (± 10%)
    102.4 ± 1.43
    1.4
    100.9 ± 0.24
    0.24
    99.5 ± 2.45
    2.46
    97.7 ± 1.40
    1.43


    Time from spotting    to development (5±1 min.)
    97.0 ± 1.28
    1.32
    98.1 ± 0.93
    0.95
    101.0 ± 1.34
    1.33
    99.8 ± 1.90
    1.9


    Time from    development to scanning (5±1 min.)
    99.9 ± 0.76
    0.76
    101.2 ± 0.16
    0.16
    97.2 ± 3.15
    3.24
    99.9 ± 0.57
    0.57


    *Drug concentration is (360, 1800) and (360, 450) for    RAM-HCT, EN-HCT respectively. **Average of four replicates.
Table 5: Robustness of the proposed spectrodensitometric method for the determination of the investigated binary mixtures (RAM-HCT and EN-HCT).
Conclusion
HPTLC-spectrodensitometric method was developed for the separation and quantitative determination of binary mixtures of EN and RAM with HCT in pure and tablet dosage form (Tritace comb ® and Enalazide ® tablets), and MOX with HCT in synthetic mixture. The proposed method is the first spectrodensitometric method for the simultaneous determination of RAM-HCT and MOX-HCT binary mixtures. The proposed spectrodensitometric method is highly sensitive comparing to reported UV derivative spectrophotometric methods (14) (16) with lower detection limit. Therefore it can be routinely applied for the assay of the studied binary mixtures in pharmaceutical dosage forms and in quality control laboratories.
References
- Chandwani OD, Dahibhate PP, Kadam SS, Dhaneshwar SR. Simultaneous spectrophotometric estimation of enalapril maleate and hydrochlorothiazide. Indian Drugs. 1996; 33: 401–402.
- El Walily AF, Belal SF, Heaba EA, El Kersh A. Simultaneous determination of enalapril maleate and hydrochlorothiazide by first-derivative ultraviolet spectrophotometry and high-performance liquid chromatography. J. Pharm. Biomed. Anal. 1995; 13: 851-856.
- Stolarczyk M, Maślanka A, Krzek J, Milczarek J. Application of derivative spectrophotometry for determination of enalapril, hydrochlorothiazide and walsartan in complex pharmaceutical preparations. Acta Pol. Pharm. 2008; 65: 275-281.
- Ertürk S, Cetin SM, Atmaca S. Simultaneous determination of moexipril hydrochloride and hydrochlorothiazide in tablets by derivative spectrophotometric and high-performance liquid chromatographic methods. J. Pharm. Biomed. Anal. 2003; 33: 505-511.
- Bankey S, Tapadiya GG, Saboo SS. Simultaneous Determination of Ramipril, Hydrochlorothizide and Telmisartan by Spectrophotometry. Int. J. Chem Tech Research. 2009; 1: 183-188.
- Shetkar PB, Shinde VM. High performance liquid chromatographic technique for determination of some pharmaceutical dosage forms. Anal. Lett. 1997; 30: 1143-1152.
- Erdal D, Abdil Ö. Linear regression analysis and its application to multivariate chromatographic calibration for the quantitative analysis of two-component mixtures. Farmaco. 2005; 60: 591-597.
- Manna L, Valvo L, Alimonti S. A liquid chromatographic lon-pairing method for simultaneous determination of benazepril hydrochloride, fosinopril sodium, ramipril and hydrochlorothiazide in pharmaceutical formulations. Chromatographia. 2001; 53: S271-S275.
- Belal F, Al-Zaagi IA, Gadkariem EA, Abounassif MA. A stability-indicating LC method for the simultaneous determination of ramipril and hydrochlorothiazide in dosage forms. J. Pharm. Biomed. Anal. 2001; 24: 335-342.
- Zarapkar SS, Rane SH. Reverse phase high-performance liquid chromatographic determination of ramipril and hydrochlorothiazide in tablets. Indian Drugs. 2000, 37, 589-593.
- Stolarczyk M, Anna M, Krzek J. Chromatographic and Densitometric Analysis of Hydrochlorothiazide, Walsartan, Kandesartan, and Enalapril in Selected Complex Hypotensive Drugs. J. Liq. Chromatogr. Relat. Technol. 2008; 31: 1892-1902.
- Dominic P, Brenner GS. Analytical profile of drug substances, 16th Edition, Academic Press. 1987; 207-243.
- Clarck's analysis of drugs and poisons. Pharmaceutical Press, London. 2005; 1412, 1523.
- International Conference on Harmonization (ICH), Topic Q2 (R1): Validation of Analytical Procedures: Text and Methodology, 2005.
- The United States Pharmacopoeia, the National Formulary, 31st Edition, US Pharmacopoeia convention, Washington, D.C, 2012, pp. 236, 2056, 2538, 3156.
- Harris Quantitative Chemical Analysis. 8th Edition, Philidelphia, America, 2010, pp. 101, 106, 114, 425.
- Heyden YV, Nijhuis A, Smeyers-Verbeke J, Vandeginste BGM, Massart DL. Guidance for robustness/ruggedness tests in method validation. J. Pharm. Biomed. Anal. 2004; 24: 723-753.