
Research Article
Austin J Anal Pharm Chem. 2016; 3(3): 1069.
Extractive Spectrophotometric Methods for the Determination of Metaprolol Succinate in Pure and Pharmaceutical Formulations
Lokesh KS1*, Mallikarjuna H2, Shivaprasad KH1 and Venugopala Reddy KR1
1Department of Chemistry, Vijayanagara Sri Krishnadevaraya University, Vinayakanagara, Cantonment, Ballari, Karnataka, India
2Department of Industrial Chemistry, Jnana Sahyadri, Kuvempu University, Shankaraghatta, Karnataka, India
*Corresponding author: Koodlur Lokesh, Department of Chemistry, Vijayanagara Sri Krishnadevaraya University, Vinayakanagara, Cantonment, Ballari, Karnataka, India
Received: July 12, 2016; Accepted: July 25, 2016; Published: July 28, 2016
Abstract
Two simple, rapid and sensitive extractive spectrophotometric methods have been developed for the assay of metaprolol succinate (MPS) in pure and pharmaceutical formulations. These methods were based on the formation of chloroform soluble ion-association complexes of MPS with bromocresol green (BCG) in NaOAc-HCl buffer of pH 3.29 [Method A] and with bromophenol blue (BPB) in KCl-HCl buffer of pH 2.2 [Method B]. The coloured products have absorption maxima at 415 nm and 412 nm for method A and method B, respectively. The coloured products obeyed Beer’s law in the concentration ranges of 0.2-8.2 and 0.1-6.5 μgml-1 for methods A and B, respectively. The molar absorptivity values as obtained from Beer’s data were found to be 5.6x10⁴ and 7.01x10⁴ l.mol-1cm-1 while Sandell’s sensitivity values were calculated to be 11.64 and 9.30 ng cm-2 for method A and method B, respectively. No interference was observed from common excipients present in pharmaceutical formulations. The methods were successfully applied for the analysis of pharmaceutical formulations.
Keywords: Metaprolol succinate; Spectrophotometry; Assay; Ionassociation; Formulations
Introduction
Drugs are important sources to relieve the pain and cure diseases when they are in proper and appropriate dosage form. Hence, it is very essential to control and monitor the quality of the synthesized bulk drug as well as the formulations accurately. Analytical chemistry in particular, helps in the quality assurance and control of bulk drug and their dosage forms [1,2]. The pharmaceutical industries employ various analytical techniques to determine not only the active ingredient (s) but also the quantification of related compounds or impurities in drug as well as formulations. This is essential to reduce the side effects from impurities and to increase the efficiency of drug molecule. The assay and purity of drug samples in bulk and formulations may be determined by means of physical, chemical, physico-chemical and biological methods [1-8]. Physical and physicochemical methods are simple and more commonly employed. The literature methods for the analysis of drugs often need improvement to suit laboratory requirements and upgradation of facilities available in a particular laboratory set up. The modern and advanced methods of analysis (HPLC, GLC, NMR and Mass) offer good speed, precision and accuracy, but they involve sophisticated equipments which are costly and pose problems of maintenance [1,3]. Hence, small scale industries, which produce bulk drugs and pharmaceutical formulations, are not able to utilize those advanced methods of analysis. Among various analytical techniques, spectrophotometry still plays a significant role in the determination of compounds at micro or nanogram levels [2]. It is simple, economically viable and easy to carry-out. The importance of a spectrophotometric method lies in the chemical reaction(s) upon which the procedures are based, rather than upon the sophistication of the instrument. Many reactions which absorb UV radiation or yield colored species for a particular drug are found to be selective or can be rendered selective by controlling and optimizing the reaction conditions. Hence, spectrophotometry is generally preferred in small scale industries and most of the laboratories for routine quality assurance [9].
Metaprolol succinate (MPS), chemically designated as (±) -1-(isopropylamino)-3-[P (2-methoxyethyl) phenoxyl]-2-propanol succinate, is a kind ofβ adrenaline receptor blocker. It is widely used for the treatment of hypertension, angina, miocardial infarction, arrhythmia, hyperthyroidism and other related diseases [10-12]. It is so sensitive that even a small oral dose of the drug gives sufficient blockade. Since theβ- blockers are misused as doping agents in sports, these drugs have been added to the list of forbidden drugs by the International Olympic Committee [13]. It is official in various pharmacopoeias [10-12]. In view of its biological importance, several analytical methods have been reported for quantitative determination of MPS [14-25] which include gas chromatographic [14-15], highperformance liquid chromatographic [16-18] and spectrophotometric methods [19-25].
The reported spectrophotometric methods suffer from different limitations viz., less sensitivity [19-24], work only at higher concentration of the drug [19,24], require heating at 700C for 10min [22] and long standing [21,23,25]. In view of this, it was planned to develop sensitive spectrophotometric methods for the determination of MPS in bulk and pharmaceutical formulations. The proposed extractive spectrophotometric methods are based on the formation of chloroform soluble ion-association complexes of MPS with bromocrecol green (BCG) and bromophenol blue (BPB) in acidic buffer. These methods are more sensitive and simple compared to reported spectrophotometric methods.
Experimental
Reagent preparation
Standard drug solution: A stock solution of MPS containing 100 μgml-1 was prepared in distilled water and diluted as and when required. The solution was stable at room temperature.
Preparation of dye solution: 0.5 % (w/v) of bromocrecol green (BCG) and bromophenol blue (BPB) were prepared by dissolving 500 mg each in distilled water and volume made up to 100 ml with distilled water.
Buffers: Different buffers were prepared following the standard methods reported earlier [26-28].
Recommended procedures
In order to know the effect of various parameters involved in the formation of coloured products (as described under results and discussion), a detailed study was carried out and the following procedures were recommended for the assay of MPS in pure and pharmaceutical formulations.
Assay procedure for pure drug: Suitable amounts of aliquot of pure MPS solution containing 0.2-8.2 μgml-1 for method A or 0.1- 6.5 μgml-1 for method B were transferred into a series of 125ml of separatory funnels. A volume of 3 ml of NaOAc-HCl buffer of pH 3.29 for method A or 3ml of KCl-HCl buffer of pH-2.2 for method B and 5ml of BCG or 7ml of BPB were added to each separatory funnel. It was diluted to 25ml with distilled water. Chloroform (10 ml) was added to each of the separating funnels; the contents were shaken well and allowed to stand at room temperature for 2min for the separation. The two phases were allowed to separate and the chloroform layer was passed through anhydrous sodium sulphate and transferred to 10ml volumetric flask, then the extract was made upto the mark with chloroform and mixed well. The absorbance of yellow coloured complexes were recorded at 415nm and 412nm against the corresponding reagent blank for method A and method B, respectively. A calibration graph was constructed.
Assay of pharmaceutical preparations: Ten tablets were weighed and powdered. An amount of the powder equivalent to 25mg of MPS weighed accurately and transferred into a 100ml beaker. Using the mechanical stirrer, the powder was completely disintegrated in distilled water. The solution was filtered through a Whatman filter paper number 40 to remove the insoluble matter. The filtrate was transferred into a 100ml volumetric flask and diluted to the mark with distilled water. Suitable volume of the filtrate was further diluted as and when required. Appropriate aliquot was taken and analyzed using the procedure given above.
Results and Discussion
Metaprolol succinate (MPS) is a white crystalline powder having molecular formula C34H56N2O10. It is practically insoluble in ethyl acetate, very slightly soluble in dichloromethane and soluble in water and methanol. It is a beta 1-selective (cardio selective) adrenergic receptor blocking agent. Its structure is given in Figure 1.
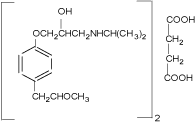
Figure 1: Molecular structure of Metaprolol succinate.
Extractive spectrophotometric procedures are popular for their sensitivity in the assay of drugs. Hence, ion-pair extractive spectrophotometry has received a considerable attention for the quantitative determination of many pharmaceutical compounds [29- 30]. Secondary amine group of MPS undergoes protonation in acidic medium. Anionic dyes such as BCG and BPB form ion-association complexes with the positively charged drug. The drug to dye stoichiometric ratio as calculated by the Job’s method of continuous variation [31] was found to be 1:1 with BCG/BPB. Each drug-dye complex, with two oppositely charged ions behaves as a single unit held together by an electrostatic force of attraction.
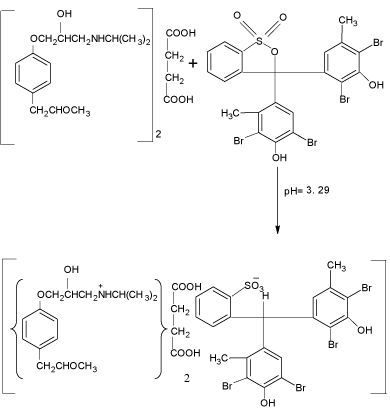
    scheme 1:  Probable reaction mechanism for the formation of MPS–BCG
complex.
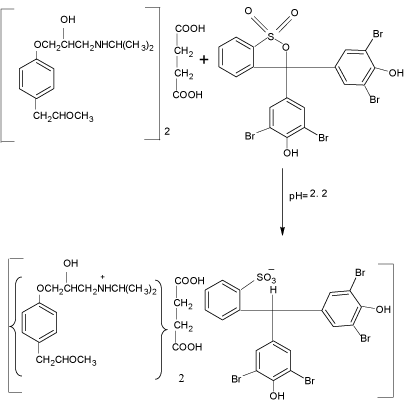
    scheme 2:  Probable reaction mechanism for the formation of MPS–BPB
complex.
The MPS reacted with BCG and BPB in acidic buffer to form chloroform- soluble yellow coloured 1:1 ion-association complex, which exhibited absorption maxima at 41nm (Figure 2) and 412nm (Figure 3) for method A and method B, respectively. Under similar experimental conditions, the reagents blank showed negligible absorbance thereby permitting good analytical conditions for quantitative determination of MPS. The probable reaction mechanism for the formation of ion-pair complexes MPS–BCG and MPS–BPB are given in Schemes 1 and Schemes 2.
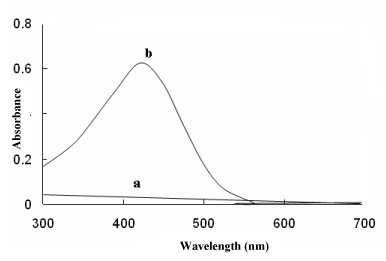
    Figure 2:  Absorbance spectra of (a) reagent blank and (b) ion- association
complex of MPS (7 μgml-1) with BCG.
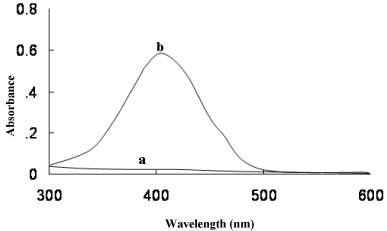
    Figure 3:  Absorbance spectra of (a) reagent blank and (b) ion- association
complex of MPS (7 μgml-1) with BPB.
Fixation of parameters
The optimum reaction conditions were established by varying the parameter one at a time keeping the others constant and the effects produced on the absorbances of the coloured species [32] were observed. The effects of various parameters for both methods viz., the pH of buffer solution, the amount of buffer solution, the concentration of dye (BCG or BPB), the amount of dye, choice of extractant and effect of temperature on the coloured complexes were investigated.
Effect of buffer/ pH: The effect of pH was studied by extracting the coloured complexes in presence of various buffers such as KCl- HCl (pH=1.0-2.2), NaOAc-HCl (pH=1.99-4.92), NaOAc-AcOH (pH=3.72-5.57) and potassium hydrogen phthalate-HCl (pH= 2.2- 3.6). It was noticed that the maximum colour intensity and constant absorbances were observed in NaOAc-HCl of pH 3.29 for BCG and in KCl-HCl buffer (Clark and Lubs) of pH 2.2 for BPB (Figure 4). Further, 3 ml of NaOAc-HCl of pH 3.29 for BCG and 3ml of KCl- HCl buffer of pH 2.2 for BPB gave maximum absorbances and reproducible results. Low absorbance values were observed at pH values higher or lower than the stated above for BCG and BPB in the corresponding buffer medium. Hence, NaOAc-HCl buffer of pH 3.29 and Clark and Lubs buffer of pH 2.2 for both methods were selected for all subsequent measurements.
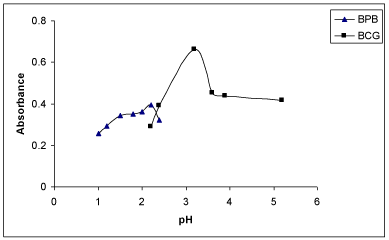
    Figure 4:  Effect of pH of the buffer on absorbance of the ion-association
complexes of MPS with BCG and BPB.
Effect of reagent: In order to examine the effect of the reagents (BCP and BPB), the absorbances of solutions containing a fixed concentration of MPS and different amounts of the respective reagent were measured separately. It was noticed that the constant and maximum absorbance values were obtained with 3.0 ml of 0.5% BCP or 3.0ml of 0.5% BPB (Figure 4). The absorbances decreased with increase in concentration of the corresponding reagent.
Choice of extractant: Several organic solvents viz., chloroform, carbon tetrachloride, ethyl acetate, xylene, diethylether, butyl acetate, toluene, dichloromethane and chlorobenzene were tried for effective extraction of the coloured species from aqueous phase. Only partial extraction of the complex was achieved with solvents other than chloroform. Chloroform was found to be the most suitable extractant as it was observed that only one extraction was adequate to achieve a quantitative recovery of the complex. Shaking times of 0.5 to 2 min produced constant absorbances and hence a shaking time of 1min was maintained throughout. There was no appreciable change in the absorbance or colour of the product even if the order of addition of the reactants was varied.
Effect of temperature on the coloured complexes: The effect of temperature on coloured complexes was studied at different temperatures. The coloured complexes were found to be stable up to 34°C. At higher temperatures, the absorbances of the coloured complexes increased due to volatile nature of chloroform. However, the complexes were stable for more than 1.5h at room temperature.
Spectral characteristics
Absorption spectra of yellow coloured MPS-BCG and MPS-BPB complexes are shown in Figure 2 and Figure 3. The corresponding reagents blank exhibited practically negligible absorbances thereby permitting good analytical conditions for quantitative determination of MPS.
Detection and quantification limits: The LOD values were found to be 0.057 and 0.027 μgml-1 while those of LOQ values were observed to be 0.19 and 0.09 μgml-1 for MPS with BCG and BPB, respectively. These values indicated that the BPB method was more sensitive compared to BCG method. In general, low values of LOQ revealed good accuracy of the proposed methods (Figure 5).
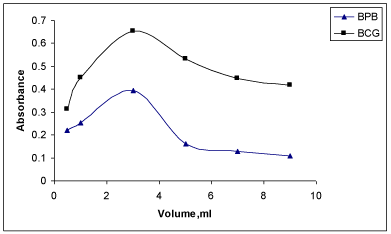
    Figure 5:  Effect of reagent on absorbance of the ion-association complexes
of MPS with BCG and BPB.
Quantification: The Beer’s law limits, molar absorptivity and Sandell’s sensitivity values were evaluated (Table 1). Regression analyses of Beer’s law plots at their respective λmax values revealed a good correlation. Graphs of absorbance versus concentration showed almost zero intercept, and are described by regression equation, Y= a+bX (where Y is the absorbance of a 1cm layer, b is the slope, a is the intercept and X is the concentration of drug in μgml-1) obtained by least-squares method. The results are summarized in Table 1.
    Parameters
    Values for


    BCG
    BPB


    λmax (nm)
    415
    412


    Beer’s law limits (µgml-1)
    0.2-8.2
    0.1-6.5


    Molar absorptivity (l/ mol/ cm) ×104
    5.6
    7.01


    Sandell’s sensitivity (ng cm-2)
    11.64
    9.302


    Correlation co-efficient (r)
    0.9995
    0.9990


    Regression equation (Y)a
    --------
    -------


    Slope (b)
    0.0845
    0.0965


    Intercept (a)
    0.0068
    0.096


    Relative standard deviation (%)d
    0.82
    0.93


    % Errord
    1.09
    1.35


    Limit of detection (µgml-1 )
    0.057
    0.027


    Limit of quantification (µgml-1 )
    0.19
    0.09


    a Y=a+bX , where X is the    concentration of the drug in µgml-1.
      dAverage of five    determinations.
Table 1: Optical characteristics, precision and accuracy data.
Precision and accuracy: The precision and accuracy of the proposed methods were checked by analyzing five replicates of the drug within Beer’s law limits. The low percentage error and RSD values highlighted good accuracy and precision of the proposed methods (Table 1, Figure 6).
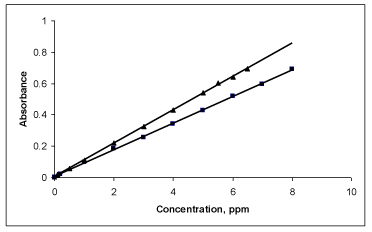
Figure 6: Beer’s law plot of MPS for and BPB. (▲) and BCG (■).
Recovery studies: Recovery studies were carried out by standard addition method. For this, known quantities of pure MPS were mixed with definite amounts of pre-analyzed formulations and the mixtures were analyzed as before. The total amount of the drug was then determined and the amount of the added drug was calculated by difference. The average percent recoveries obtained were quantitative (99.55-100.23%), indicating good accuracy of the methods.
Interference studies: The effects of common excipients and additives viz., starch, glucose, dextrose, lactose, magnesium stearate, gum acacia and talc (at the levels generally present in pharmaceutical formulations) were tested for their possible interferences in the assay of MPS and the results are shown in Table 2, for a representative dye, BPB. It is evident that the excipients and additives did not interfere in the determination of MPS.
    Excipients added
    Amount (mg) a
    % Recovery of MPS ± %RSDb


    Starch
    30
    99.3 ± 1.02


    Glucose
    40
    100.4 ± 0.92


    Dextrose
    40
    99.7 ± 0.96


    Lactose
    40
    101.0 ± 0.98


    Magnesium stearate
    30
    99.2 ± 0.95


    Talc
    40
    99.4 ± 1.10


    Gum acacia
    40
    99.8 ± 0.86


    a4μg ml-1 of MPS was taken.
      bAverage of five determinations.
Table 2:  Determination of MPS in presence of excipients and additives using
BPB.
Ruggedness: To ascertain the ruggedness of the methods, five replicate determinations at different concentration levels of the drug were carried out. The within-day assay RSD values were found to be less than 1.15%. The values of between-day assay RSD for different concentrations of drug are given in Table 3. These values revealed that the proposed methods have reasonable ruggedness.
    Formulation
    Label claim (mg)
    Amount (found in mg)*
    RSD%


    BCG
    BPB
    BCG
    BPB


    Seloken-XLa
    25
      50
      100
    24.88
      50.20
      99.73
    24.92
      50.48
      100.08
    0.82
      0.58
      0.20
    0.91
      0.46
      0.32


    Metolarb
    25
      50
      100
    24.82
      50.32
      100.30
    24.86
      49.88
      99.76
    0.26
      0.32
      0.44
    0.41
      0.52
      0.24


    Meto-FRc
    25
      50
      100
    24.80
      49.92
      99.36
    25.03
      50.61
      100.08
    0.17
      0.61
      0.44
    0.23
      0.56
      0.37


      *Average of five determinations.
      aAstra Zeneca, India, Ltd.
      bCipla pharmaceuticals Ltd.
      cMono pharmaceuticals Ltd.
Table 3: Between-day precision of the assay of MPS by proposed methods.
Analysis of pharmaceutical formulations and statistical comparison of the results with official method [10]
The proposed methods were successfully applied to the analysis of MPS in tablets. The results of analysis of pharmaceutical formulations (Table 4) were compared statistically by Student t-test and by the variance ratio F-test with those obtained by official method [10]. The Student t-values at 95% confidence level did not exceed the theoretical value indicating that there was no significant difference between the proposed and official methods. It was also observed that the variance ratio F-values calculated for p=0.05 did not exceed the theoretical value indicating that there was no significant difference between the precision of the proposed and reported methods.
    Formulation
    Label claim     (mg)
    %Recovery * ± %RSD


    Official method1
    BCG
    BPB


    Seloken-XLa
    25
    99.89 ± 0.69
    99.74 ± 0.62
      F = 1.23; t = 1.42
    99.81 ± 0.66
      F = 1.13; t = 1.64


    50
    99.84 ± 0.59

    98.96 ± 0.54
      F = 1.19; t = 1.54
    99.35 ± 0.62
      F = 1.31; t = 1.56


    100
    98.92 ± 0.84
    98.69 ± 0.66
      F = 1.61; t = 1.48
    99.02 ± 0.53
      F = 1.50; t = 1.56


    Metolarb
    25
    99.53 ± 0.74
    99.78 ± 0.63
      F = 1.38; t = 1.64
    99.68 ± 0.72
      F = 1.30; t = 1.71


    50
    99.28 ± 0.56
    99.38 ± 0.79
      F = 1.99; t =1.69
    99.41 ± 0.94
      F = 1.41; t = 1.77


    100
    98.86 ± 0.79
    98.98 ± 0.74
      F = 1.14; t = 1.56
    98.59 ± 0.64
      F = 1.33; t = 1.58


    Meto-FRc
    25
    99.25 ± 0.74
    99.38 ± 0.61
      F = 1.47; t=1.72
    99.41 ± 0.68
      F = 1.24; t=1.56


    50
    99.75 ± 0.68
    99.36 ± 0.86
      F = 1.59; t=1.71
    99.45 ± 0.77
      F = 1.24; t = 1.53


    100
    99.48 ± 0.46
    99.12 ± 0.51
      F = 1.23; t=1.24
    99.54 ± 0.74
      F = 2.10; t=1.36


    *Average of five determinations.
      Tabulated t- value of 95% conidece limit level is 2.78    for n = 5.
      Tabulated F- value of 95% conidece limit level is    6.39for n = 5.
Table 4:  Determination of MPS in pharmaceutical preparations by the proposed
methods and their comparison with official method [10].
Conclusions
In conclusion, the proposed methods are advantageous when compared to the reported methods. Unlike the gas chromatographic and HPLC procedures, the instrument was simple and was not of high cost. The importance lies in chemical reactions upon which the procedures are based, rather than upon the sophistication of the instrument. This aspect of spectrophotometric analysis was of major interest in analytical pharmacy since it offers distinct possibility in the assay of a particular component in complex formulations. The reagents utilized in the proposed methods are cheaper, readily available and the procedures do not involve any critical reaction conditions or tedious sample preparation. The proposed methods are free from interference by common additives and excipients. The wide applicability of the new procedures for routine quality control is well established by the assay of MPS in pure form and in pharmaceutical preparations. Hence, the methods could be employed as better alternatives to existing and official methods.
Acknowledgement
Authors thank VGST, Karnataka Govt. for the financial assistance through VGST-RFTT grant to Dr. K. S. Lokesh and CESST to Prof. K. R. Venugopala Reddy.
References
- Kasture AV, Wadokar SG, Mahadik KR and More HN. Pharmaceutical analysis (volume II) Instrumental methods, published by M/S N. Prakashan. 1997.
- Mallikarjun H, Lokesh KS, Shivaprasad KH and Venugopala reddy KR. Novel Spectrophotometric Methods for the Assay of an Antiepileptic- Oxcarbazepine. World J. Pharmacy & Pharmaceut. Sci. 2014; 3: 815-831.
- Skoog DA, Holler FJ and Crouch SR. Instrumental Analysis, 10th Indian Reprint, Cengage Learning India Private Limited, India, 2011.
- Wang Y, Zhao R, and David Goldman I. Bioche. Pharco. 2003; 65: 1163-1170.
- Bischof M, Weber KJ, Blatter J, Wannenmacher M. and Latz D. Interaction of pemetrexed disodium (ALIMTA, multitargeted antifolate) and irradiation in vitro. Int. J. Radn. Oncol. 2002; 52: 1381-1388.
- Lokesh KS. Layer-by-layer self assembly of a water-soluble phthalocyanine on gold. Application to the electrochemical determination of hydrogen peroxide. Bioelectrochem. 2013; 91: 21-27.
- Lokesh KS, Shivaprasad KH and Venugopala Reddy KR. Stable nano-sized copper and its oxide particles using cobalt tetraamino phthalocyanine as a stabilizer; application to electrochemical activity. RSC Advances. 2014; 4: 11367-11374.
- Lokesh KS, Shivaraj Y, Dayananda BP and Chandra S. Synthesis of phthalocyanine stabilized rhodium nanoparticles and their application in biosensing of cytochrome c. Bioelectrochem. 2009; 75: 104-109.
- Christian GD. Analytical Chemistry, 6th Ed. Wiley-India, Joh-Wiley & Sons, Singapore. 2007.
- British pharmacopoeia commission, British pharmacopoeia, 34th Edn, Pharmaceutical press, London. 2005.
- The United states pharmacopeial convention, USP28-NF23. 1281.
- Committee of Chinese pharmacopoeia, Chinese pharmacopoeia (Part II), Chemical industry press, Beijing. (2005) 638.
- Ceniceros C, Maguregui MI, Jimenez RM, Alonso RM. Quantitative determination of theβ-blocker labetalol in pharmaceuticals and human urine by high-performance liquid chromatography with amperometric detection. J. Chromatogr. B. 1998; 705: 97-103.
- Flouvat B, Bazin M, Lusko M, Roux A. Guedon. J. Ann. Bio. Clin. 1978; 36: 339.
- Offerhaus L, Van der Vecht JR. Improved fluorimetric assay of plasma propranolol. J. Clin. Pharmacol. 1976; 3: 1061.
- Sioufi A, Colussi D, Mangoni P. Gas chromatographic determination of oxprenolol in human plasma. J. Chromatogr. 1983; 278: 185.
- Svensson S, Karlsson A, Gyllenhaal O, Vessman. J. Chromatogr. 2000; 51: 283.
- Yu JP, Dai WL, Won YL. Anal. Chim. Acta. 2002; 51: 471.
- Nafisur R, Rahman H, Syed NH A. Development and Validation of Kinetic Spectrophotometric Method for the Determination of Metoprolol Tartrate in Pharmaceutical Preparations. Chem. Anal. 2005; 50: 769.
- Nafisur R, Rahman H, Syed NH A. Validated kinetic spectrophotometric method for the determination of metoprolol tartrate in pharmaceutical formulations. Chem. Pharm. Bull. 2005; 53: 942.
- Hesham S. Spectrophotometric determination ofβ-adrenergic blocking agents in pharmaceutical formulations. J. Pharm. Biomed. Anal. 2002; 29: 527.
- Amin AS, Ragab GH, Saleh H. Colorimetric determination of beta-blockers in pharmaceutical formulations. J. Pharm. Biomed. Anal. 2002; 30: 1347.
- El-Ries MA, Attia FMA, Ibrahim SA. AAS and spectrophotometric determination of propranolol HCl and metoprolol tartrate. J. Pharm. Biomed. Anal. 2000; 24: 179.
- Kanna Rao KV, Ravi Kumar BVV, Bhanoji Rao ME, Rao SS. Spectrophotometric Determination Of Betaxolol Hydrochloride And Metoprolol Tartrate. Ind. J. Pharm. Sci. 2003; 65: 516.
- Basavaiah K, Somashekar BC. Titrimetric and Spectrophotometric Determination of Metaprolol tartrate in Pharmaceuticals Using N-Bromosuccinimide. E-J. Chem. 2007; 4: 117.
- Perrin DD, Dempsey B. Buffers for pH and Metal Control, 3rd Edn, Chapman and Hall. 1979; 128: 130.
- Vogel AI. A Text book of quantitative analysis, 3rd Edn, ELBS and Longman. 1969; 35.
- Gowda HS, Padmaji KA, Thimmaiah KN. Simultaneous spectrophotometric determination of palladium(II) and gold(III) with methiomeprazine hydrochloride: analysis of alloys and minerals. Analyst. 1981; 106: 198.
- Gowda BG, Seetharamappa J. Extractive Spectrophotometric Determination of Fluoroquinolones andAntiallergic Drugs in Pure and Pharmaceutical Formulations. Anal. Sci. 2003; 19: 461.
- Ashour S, Al-Khalil R. Simple extractive colorimetric determination of levofloxacin by acid–dye complexation methods in pharmaceutical preparations. II Farmaco. 2005; 60: 771.
- Job P. Study of New Selective Reagent Acetophenone 2’, 4’- Dihydroxy Semicarbazone for Extractive Spectrophotometric Determination of Vanadium. Ann. Chim. France. 1928; 9: 113.
- Masart DL, Vandegingte BGM, Deming SN, Michotte Y, Kaufman L. Chemometrics, a text book, Elsevier, Amsterdam. 1988; 293.