
Research Article
Austin J Anal Pharm Chem. 2016; 3(3): 1070.
Spectrophotometric Determination of Some Nonsteroidal Anti-Inflammatory Drugs by Oxidative Coupling Reaction
Mallikarjuna H1, Shivaprasad KH2 and Venugopala Reddy KR2 and Lokesh KS2*
1Department of Industrial Chemistry, Jnana Sahyadri, Kuvempu University, Shankaraghatta, Karnataka, India
2Department of Chemistry, Vijayanagara Sri Krishnadevaraya University, Vinayakanagara, Karnataka, India
*Corresponding author: Koodlur Lokesh, Department of Chemistry, Vijayanagara Sri Krishnadevaraya University, Vinayakanagara, Cantonment, Ballari, Karnataka, India
Received: July 26, 2016; Accepted: August 24, 2016; Published: August 26, 2016
Abstract
Two simple, sensitive and rapid spectrophotometric methods have been described in the present work for the assay of non-steroidal anti-inflammatory drugs, meloxicam (MLX) and tenoxicam (TNX) in pure and pharmaceutical formulations. The methods were based on oxidative coupling of MLX [Method A] and TNX [Method B] with 3-methylbenzothiazoline-2-one hydrozone (MBTH) in presence of iron(III) chloride as an oxidant to form colored complexes. The colored complexes exhibited absorption maxima at 619 nm for method A and method B. Reaction conditions have been optimized to obtain coloured complexes of higher sensitivity and longer stability. Beer’s law is obeyed in the concentration range of 0.2-10 μgml-1 and 0.1-5 μgml-1 with molar absorptivity values of 15.82x10⁴ and 16.61x10⁴ lmol-1cm-1, for method A and method B, respectively. The developed methods have been successfully applied to analysis of MLX and TNX in bulk samples and pharmaceutical formulations. A statistical comparison of these results with those of official or reported methods revealed good agreement and indicated no significant difference in precision.
Keywords: Anti-inflammatory drug; Spectrophotometry; Assay; Oxidative coupling; Formulations
Introduction
Anti-inflammatory drugs refer to the drug substance that reduces inflammation or swelling. Anti-inflammatory drugs make up about half of analgesics, remedying pain by reducing inflammation as opposed to opioids, which affect the central nervous system. Nonsteroidal anti-inflammatory drugs (NSAIDs) alleviate pain by counteracting the cyclooxygenase (COX) enzyme. On its own, COX enzyme synthesizes prostaglandins, creating inflammation. The NSAIDs prevent the prostaglandins from ever being synthesized, reducing or eliminating the pain.
Long-term use of NSAIDs can cause gastric erosions, which can become stomach ulcers and in extreme cases can cause severe haemorrhage, resulting in death. Other dangers of NSAIDs are exacerbating asthma and causing kidney damage. Apart from aspirin, prescription and over-the-counter NSAIDs also increase the risk of myocardial infarction and stroke.
Tenoxicam (TNX) [4-hydroxy-2-methyl-N-2-pyridinyl- 2-H-thieno 2,3-e-1,2-thiazine-3-carboxamida-1,1- dioxide] and meloxicam (MLX) [4-hydroxy-2-methyl-N (5-methyl-2-thiazolyl)- 2-H-1,2- benzothiazine-3-carboxamide- 1, 1-dioxide] are new nonsteroidal anti-inflammatory drugs [1-2] (NSAID), potent analgesic and antipyretic agent of oxicam class. The pharmacological actions of these oxicams are related to inhibition of cyclooxygenase which catalyze the formation of cyclic endoperoxides [3-4] and subsequent prostaglandin formation. The drugs are widely used in the treatment of rheumatic diseases [5-6], musculoskeletal and joint disorders [7].
TNX contains 2-aminopyridine (2-AP) which is one of the potential impurities. 2-AP was considered as a synthetic precursor or a decomposition product through acid cleavage. The British Pharmacopoeia 2001 [8] specifies the limit of 2-AP in TNX to be 0.2% in bulk drugs and 0.25% in pharmaceutical preparations. In case of MLX drug, its solubility is very low in acidic medium and it may cause local gastrointestinal adverse events [9]. MLX was used in the treatment of rheumatoid arthritis, oesteoarthritis and other joint diseases [9].
Critical literature survey revealed that several analytical methods have been reported for the assay of MLX. These include colorimetric [10-11], derivative spectrophotometric [12-14], UV [15-18], HPLC [19-20], fluorometric [14], polarographic [21], voltammetric [22] and electrochemical [21-23] methodologies, as well as procedures based on non-aqueous titration [24], flow-injection-spectrophotometry [20,25], TLC-densitometry [26] and capillary electrophoresis [27].
Literature mentions only a few spectrophotometric methods for the determination of MLX. Elham et al [15] have developed spectrophotometric and spectrofluorimetric methods for the assay of lornoxicam (LRX), MLX and TNX. The methods were based on derivatization of alkaline hydrolytic products with 4-nitrobenz-2- oxa-7-chloro-1, 3-diazole. The products showed absorption maxima at 460nm and fluorescence emission peak at 535nm. The proposed spectrophotometric method was found to be linear in the range of 1-10 μgml-1 for LRX and TNX, and 0.5-4.0 μgml-1 for MLX. In this method, the reaction in aqueous medium proceeded quantitatively at pH 8, after heating on a boiling water bath for 30min. In the spectrofluorimetric method, the linearity was observed in the range of 0.05-1.0 μgml-1 for LRX and TNX, and 0.025-0.4 μgml-1 for MLX.
Reddy et al [16] proposed two spectrophotometric methods for the determination of MLX in its tablet dosage forms. MLX formed stable coloured complex showing maximum absorption at 740nm, which obeyed Beer’s law in the concentration range of 5-15 μgml-1. Kuchekar et al [17] developed a spectrophotometric method for the estimation of MLX using Folin-Ciocalteu reagent in presence of 20% sodium carbonate solution. The coloured product exhibited absorption maximum at 700nm. It obeyed linearity over concentration range of 1.5-22.5 μgml-1. Murthy et al [18] have described a method for assay of MLX in bulk samples and pharmaceutical formulations, based on the oxidation of the drug with a known excess of oxidant, potassium permanganate (KMnO4). The excess permanganate was determined using the dye, Fast green at 625nm.
Several analytical methods have been reported for the assay of TNX, which included derivative spectrophotometric [14,28-30], HPLC [26,31-32], mass spectrometric [33], spectrofluorimetric [14,34], polarographic [35], infrared spectrophotometric [36], coulometric [37], electrochemical [37-38] and UV [15,35,39] methods. The official methods reported for the determination of MLX and TNX involved non aqueous titration with perchloric acid, determining the end point potentiometrically [40].
Elham et al [15] (as mention above), EL-Ries et al [35] have described spectrophotometric and potentiometric determination of piroxicam and TNX in pharmaceutical preparations. Spectrophotometric method involved heating at 55°C on a water bath for 5min followed by extraction with cyclohexane. Spectrophotometric determination of piroxicam and TNX in pharmaceutical formulations using alizarin was reported by Amin [39].
In view of the importance of NSAID and to overcome the limitations of reported methods of assay like formation of complex colored products and their lesser stability, usage of non-aqueous media, application to small concentration range, etc, we attempted to develop simple and sensitive spectrophotometric methods for the determination of MLX and TNX. 3-Methylbenzothiazolin-2- one hydrazone (MBTH) has been used as a reagent for colorimetric determination of pharmaceutical compounds from 1961. MBTH has been employed as an analytical reagent in the assay of different class of compounds [41-42]. The proposed methods are based on oxidative coupling of MLX [Method A] and TNX [Method B] with 3-methyl- 2-benzothiazolinone hydrozone (MBTH) in presence of iron(III) chloride as an oxidant to yield a coloured product. The proposed methods offered the advantages of simplicity, need no extraction, heating or cooling, better sensitivity, no non-aqueous solvents, broader concentration range, etc, compared to the reported methods [18-20].
Experimental
Standard drug solution
Stock solutions of MLX and TNX containing 100μgml-1 were prepared by dissolving 10mg of MLX or TNX in 10mL of acetone and then diluted with distilled water upto the mark in 100ml volumetric flasks, separately. These solutions were stored in a refrigerator at 4oC (±2°C). These solutions were stable for atleast 20 days. These solutions were diluted as and when required.
MBTH reagent: 0.2% (w/v) MBTH was prepared by dissolving 200 mg in 100 ml distilled water.
FeCl3.6H2O solution: 1% (w/v) FeCl3 solution was prepared by dissolving 1g in 10mL of 1M HCl solution and the volume was made upto the mark with distilled water in 100ml volumetric flask.
Recommended procedures
The following procedures were recommended for the assay of MLX and TNX in pure and pharmaceutical preparations after a thorough and systematic study of various parameters involved in the formation of oxidative coupled products.
Analysis of bulk sample
Method A and Method B: Aliquots of standard drug solution of MLX containing 0.2-10μgml-1 or TNX consisting 0.1-5μgml-1 were placed in to a series of 10ml calibration flasks. Further, to these 3ml and 2ml of FeCl3 solution were added for method A and method B, respectively followed by 1.5ml and 2.5ml of MBTH solution and kept aside for 10min. Further solutions were diluted to the mark with distilled water. The contents were mixed well and absorbance of green coloured products was measured at 619nm against the reagent blank. Calibration graphs were constructed and used to determine the amount of drug in an unknown sample.
Analysis of pharmaceutical preparations
For method A and method B:
Tablets: Twenty tablets containing MLX/TNX were weighed separately and finely powdered. An amount equivalent to 25.0mg of the drug was weighed accurately and transferred into a 100ml beaker. Using a mechanical stirrer, the powder was completely disintegrated in distilled water. The solution was filtered through a Whatman filter paper number 40 and the residue was washed with small quantity of acetone and made up to 100ml with distilled water. The solution was analyzed using procedure given above.
Results and Discussion
The chemical formula of Meloxicam (MLX) and Tenoxicam (TNX) drug is C14H13N3O4S2 and C13H11N3O4S2 respectively. Both MLX and TNX are yellow crystalline powder. Their structure is given in Figure 1. MLX and TNX are non-steroidal anti-inflammatory drugs and they are practically insoluble in water, very slightly soluble in methanol and soluble in acetone.
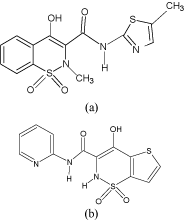
Figure 1: Structure of a) Meloxicam (MLX) and b) Tenoxicam (TNX).
The reaction of MLX or TNX with MBTH in presence of an oxidant, Fe(III) chloride produced a green coloured product having an absorption maxima at 619 nm for both methods (Figure 2 and Figure 3). MBTH on oxidation with Fe+3 ions lost two electrons and one proton forming an electrophilic intermediate, which was believed to be the active coupling species [43]. Further, the electrophilic intermediate was more reactive towards amine or phenol. Thus, electrophilic attack took place on the most nucleophilic site on the aromatic ring of the amine or phenol moiety and resulting intermediate was spontaneously oxidized with oxidant to form coloured species. The formation of oxidative coupling product and extent of oxidation of MBTH depended on experimental conditions viz., order of addition, temperature and time maintained during each addition, nature and concentration of the oxidant.
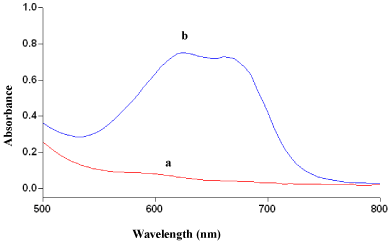
    Figure 2:  Absorbance spectra of (a) reagent blank and (b) oxidative coupled
product of MLX (12 μgml-1).
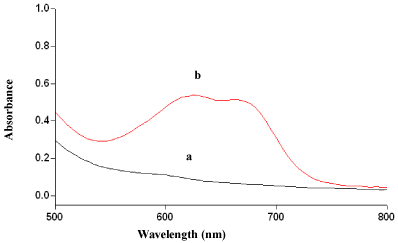
    Figure 3:  Absorbance spectra of (a) reagent blank and (b) oxidative coupled
product of TNX (4 μgml-1).
In the present investigation, MBTH and Fe(III) were used as analytical reagents for the determination of MLX and TNX and the probable reaction mechanism is shown in Schemes 1 and 2.
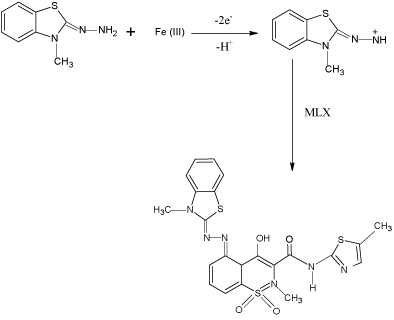
scheme 1: Probable oxidation coupling reaction of MLX with MBTH.
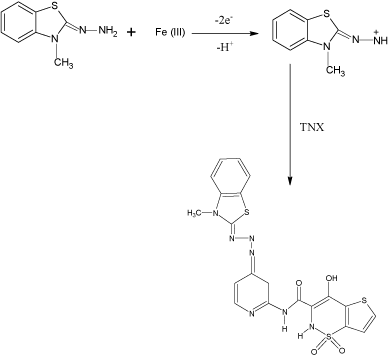
scheme 2: Probable oxidation coupling reaction of TNX with MBTH.
Spectral characteristics
The wavelength of absorption maxima (λmax) of oxidation coupled products were determined by taking specified amount of MLX or TNX (within Beer’s limit) and the reaction product was developed following the procedure. The absorption spectrum was scanned on a spectrophotometer in the wavelength region of 400-800 nm against the reagent blank (for both the methods). The coloured species exhibited absorption maxima at 619nm (for both the methods). The reagent blank showed negligible absorbance at λmax thereby permitting good analytical conditions for the assay of MLX and TNX.
MLX and TNX reacted with MBTH in presence of Fe(III) and yielded a green coloured species. The absorption spectra are shown in Figure 2 and Figure 3.
Standardization of experimental parameters
For the formation of coloured species of maximum sensitivity and stability, it was necessary to establish optimum reaction conditions. For this, the absorbance of a series of solutions was measured at λmax by varying one parameter at a time and keeping other parameters constant or [44].
For Methods A and B:
Effect of MBTH concentration: The effect of concentration of MBTH on complex formation was studied by measuring the absorbance at specified wavelength in the standard procedure for solution containing a fixed concentration of drug and varying amounts of MBTH. A volume of 1.5ml and 2.5ml of 0.2% [42] MBTH in a total volume of 10ml for method A and B, respectively were found to be sufficient to obtain maximum colour intensity (Figure 4).
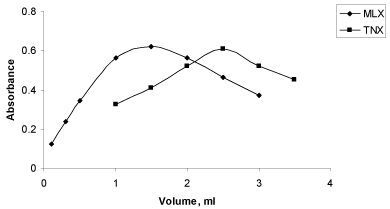
Figure 4: Effect of MBTH on absorbance of MLX and TNX.
Effect of Fe+3 concentration: The optimum concentration of Fe(III) chloride solution on complex formation was studied by fixing the concentration of drug and varying the amounts of FeCl3 and measuring absorbance at λmax. A volume of 3ml and 2ml of 1% (w/v) of FeCl3 in a total volume of 10ml for method A and B, respectively was found to be necessary for the formation of coloured species of maximum intensity (Figure 5). The optimal acid concentration of HCl solution in which Fe(III) chloride was dissolved was found to be M.
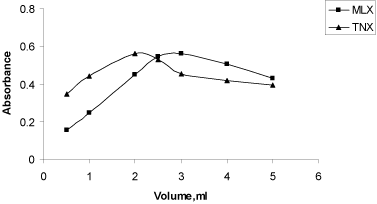
Figure 5: Effect of FeCl3 on absorbance of MLX and TNX.
Effect of reaction time: The duration of the reaction played a significant role in the experiment. Maximum intense coloured product was developed by the addition of reagents after about 10min at room temperature (for both methods). This was established by recording the absorption at different time intervals which showed constant absorption after 10 mins of addition of reagents. The oxidative coupled product was stable for more than 1h (for both methods) and there was a decrease in absorption of coloured product after 75 minutes.
Optical characteristics of the coloured species
To examine whether the coloured product formed in the proposed methods adhere to Beer’s law or not, the absorbance of a series of solutions containing varying amounts of MLX and TNX were recorded against the corresponding reagent blank at λmax. The Beer’s law limits, molar absorptivity and Sandell’s sensitivity values have been evaluated and are tabulated Table 1. Least –square regression analysis was carried out for calculating the slope, intercept and correlation coefficient. A linear relationship was found between the absorbance at λmax and concentration of coloured species in the concentration range of 0.2-10μgml-1 for method A and 0.1-5μgml-1 for method B (Figure 6).
    Parameters
    Values    for


    MLX
    TNX


    λmax (nm)
    619
    619


    Beer’s law limits    (µgml-1)
    0.2-10
    0.1-5


    Molar    absorptivity (l/ mol/ cm) ×104
    2.23
    2. 038


    Sandell’s    Sensitivity (ng cm-2)
    15.82
    16.61


    Correlation    co-efficient (r)
    0.995
    0.9942


    Regression equation    (Y)a
    ------
    ------


    Slope (b)
    0.0604
    0.1287


    Intercept (a)
    0.0278
    0.0548


    Relative standard    deviation (%)d
    1.38
    1.18


    % Errord
    1.12
    1.41


    Limit of detection    (µgml-1)
    0.057
    0.028


    Limit of    quantification (µgml-1 )
    0.192
    0.095


    aY=a+bX, where X is the concentration    of the drug in µgml-1 .
      dAverage of five determinations.
Table 1: Optical characteristics, precision and accuracy data.
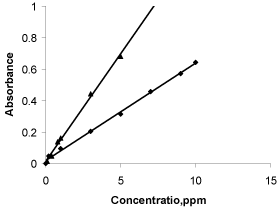
Figure 6: Beer’s law plot of MLX (■) and TNX.(▲).
Detection and quantification limits
The Limit of Detection (LOD) values were found to be 0.057μgml- 1 and 0.028μgml-1 which is calculated by considering signal: noise ratio of 3:1, while the Limit of Quantification (LOQ) values were calculated by taking signal: noise ratio of 10:1 and found to be 0.192μgml-1 and 0.095 μgml-1 for method A and method B, respectively (Table 1). These results revealed that the method B can be used to detect small amount of drug compared to method A.
Precision and accuracy
In order to determine the accuracy and precision of proposed methods, standard solutions containing three different concentrations of MLX and TNX from lower, middle and highest concentration (0.3, 5 and 10 μg/mL for method A and 0.2, 2.5 and 5 μg/mL for method B) in the range were analyzed in five replicates. The results obtained are summarized in Table 1. The low values of the relative standard deviation (%RSD) and % error indicated good precision and accuracy of the methods.
Recovery studies
To confirm the accuracy and reliability of the proposed methods, recovery studies were carried out via the method of addition. A fixed amount of pure sample of drug which is in the middle of the concentration range (5μg/mL for method A and 2.5μg/mL for method B) was added to five replicates of different concentrations of standard drug. The total amount of the drug was then determined and the amount of the added drug was calculated by difference. The results obtained were quantitative indicating good accuracy of the methods.
Interference studies or Selectivity
The effects of common excipients and additives present in formulations like tablets were tested in five replicates for their possible interference in the assay of MLX and TNX. It was observed that the starch, glucose, dextrose, lactose, magnesium stearate, gum acacia and talc (at the levels generally present in pharmaceutical formulations) did not interfere in the determination of MLX and TNX and the corresponding mean results are shown in Table 2.
    Excipients added
    Amount (mg)
    % Recovery % RSDb


    Method A
    Method B


    Glucose
    30
    97.13  0.52
    99.21  0.82


    Talc
    30
    98.41  0.71
    98.23  0.87


    Lactose
    30
    99.62  0.96
    97.69  0.75


    Starch
    40
    97.33  0.95
    99.03  0.78


    Magnesium stearate
    30
    98.82  0.63
    98.65  0.69


    Dextrose
    40
    99.51  0.55
    98.56  0.82


    Gum acacia
    30
    97.42  0.82
    97.82  0.48


    b Average of five determinations.
Table 2:  Determination of MLX and TNX in the presence of excipients using
MBTH.
Analysis of tablets and statistical comparison of the results with reported method [18]
The utility of the proposed methods for the assay of pharmaceutical preparations marked under different commercial names was examined. The performance of the proposed methods was assessed by calculation of t- and F- values. These values did not exceed the theoretical values at 95% confidence level thereby indicating that there was no significant difference in accuracy and precision between the proposed and reported methods. The results of assay of tablets containing MLX and TNX are summarized in Table 3.
    Drug
    Label
      Claim (mg)
    Recovery* ± % RSD


    Reported    method [18]
    Proposed methods


    Method A
    Method B
    Method A
    Method B


    Meloxicam -Tablets

    98.4± 0.9


    M-CAMa
    7.5


    99.51±0.85


    F=1.12


    t=1.82


    MEL-ODb
    15


    99.84±     0.69


    F=1.70


    t=1.35


    Tenoxicam -Tablets


    99.9±1.7


    VAL-BCDc
    10


    99.45 ± 1.53


    F=1.23


    t=1.97


    VAHd
    20


    99.51±1.38


    F=1.51


    t=1.52


    Average of five determinations.
      aUnichem pharmaceuticals.
      bZydus pharmaceuticals.
      cNPIL pharmaceuticals.
      dLupin Laboratories Ltd.
      Tabulated t- value of 95% conidece    limit level is 2.78 for n = 5.
      Tabulated F- value of 95% conidece    limit level is 6.39 for n = 5.
Table 3:  Determination of MLX and TNX in pharmaceutical preparations by
proposed methods and their comparison with reported method [18].
Conclusions
Compared to the other analytical methods such as HPLC and related chromatographic methods, spectrophotometric methods are simple and are of not high cost. The procedures do not involve any critical reaction conditions or tedious sample preparation. Moreover, the methods are free from interference by common additives and excipients. The proposed methods have reasonable precision and accuracy. Hence, these methods could be readily adopted for routine quality control by pharmaceutical industries.
Acknowledgement
Authors thank VGST, Karnataka Govt. for the financial assistance through VGST-RFTT grant to Dr. K. S. Lokesh and CESST to Prof. K. R. Venugopala Reddy.
References
- Pairet M, Van-Ryn J, Schierok H, Mauz A, Trummlitz G and Engelhardt G. Differential inhibition of cyclooxygenases-1 and -2 by meloxicam and its 4′-isomer. Inflamm. Res. 1998; 47: 270.
- Lazer E, Miao C, Cywin C, Sorcek R. and Wong H. Effect of structural modification of enol-carboxamide-type nonsteroidal antiinflammatory drugs on COX-2/COX-1 selectivity. J. Med. Chem. 1997; 40: 980-989.
- Woolf TF and Radulovic LL. Oxicams: metabolic disposition in man and animals. Drug. Metab. Rev. 1989; 21: 255-276.
- Heizmann P, Korner J and Kinapold K. Determination of tenoxicam in human plasma by high-performance liquid chromatography. J. Chromatogr. Biomed. Applic. 1986; 374: 95-102.
- Gonzales JF and Todd PA. Drugs. 1987; 341: 298.
- The Merck index: an encyclopedia of chemicals, drugs, and biological, 11th Edn, Merck Rahway, NJ, USA. 1989; 1441.
- Parfitt K, Sweetman SC, Blake PS, Parsons AV and Martindale. The extra pharmacopoeia, 32nd Edn, pharmaceutical press, London. 1999; 88: 80.
- British pharmacopoeia, stationery office, London. 2001: 1320, 1579, 2324, 2415.
- Martindale the extra pharmacopoeia, 32nd Edn, The pharmaceutical press, London, England. 1999: 52.
- Lokesh KS, Mallikarjuna H, Shivaprasad KH and Venugopala Reddy KR. Extractive Spectrophotometric Methods for the Determination of Metaprolol Succinate in Pure and Pharmaceutical Formulations. Austin J Anal Pharm Chem. 2016; 3: 1069.
- Sane RT, Surve V and Francis M. Indian Drugs. 2000; 37: 390.
- Zawilla NH, Mohammad MAA, El Kousy NM and El-Moghazy Aly SM. Determination of meloxicam in bulk and pharmaceutical formulations. J. Pharm. Biomed. Anal. 2003; 32: 1135-1144.
- You WW, Liu Y and Wang ZB. Determination of Meloxicam by Ultraviolet Spectrophotometry. Chin. J. Anal. Chem. 1999; 27: 841-844.
- Taha EA, Salama NN and Abdel Fattah LS. Stability-indicating methods for determination of meloxicam and tenoxicam in the presence of their degradation products. Spectrosc. Lett. 2002; 35: 501-516.
- Taha EA, Salama NN and Abdel Fattah LS. Spectrofluorimetric and spectrophotometric stability-indicating methods for determination of some oxicams using 7-chloro-4-nitrobenz-2-oxa-1,3-diazole (NBD-Cl). Chem. Pharm. Bull. 2006; 54: 653-658.
- Reddy MN, Murthy TK, Rajita K and Shankar DG. New spectrophotometric methods for the determination of meloxicam. Indian J. Pharm. Sci. 2001; 63: 245-247.
- Kuchekar BS, Lata SG, Shingavi AA and Shinde DB. Indian Drugs. 2000; 37: 596
- Murthy TK, Reddy MN, Dharma Reddy M and Shankar DG. Spectrophotometric Determination of Flutamide, Nimesulide and Meloxicam. Asian J. Chem. 2001; 13: 915-918.
- Joseph CJ and Bertucat M. Determination of Meloxicam in Tablet Formulations by Ultraviolet Spectrophotometry and High-Performance Liquid Chromatography. Anal. Lett. 1999; 32: 2051-2059.
- Garcia MS, Pedreno CS, Albero MI and Marti J. Spectrophotometric methods for determining meloxicam in pharmaceuticals using batch and flow-injection procedures. Eur. J. Pharm. Sci. 2000; 9: 311-316.
- Altyokka G, Atkosar Z and Tuncel M. Pulse polarographic determination of meloxicam. Pharmazie. 2000; 56: 184-185.
- Radi A E, Ghoneim M and Beltagi A. Cathodic adsorptive stripping square-wave voltammetry of the anti-inflammatory drug meloxicam. Chem. Pharm. Bull. 2001; 49: 1257-1260.
- Baeyens WRG, Weken GV, Dhaeninck E, Campana AMG, Deprez P, Vankeirsbilck T, et al. Application of an alkyl-diol silica precolumn in a column-switching system for the determination of meloxicam in plasma. J. Pharm. Biomed. Anal. 2003; 32: 839-846.
- Beltagi AM, Ghoneim MM and Radi A. Electrochemical reduction of meloxicam at mercury electrode and its determination in tablets. J. Pharm. Biomed. Anal. 2002; 27: 795-801.
- Sener E, Altiokka G, Atkosar Z and Tuncel M. Flow injection analysis of meloxicam using UV-detection. Pharmazie. 2001; 56: 186-187.
- Taha EA, Salama NN and Abdel-Fatah LS. Stability-indicating chromatographic methods for the determination of some oxicams. J. AOAC Int. 2004: 87: 366-373.
- Nemutlu E and Kir S. Method development and validation for the analysis of meloxicam in tablets by CZE. J. Pharm. Biomed. Anal. 2003; 31: 393-400.
- Garcia MS, Pedreno CS, Albero MI and Gimenez MJ. Flow-injection spectrophotometric methods for the determination of tenoxicam. J. Pharm. Biomed. Anal. 1999; 21: 731-738.
- E-L-Ries MA. Spectrophotometric Determination of Piroxicam and Tenoxicam in Pharmaceutical Preparations Using Uranyl Acetate as a Chromogenic Agent. Anal. Lett. 1998; 31: 793-807.
- Yener G and Topaloglu YA. Sci. Pharm. 1992; 60: 247.
- Sultan M, Stecher G, Stoeggl VM, Bakry R, Zaborski P, Huck CW, et al. Sample pretreatment and determination of non steroidal anti-inflammatory drugs (NSAIDs) in pharmaceutical formulations and biological samples (blood, plasma, erythrocytes) by HPLC-UV-MS and micro-HPLC. Med. Chem. 2005; 12: 573-588.
- Bartsch H, Eiper A, Kopelent-Frank H and Sakka E. Selective assays for quantitation of tenoxicam in presence of its photodegradation products. j. Liq. Chromatogr. Relat. Technol. 2002; 25: 2821-2831.
- McKinney AR, Suann CJ and Stenhouse AM. The detection of piroxicam, tenoxicam and their metabolites in equine urine by electrospray ionisation ion trap mass spectrometry. Rapid commun. Mass spectrom. 2004; 18: 2338-2342.
- Barary MH, Abdel-Hay MH and Sabry SM. Spectrofluorimetric determination of 2-aminopyridine as a potential impurity in piroxicam and tenoxicam within the pharmacopoeial limit. J. Pharm. Biomed. Anal. 2004; 34: 221-226.
- EL-Ries MA, Mohamed G, Khalil S and EL-Shall M. Spectrophotometric and potentiometric determination of piroxicam and tenoxicam in pharmaceutical preparations. Chem. Pharm. Bull. 2003; 51: 6-10.
- Atay O and Dincol F. Quantitative Determination of Tenoxicam by Infrared Spectrophotometry. Anal. Lett. 1997; 30: 1675-1684.
- Nikolic K, Bogavac M and Arsenijevic. Coulometric determination of some antiinflammatory compounds. IL Farmaco. 1993; 48: 1131-1136.
- Atkopar Z and Tuncel M. The Polarographic Determination of Tenoxicam in the Pharmaceutical Preparations. Anal. Lett. 1996; 29: 2383-2397.
- Amin AS. Spectrophotometric determination of piroxicam and tenoxicam in pharmaceutical formulations using alizarin. J. Pharm. Biomed. Anal. 2002; 29: 729-736.
- British pharmacopoeia, Her, Majestys stationery office, London. 2003: 1203, 1795, 2661-2662.
- El-Emam AA, Belal FF, Moustafa MA, El-Ashry SM, El- Sherbiny DT and Hansen SH. Spectrophotometric determination of propranolol in formulations via oxidative coupling with 3-methylbenzothiazoline-2-one hydrazone. Il Farmaco. 2003; 58: 1179-1186.
- Rahaman N, Khan NA and Azmi SNH. Optimized and validated spectrophotometric methods for the determination of nicorandil in drug formulations and biological fluids. Farmaco. 2004; 59: 519-527.
- Huning S and Fritsch KH. Anal. Chem. 1957; 609: 143.
- Masart DL, Vandegingte BGM, Deming SN, Michotte Y and Kaufman L. Chemometrics, a text book, Elsevier, Amsterdam. 1988: 293.