
Research Article
Austin J Anal Pharm Chem. 2016; 3(3): 1072.
Comparative UV-Spectroscopic Analysis of Different Local Brands of Black Tea Available in Maharashtra Region (India) for the Presence of Caffeine
Pawar HA¹*, Malusare VA² and Shinde PR²
¹Assistant Professor and HOD, Dr. L. H. Hiranandani College of Pharmacy, Ulhasnagar-421003, Maharashtra, India
²Research Scholar, Dr. L. H. Hiranandani College of Pharmacy, Ulhasnagar-421003, Maharashtra, India
*Corresponding author: Harshal Ashok Pawar, Assistant Professor and Head of Department, Dr. L. H. Hiranandani College of Pharmacy, Smt. CHM Campus, Opp. Ulhasnagar Railway Station, Ulhasnagar-421003, Maharashtra, India
Received: August 09, 2016; Accepted: September 08, 2016; Published: September 12, 2016
Abstract
Caffeine is a well-known stimulant which present in tea leaves. Caffeine has drawn more attention due to its physiological effects beyond that of its stimulatory effect. Consumers are interested in knowing the exact amounts of caffeine existing in different brands of tea powder available in the market. However, limited data exist, especially for store brands. The objective of the present research work was to estimate and compare caffeine content of different local brands of black tea available in Maharashtra region (India) using validated UV-Spectroscopic method. The caffeine content of various brands of tea powder used in Maharashtra region (India) was found in the range of 2.51 % to 3.19 %.
Keywords: Tea; Camellia sinensis; UV- Spectroscopy; Caffeine
Introduction
Caffeine is a naturally occurring alkaloid which is found in the leaves, seeds and fruits of over 63 plants species worldwide. Its physiological effects on many body systems have been reported by researchers, including the central nervous, cardiovascular, gastrointestinal, respiratory, and renal systems [1].
Tea currently is the hot topic in both nutritional and therapeutic research worldwide. This is not so because tea is the most preferred drink after water, but because of the presence of crucial therapeutic compounds in tea which are more bio-stable and direct acting than those found in other plants. The activities of these compounds are so all pervading that they are virtually broad spectrum in their actions. Besides, the natural integration of aromatic and therapeutic compounds in tea is a rather unique attribute. The leaves and leaf buds of Camellia sinensis are used to produce tea [2].
The most common sources of caffeine are coffee, cocoa beans, cola nuts and tea leaves and the worldwide consumption of products derived from these natural materials means that caffeine is one of the most popular and commonly consumed drugs in the world.
Caffeine is an odorless, white solid that has the form of needles or powder. Caffeine has a bitter taste. The molar mass of caffeine is 194.19 g/mol. Caffeine is slightly soluble in water due to its moderate polarity. Caffeine is a natural central nervous system stimulant, having the effects of reducing drowsiness and recovering alertness. Since it is widely consumed by humans, caffeine is considered the most frequently used psychoactive substance in the world [3]. A moderate caffeine intake from tea appeared to improve mental performance [4]. The International Olympic Committee (IOC) defined caffeine as a drug and abuse is indicated when athletes have urine caffeine concentrations higher than 12μg/mL [5].
Caffeine has drawn more attention due to its physiological effects beyond that of its stimulatory effect. Consumers are interested in knowing the exact amounts of caffeine existing in different brands of tea powder available in the market. However, limited data exist, especially for store brands. Hence the present research work was undertaken to judge the quality of differentiate local brands of black tea available in Maharashtra region (India) based on their caffeine content using in-house developed and validated UV-Spectroscopic technique.
Materials and Methods
Materials
Five different brands of black tea (Quality, Taj, Society, Wagh- Bakari and Red label) were purchased from local market (Mumbai, Maharashtra region, India). Caffeine anhydrous LR (Batch no. F13A/1013/2101/13) was purchased from SD Fine Chem. Ltd., Mumbai (India). All the chemicals and reagent used were of analytical reagent grade.
Preparation of caffeine stock solution
Accurately weighed about 100mg of Caffeine and transferred to 100ml volumetric flask. Dissolved in dichloromethane and made the volume up to the mark using dichloromethane (DCM) so as to get concentration of 1000 mcg/ml (Stock solution).
Determination of analytical wavelength (λmax)
A solution of concentration 10mcg/ml was prepared from caffeine stock solution. The maximum absorbance (λ max) was found out by scanning 10mcg/ml solution of Caffeine prepared in DCM between 200nm to 400nm using DCM as a blank in UV spectrophotometer (Shimadzu 1800).
Preparation of test solution (Sample solution)
100 mg of tea powder was boiled in 100ml water at 100°C in water bath for 20 minutes. The mixture was cooled and filtered. Caffeine was isolated from aqueous extract using DCM. 10ml of aqueous extract and 15ml of DCM were transferred to 50ml volumetric flask, lead was closed and the mixture was shaken on rotary shaker for 30 minutes at 100rpm. The DCM layer was separated and diluted 1ml of this solution to 10ml using DCM. The absorbances of the prepared solutions were measured at 275nm (λmax). The % Caffeine content was calculated by using following formula:
Analytical method development and validation
UV-spectroscopic method was used for estimation of Caffeine in tea samples. The developed method was validated by determining the specificity, linearity, precision, recovery, and solution stability according to USP and ICH guidelines.
Specificity of the method: The maximum absorbance (λ max) value obtained for test solution was compared with that of standard. Secondly the specificity was determined by subjecting the sample solution to accelerated degradation by heat (100°C) for 72h in order to verify that none of the degradation products interfered with the quantification of the caffeine.
Linearity: Solutions of different concentrations were prepared in the range of 1mcg/ml to 14mcg/ml by diluting the stock solution. Absorbances were noted for solutions of different concentration at λmax and calibration curve was constructed by plotting concentration on X-axis against absorbances on Y-axis.
Intra-day and inter-day precision: It was performed on six samples from the same batch and samples were analyzed for the caffeine content using UV spectrophotometer.
Intermediate precision was evaluated to determine the effects of random events on the precision of the analytical procedure. This was done by performing the analysis of the same batch of black tea on different day by changing the analyst.
Recovery/Accuracy: A recovery study was carried out by extracting 10ml of 80%, 100%, and 120% of solution of standard caffeine in water with 15ml of DCM separately. Each concentration was prepared in duplicate and each one was analyzed in triplicate.
Robustness: Robustness was studied by changing the wavelength of UV spectrophotometer at 273nm ± 2nm and analyzing test sample in triplicate using UV-Spectroscopy.
Solutions stability: To evaluate solution stability, the standard and the sample solutions were stored at room temperature and were analyzed by UV spectrophotometer for 24hrs at various time intervals.
Analysis of marketed samples: Five different local brands of black tea available in Maharashtra region (India) were analyzed for caffeine content using in-house developed. Sample solutions were prepared using the procedure given under section 2.4. Absorbance’s of each solution was taken at 275nm. Caffeine contents were determined using the standard calibration curve.
Results and Discussion
Determination of λ max value and specificity of method
Figure 1 represents UV-spectrum of standard Caffeine in DCM. UV-spectrum of standard showed maximum absorbance (λ max) value at 273.4nm. UV-spectrum obtained for test solution showed maximum absorbance value at 275.8nm which was closer to that of standard maximum absorbance. Also, the UV-spectrum obtained for sample solution subjected to accelerated degradation by heat (100°C) for 72h and the same was overlaid with the UV-spectrum obtained from sample solution kept at room temperature (Figure 2). Both the solutions showed maximum absorbance value at about 275nm and the spectrums obtained were exactly matching with each other. This indicates that caffeine remains stable in aqueous medium at 10°C as well as there was no interference of degradation products, if any formed, with the quantification of the caffeine. This indicates the specificity of the method.
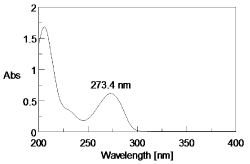
Figure 1: UV-Spectrum of Caffeine.
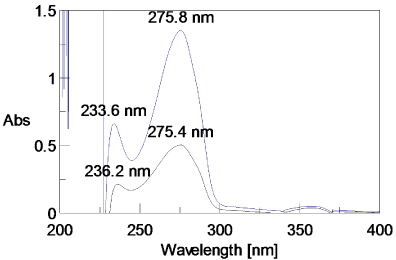
    Figure 2:  Overlaid UV-spectrum of sample solution at room temperature (λmax
= 275.8nm) and sample solution at 10°C (λmax = 275.4nm).
Method development and optimization
During extraction of tea powder using water, many other phytochemicals such as phenolic constituents and tannins come into aqueous extract which interfere with caffeine while quantitative estimation using spectroscopic technique. Caffeine is more soluble in DCM as compared to water. DCM is selective solvent for extraction of Caffeine. Hence, initially the tea powder was extracted using water followed by DCM. To optimize the extraction time, tea powder was extracted in water for different time interval and the caffeine contents were estimated. Extraction time was optimized to 30 minutes at 100rpm.
Linearity and range
The calibration curve (Figure 3) obtained was evaluated by its correlation coefficient. The absorbance of the samples in the range of 1.0–14.0 μg/mL was linear with a correlation coefficient (R2) greater than 0.997. The LOD and LOQ were calculated as 0.88μg/mL and 2.66μg/mL respectively.
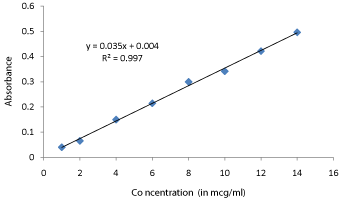
Figure 3: Calibration curve of caffeine in DCM.
Intra-day and inter-day precision
The values of % Relative Standard Deviation (% RSD) for intraday and interday precision are given in Table 1. In both cases, % RSD values were found well within 2% limit, indicating that the current method is repeatable. The overall cumulative % RSD for twelve samples was also less than 2% indicating the precision and ruggedness of the method.
![]()
    Sample No.
    % Caffeine content


    Method Precision
    Intermediate Precision


    1
    3.29
    3.21


    2
    3.23
    3.27


    3
    3.24
    3.25


    4
    3.22
    3.21


    5
    3.27
    3.25


    6
    3.24
    3.23


    Mean
    3.25
    3.24


    SD
    0.026
    0.024


    % RSD
    0.81
    0.75


    Cumulative Mean
    3.24


    Cumulative SD
    0.025


    Cumulative % RSD
    0.77
Table 1: Results of Precision study.
Robustness
The % of RSD of robustness testing under different altered conditions is given in Table 2, indicating that the current method is robust.
![]()
    Sample No.
    % Caffeine content


    At 273nm
    277nm


    1
    3.24
    3.28


    2
    3.29
    3.25


    3
    3.26
    3.29


    Mean *
    3.25
    3.26


    SD*
    0.025
    0.026


    % RSD*
    0.78
    0.81


    *Mean, SD and % RSD of 9 samples (6    of Method precision +3 of Robustness).
Table 2: Results of Robustness (Wavelength: ± 2nm).
Recovery
Recovery experiments were done to determine the accuracy of the method. The results are shown in Table 3.The data indicated good reproducibility. Results obtained were within the range of 98.88– 101.11% indicating accuracy of the method (Table 3).
![]()
    Level
    Actual Added (in mg)
    % Recovery
    Mean
    SD
    % RSD
    Cumulative % RSD


    80%
    2.44
    99.71
    99.38
    0.382
    0.38
    0.66


    2.47
    98.96


    2.41
    99.46


    100%
    3.04
    98.88
    99.45
    0.586
    0.59


    3.11
    100.05


    3.08
    99.41


    120%
    3.68
    101.11
    100.16
    0.828
    0.83


    3.61
    99.78


    3.63
    99.59
Table 3: Results of recovery study.
Solution stability
The standard as well as sample solution was found to be stable for 24hrs at room temperature.
Marketed sample analysis
The various local brands of black tea available in Maharashtra region (India) were analyzed for caffeine content using the current in-house developed and validated UV-Spectroscopic technique. The results of the caffeine content obtained for different brands are summarized in Table 4.
![]()
    Sr. No.
    Sample Name (Brand)
    Caffeine Content (%)*


    1
    Quality
    2.75


    2
    Tajmahal
    3.19


    3
    Society
    2.51


    4
    Wagh-Bakari
    3.09


    5
    Red Label
    2.65


    *Mean of 3 determinations.
Table 4: Results of Caffeine content of different local brands of black tea.
Caffeine content for various brands was found in the range of 2.51% to 3.19% with highest value of 3.19 for Tajmahal brand.
Conclusion
The results and the statistical parameters demonstrate that the proposed UV spectrophotometric method is simple, rapid, specific, accurate and precise. Therefore, this method can be used for the determination of Caffeine in tea powder without any interference with other phytoconstituents such as phenolic compounds, tannins etc. The present investigation will be helpful to consumer to judge the quality of various local brands of black tea used in Maharashtra region (India) based on their caffeine content using in-house developed and validated UV-Spectroscopic technique.
Acknowledgment
Authors are very much thankful to Dr. P. S. Gide, Principal of Hyderabad Sindh National Collegiate Boards (HSNCB), Dr. L. H. Hiranandani College of Pharmacy, Ulhasnagar, for his continuous support, guidance, and encouragement.
References
- Igelige Gerald, David Ebuka Arthur, Adebiyi Adedayo. Determination of Caffeine In Beverages: A Review. American Journal of Engineering Research (AJER). 2014; 3: 124-137.
- Venkata Sai Prakash Chaturvedula and Indra Prakash. The aroma, taste, color and bioactive constituents of Tea. Journal of Medicinal Plants Research. 2011; 5: 2110-2124.
- Liguori A, Hughes JR, Grass JA. Absorption and Subjective Effects of Caffeine from Coffee, Cola and Capsules. Pharmacology Biochemistry and Behavior. 1997; 58: 721-726.
- EJ Gardner, CHS Ruxton and AR Leeds. Black tea – helpful or harmful? A review of the evidence. European Journal of Clinical Nutrition. 2007; 61: 3–18.
- De Aragao NM, Veloso MCC, Bispo MS, Ferreira SLC, de Andrade JB. Multivariate optimisation of the experimental conditions for determination of three methylxanthines by reversed-phase high-performance liquid chromatography. Talanta. 2005; 67: 1007-1013.