
Research Article
Austin J Anal Pharm Chem. 2017; 4(2): 1084.
New Spectrophotometric Determination of Nebivolol in Pharmaceutical Formulation via Charge Transfer Complex
Nabil AF Alhemiary1,2*
¹Department of Chemistry, College of Science and Arts – Sharurah, Najran University, Sharurah, Saudi Arabia
²Department of Chemistry, College of Science, Ibb University, Ibb, Yemen
*Corresponding author: Nabil AF Alhemiary, Department of Chemistry, College of Science & Arts – Sharurah, Najran University, Sharurah, Saudi Arabia and College of Science, Ibb University, Ibb, Yemen
Received: April 16, 2017; Accepted: May 11, 2017; Published: May 18, 2017
Abstract
New simple, sensitive, selective and rapid spectrophotometric methods were developed for the determination of Nebivolol (NBV) in pharmaceutical formulation. The methods are based on charge transfer complexation reaction of NBV as n-electron donor with 2,3-dichloro-5,6-dicyano-1,4-benzoquinone (DDQ), 2,4-dinitrophenol (DNP) and 2,4,6-trinitrophenol (picric acid; PA) as π-acceptors to give highly colored radical anion species. The colored products were quantified spectrophotometrically at 620nm with DDQ (method A), at 525nm with both DNP (method B) and at 500nm with PA (method C). Under the optimized experimental conditions, Beer’s law was obeyed over the concentration ranges 4.0-40, 2-25 and 1.0-35 μg/mL with correlation coefficient 0.9983, 9945 and 0.9985 for methods A, B and C respectively. Other method validation parameters, such as precision, accuracy, robustness, ruggedness and selectivity, were satisfactory. The proposed methods were successfully applied to the determination of NBV in commercial tablets. No interference was observed from common tablet adjuvants. Statistical comparison of the results with the reference method showed excellent agreement and indicated no significant difference in accuracy and precision.
Keywords: Spectrophotometric; Nebivolol; Charge Transfer Complex
Introduction
Nebivolol (NBV) is chemically 1-(6-flourochroman-2-yl)-{[2- (6-fluorochroman-2-yl)-2-hydroxy-ethyl] amino} ethanol or 2, 2'-azanediylbis (1-(6-flourochroman-2-yl) ethanol (Figure 1) [1,2], a new antihypertensive drug, is a racemate of two enantiomers with four chiral centres. The mechanism action of nebivolol is a competitive and highly selective _1- receptor antagonist and does not show an intrinsic sympathomimetic activity. Nebivolol is endowed with peripheral vasodilating properties mediated by the modulation of the endogenous production of nitric oxide and thus lowers peripheral resistance. The SRRR- enantiomer (d-nebivolol) is a potent and cardioselective _1-adrenergic blocker. The RSSS- enantiomer (l-nebivolol) has a favourable hemodynamic profile, in that normal energy supply during exercise is nor affected [3].

Figure 1: Structure of Nebivolol.
Literature survey reveals that few analytical methods were reported which include liquid-chromatography with tandem mass spectrometry [4], RP-HPLC and HPTLC methods [5] and derivative spectrometric determination [6,7], liquid chromatography coupled with electro spray ionization tandem mass spectrometry [8], Stability indicating RP-HPLC estimation [9,10], LC-MS [11,12], UV spectrophotometry [13-16] and visible spectrophotometry [17-19] techniques were reported.
In the present study, NBV was found to react with three π-acceptors, namely, 2,3-dichloro-5,6-dicyano-1,4-benzoquinone (DDQ), 2,4-dinitrophenol (DNP) and 2,4,6-trinitrophenol (picric acid; PA) to form C-T complexes, based on which three simple, rapid, selective and sensitive spectrophotometric methods were developed for the determination of NBV. The cited π-acceptors have earlier been employed for the assay of several drug substances [20-22] based on similar reaction.
Materials and Methods
Apparatus
A GENESYS 10S UV-Vis double beam spectrophotometer (ThermoSpectronic, USA) with a fixed slit width (1.8nm) connected to an IBM computer loaded with ThermoSpectronic VISION Lite version 4 software and 1cm quartz cell were used for the registration and treatment of absorption spectra.
Materials and reagents
All Chemicals used were of analytical reagent grad unless otherwise is mentioned, Nebivolol hydrochloride (Sigma- Aldirch, USA) was obtained and used as received; its purity was > 98%.
Nebilet® tablets (Unipharma, Syria) and Bivol® (Al-Nahdi International Medical Co., Ltd, Yemen) were labeled to contain 5 mg NBV per tablet.
2,3-Dichloro-5,6-dicyano-1,4-benzoquinone (DDQ) (Sigma – Aldrich Co); 0.1 %( w/v) solution was prepared by dissolving 0.01 g of the DDQ in 5ml of acetonitrile and then the solution was diluted to a final volume 10 ml with acetonitrile. Working solutions were freshly prepared by subsequent dilutions. This solution is prepared daily using red- glass volumetric flask because it is a light sensitive reagent.
Dinitrophenol (DNP) (0.05%) Prepared by dissolving 0.05g of dinitrophenol (Sigma –Aldrich Co) in 100mL of dichloromethane.
Picric acid (PA) (0.1%) Prepared by dissolving 0.1g of picric acid (Sigma –Aldrich Co) in 100mL of dichloromethane.
Preparation of standard stock solution
The stock standard solution of NBV was prepared in methanol to a concentration of 100μg/mL and kept stored at -20°C in dark glass flasks. Working standard solutions were prepared from the stock standard solutions.
Pharmaceutical formulations
Twenty tablets were weighed accurately and ground into a fine powder. The powder equivalent to 10mg of NBV was dissolved in methanol and shaken well for proper mixing. This solution was allowed to stand for 30min and then sonicated for complete solubilization of drugs. Then the contents were filtered using Whatman No. 42 filter paper to separate the insoluble excipients and volume was completed with same solvent to get the final concentration of 100μg/mL. The procedure was continued as described under the procedure for pure NBV.
Procedure for calibration curves
Method A: Varying aliquots (0.4- 4.0 mL) of a standard NBV solution 100μg/mL were accurately transferred into a series of 10mL calibrated flasks using a micro burette and the total volume in each flask was brought to 4mL by adding adequate quantity of acetonitrile. To each flask, 1mL of 0.1% DDQ solution was added, the content was mixed well and the absorbance was measured at 620nm against a reagent blank similarly prepared without adding NBV solution.
Method B: Different aliquots (0.2- 2.5mL) of standard NBV solution 100μg/mL were accurately transferred into a series of 10mL calibration flasks as described above. One milliliter of 0.1% DNP solution was added to each flask and diluted to volume with dichloromethane. The content was mixed well and the absorbance was measured at 525nm against a reagent blank.
Method C: Aliquots (0.1 – 3.5 mL) of a standard NBV 100μg/mL solution were accurately transferred into a series of 10mL calibration flasks and the total volume was brought to 1.5mL by adding acetonitrile. To each flask, 1mL of 0.05% PA solution was added and the solution made up to volume with dichloromethane. The content was mixed well and the absorbance was measured at 500nm against a reagent blank. Standard graph was prepared by plotting the absorbance versus NBV concentration, and the concentration of the unknown was read from the calibration graph or computed from the respective regression equation.
Procedure for the analysis of placebo blank and synthetic mixture
A placebo blank containing starch (40mg), lactose (35mg), sodium citrate (35mg), hydroxyl cellulose (35mg), magnesium stearate (35mg), talc (35mg) and sodium chloride (35mg) was prepared by mixing all the components into a homogeneous mixture. A 10mg of the placebo blank was accurately weighed and its solution was prepared as described under ‘tablets’, and then subjected to analysis by following the general procedures. An accurately weighed quantity of NBV was added to 200mg of placebo blank and homogenized. An amount of synthetic mixture equivalent containing 10.0mg NBV was accurately weighed and transferred into a 100mL volumetric flask and the extract equivalent to 100μg/mL NBV was prepared as described under the general procedure for pure drug and further diluted to the required concentration and used for the assay in all the three methods.
Results and Discussion
Absorption spectra
The reaction of NBV as n-electron donor and the π-acceptors such as DDQ, DNP and PA results in the formation of charge transfer complexes. The absorption spectra of NBV-DDQ charge transfer complex resulted in the formation of an intense which exhibited three maxima at 620, 525and 400 nm. These bands can be attributed to the formation of DDQ radical anions arising from the complete transfer of n-electrons from donor to acceptor moieties in acetonitrile. The absorption band at 620nm was selected as analytical wavelength keeping in view the sensitivity of the reaction product and blank absorbance (Figure 2). Similarly, the reaction of NBV with DNP or PA results in the formation of an intense red product which exhibits absorption maxima at 525nm and 500nm (Figure 3) and (Figure 4), respectively.
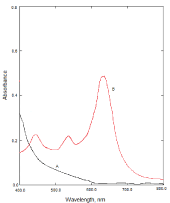
    Figure 2: A: Absorption spectra of reagent blank solution, B: Absorption
spectra of NBV-DDQ complex (15μg/mL NBV).
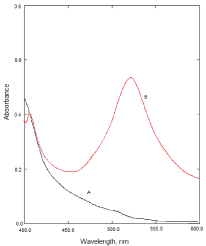
    Figure 3: A: Absorption spectra of reagent blank solution, B: Absorption
spectra of NBV-DNP complex (12μg/mL NBV).
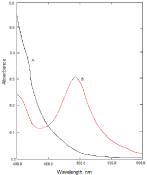
    Figure 4: A: Absorption spectra of reagent blank solution, B: Absorption
spectra of NBV-PA complex, (10μg/mL NBV).
Reaction scheme
The chemistry used in method A is based on the reaction of the basic nitrogen of NBV as n-donor with DDQ as π-acceptor to form charge transfer complex, which subsequently dissociates into radical anions depending on the polarity of the solvent used [20]. In polar solvents, such as acetonitrile, complete electron transfer from the donor to the acceptor moiety takes place with the formation of intensely colored radical anions (Figure 5) [22], according to the following equation:
[Donor+Acceptor?Complex?Radical ions]
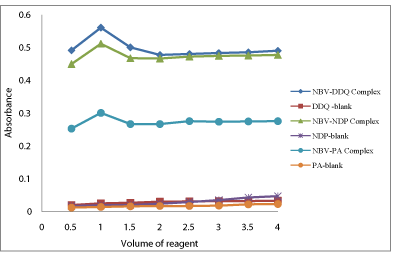
    Figure 5: Effect of reagent concentration on the formation of NBV-DDQ
complex, (15μg/mL NBV), NBV-DNP complex, (12μg/mL NBV) and NBV-PA
complex, (10μg/mL NBV).
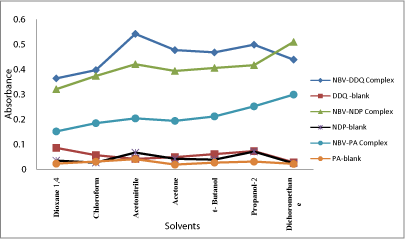
    Figure 6: Effect of solvents on the formation of NBV-DDQ complex, (15μg/
mL NBV), NBV-DNP complex, (12μg/mL NBV) and NBV-PA complex, (10μg/
mL NBV).
When an aromatic amine is combined with a polynitrophenol, one type of force field produces an acid base interaction, and the other, an electron donor acceptor interaction. Probable mechanism for the formation of NBV-DDQ charge transfer complex (Scheme 1). Probable mechanism for the formation of NBV-DNP and NBV-PA charge transfer complexes the formation of true phenolate by protontransfer, and the latter, to a true molecular compound by chargetransfer [23]. Based on this, the mechanism for method B and method C can be discussed in terms of transfer of electronic charge from the benzene ring of NBV, an electron-rich molecule (a Lewis-base donor), to the ring of DNP or PA, an electron-deficient molecule (a Lewisacid acceptor), and at the same time the proton of the hydroxyl group of DNP or PA will transfer to the secondary amine of NBV (Scheme 2). The explanation for the produced color in method B and method C lies in the formation of complexes between the pairs of molecules NBV-DNP and NBV-PA, and this complex formation leads to the production of two new molecular orbitals and, consequently, to a new electronic transition [24].
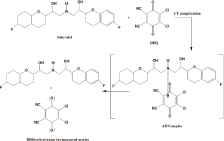
    Scheme 1: Probable mechanism for the formation of NBV-DDQ charge
transfer complex.
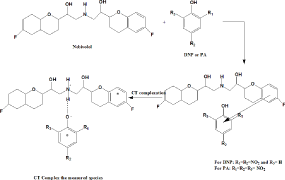
    Scheme 2: Probable mechanism for the formation of NBV-NDP and NBV-PA
charge transfer complex.
Stoichiometry of the reaction
The composition of the charge transfer complex was established by Job’s method of continuous variations [25] using equimolar concentrations of the drug (base form) and reagents 2x10⁻⁴mol/L. The results indicated that 1:1 (drug/reagent) complex is formed in all the methods. Five solutions containing NBV and the reagents DDQ, DNP or PA in various molar ratios, with a total volume of 10mL in all the methods were prepared. The absorbance of solutions was subsequently measured at 620nm in method A, 525 in method B and 500nm in method C. The graphs of the results obtained gave a maximum at a molar ratio of Xmax =0.5 in all the methods which indicated the formation of a 1:1 charge transfer complex between NBV and reagent DDQ, DNP or PA. This finding was anticipated by the presence of more basic or electron donating center (–NH) in the NBV.
Effect of reagent concentration
The optimum concentration of the reagent required to achieve maximum sensitivity for the color developed in each method was ascertained by adding different amounts of the reagent DDQ, DNP or PA to a fixed concentration of NBV. The results showed that 1.0mL each of 0.1% DDQ, 0.1% DNP and 0.05% PA solution was optimum for the production of maximum and reproducible color intensity (Figure 5).
Effect of solvent
In order to select a suitable solvent for preparation of the reagent solutions used in the study, the reagents were prepared separately in different solvents such as 1,4-dioxane, chloroform, acetonitrile, acetone, t-butanol, 2-propanol and dichloromethane, and the reaction of NBV with DDQ, DNP or PA was followed. In method A, as shown in Figure 6, acetonitrile was best suited for preparation of DDQ solution. The dichloromethane solvent was found to be the ideal solvent for preparation of both DNP and PA for method B and method C, respectively (Figure 4). Similarly, the effect of the diluting solvent was studied for all methods and the results showed that the ideal diluting solvent to achieve maximum sensitivity was acetonitrile in method A and dichloromethane in method B and method C.
Effect of reaction time and stability of the charge transfer complexes
The optimum reaction times were determined by measuring the absorbance of the complex formed upon the addition of reagent solution to NBV solution at room temperature. The reaction of NBV with DDQ in method A and DNP in method B was instantaneous while complete color development was attained after 5min with PA. The absorbance of the resulting charge transfer complexes remained stable for at least 45min for method A and for more than 24h for methods B and C.
Method validation
The proposed methods were validated for linearity, sensitivity, selectivity, accuracy, precision, robustness, ruggedness and recovery according to the current ICH guidelines [26].
Linearity and sensitivity
At the established experimental conditions, standard calibration curves for NBV with DDQ, DNP and PA were constructed by plotting absorbance verses concentration. The linear regression curves were obtained in the Beer’s law range of 4.0-40, 2-25 and 1.0-35μg/mL with correlation coefficient 0.9983, 9945 and 0.9985 in each case respectively. Regression characteristics including slope, intercept, correlation coefficient and also the molar absorptivity values for each proposed method are given in (Table 1). The detection limit (LOD) and quantification limit (LOQ) were calculated by using the following equations:
    Parameters
    NBV-DDQ
      complex
    NBV-DNP complex
    ZAF-PA complex


    ?max (nm)
    620
      525
    500


    Linearity range    μg/mL
    4-40
    2.0 - 25
    1.0 –35


    Molar    absorptivity L /mol .cm
    1.48 X10⁴
    1.76X10⁴
    1.21X10⁴


    Regression    equation, Y*


    Slope (b)
    0.0379
    0.0509
    0.0292


    Intercept (a)
    0.0120
    0.0524
    0.0077


    Correlation    coefficient
    0.9983
    0. 9945
    0.9990


    LOD μg/mL
    0.85
    0.27
    0.21


    LOQ μg/mL
    2.59
    0.82
    0.65


    *Y= a + bX, where Y is the    absorbance, a is the intercept, b is the slope and X is the concentration in    μg/mL.
Table 1: Optimum conditions and analytical parameters.
where, s is the standard deviation of seven replicate determinations under the same conditions as for the sample in the absence of the analyte and S is the slope of the calibration graph. The LOD values were calculated to be 2.59, 0.82 and 0.65μg/mL respectively (Table 1).
Accuracy and precision
In order to determine the accuracy and precision of the proposed methods, pure drug NBV solution at three different concentration levels (within the working range) were prepared and analyzed in seven replicates during the same day (intra-day precision) and on five consecutive days (inter-day precision)and the results are presented in (Table 2). The percentage relative error (RE%) was = 1.40 which indicates that the accuracy of the methods is satisfactory. Percentage relative standard deviation (RSD %) for intra-day was = 1.88 and for inter-day it was = 1.72 indicating repeatability and usefulness of the proposed methods in the routine analysis.
    Method
    NBV taken
      µg/mL
    Intra-day ( n=7)
    Inter-day (n=5)


    Found a
      µg/mL
    %RSDb
    % REc
    Found a
      µg/mL
    %RSD
    % RE


    Method A
    10
    10.052
    1.5
    0.52
    10.002
    1.49
    0.02


    20
    20.062
    1.48
    0.31
    20.040
    1.30
    0.20


    30
    29.822
    0.79
    0.59
    30.134
    0.66
    0.45


    Method B
    5
    4.942
    0.02
    1.16
    4.996
    1.72
    0.08


    10
    9.974
    1.34
    0.26
    10.010
    1.14
    0.10


    15
    15.082
    1.00
    0.55
    15.090
    0.96
    0.60


    Method C
    8
    8.048
    1.88
    0.60
    7.986
    1.04
    1.40


    16
    16.004
    1.13
    0.03
    16.086
    0.90
    0.54


    24
    24.102
    0.70
    0.43
    24.020
    0.55
    0.08


    aMean    value of five determinations; b Relative standard deviation (%); cRelative    error (%).
Table 2: Evaluation of intra-day and inter-day precision and accuracy.
Selectivity
The assay results were in good agreement with the label claim. Also, the effect of commonly found excipients was determined by scanning the blank solution of NBV and the placebo solutions. The percent recovery values given in Table 3 indicate that excipients of tablet did not found to interfere during the assay.
    Excipients
    Recovery%±RSD*


    Method A
    Method B
    Method C


    Lactose
    100.25±0.66
    101.91±0.82
    99.21±1.02


    Hydroxyl cellulose
    99.91±0.91
    100.79±0.65
    101.79±0.95


    Talc
    101.42±0.72
    99.62±0.37
    100.62±0.73


    Starch
    98.95±1.22
    99.11±0.94
    101.09±0.44


    Magnesium    stearate
    99.63±0.36
    102.01±1.03
    100.89±1.13


    Sodium Citrate
    101.19±0.93
    98.81±0.94
    99.21±0.49


    Sodium chloride
    99.08±1.03
    99.67±0.63
    101.67±1.23


    *Average of three determinations.
Table 3:  Analysis of NBV in presence of common excipients by the proposed
method.
Robustness and ruggedness
To evaluate the robustness of the methods, two important experimental variables volume of reagent and reaction time, were slightly altered and the effect of this change on the absorbance of the charge transfer complexes was studied. The results of this study are presented in Table 4 and indicated that the proposed methods are robust. Method ruggedness was evaluated by performing the analysis following the recommended procedures by three different analysts and on three different spectrophotometers by the same analyst. From the %RSD values presented in (Table 4), one can conclude that the proposed methods are rugged.
    Method
    NBV taken
      µg/mL
    Method robustness
    Method ruggedness


    Parameters    altered


    Reagent volumea,    mL RSD%
      (n=3)
    Reaction time b
      RSD%,
      (n=3)
    Inter-analysts    RSD%,
      (n=3)
    Inter-cuvettes
      RSD%,
      (n=3)


    Method A
    10
    0.94
    0.68
    1.35
    1.06


    20
    1.11
    1.26
    1.02
    0.93


    30
    0.69
    1.39
    1.67
    1.40


    Method B
    5
    1.31
    1.02
    0.95
    0.67


    10
    0.75
    1.22
    1.53
    0.99


    15
    0.84
    0.86
    0.61
    1.06


    Method C
    8
    1.30
    1.18
    1.65
    0.93


    16
    0.92
    0.75
    1.30
    1.19


    24
    0.79
    1.05
    1.21
    1.37


    aIn    both methods, the volume of reagent was 0.8, 1.0 and 1.2 mL. bThe    reaction time was 4, 5 and 6 min.
Table 4: Robustness and ruggedness.
Applications to analysis of tablets
The proposed methods were successfully applied to the determination of NBV in three brands of tablets and the results are compiled in Table 5. The results obtained were statistically compared with those obtained by the reference method [16] by applying the student’s t-test for accuracy and F-test for precision at 95% confidence level. As can be seen from (Table 5), the calculated t- and F- values at 95% confidence level did not exceed the tabulated values of 2.78 and 6.39, respectively, for four degrees of freedom. This indicates that there are no significant differences between the proposed methods and the reference method with respect to accuracy and precision.
    Tablet brand name
    Label Claim    (mg)
    Methods
    Amount of    Drug Estimated*
      ( in mg)
    %Recovery ±SD*
    T-test**
    F-test***


    Nabilet®
    5
    Method A
    5.09
    101.8±0.64
    1.06
    2.19


    Method B
    5.06
    101.2±0.72
    1.12
    2.03


    Method C
    4.98
    99.6±1.02
    0.72
    5.58


    Reference method
    5.04
    100.8±0.66
    -
    -


    Bivol®
    5
    Method A
    5.05
    101.1±1.85
    0.64
    1.12


    Method B
    4.97
    99.3±1.71
    1.51
    4.35


    Method C
    4.91
    98.2±1.11
    2.52
    2.74


    Reference method
    4.96
    99.2±1.05
    -
    -


    *Mean value of five determinations.
      **Tabulated t-value at the 95%    confidence level is 2.78.
      ***Tabulated F-value at the 95%    confidence level is 6.39.
Table 5: Results of analysis of tablets by the proposed methods.
Recovery study
The accuracy and validity of the proposed methods were further ascertained by performing recovery studies. Pre-analyzed tablet powder was spiked with pure NBV at three concentration levels (50, 100 and 150 % of that in tablet powder) and the total was analyzed by the proposed methods. The results of this study are presented in Table 6 and indicate that the excipients present in the tablets did not interfere in the assay.
Tablets studied
Method A
Method B
Method C
NBV in tablets
µg/mL
Pure NBV added μg/mL
Total found μg/mL
%Recovery* ±SD
NBV in tablets
mg/mL
Pure NBV added μg/mL
Total found μg/mL
%Recovery* ±SD
NBV in tablets
mg/mL
Pure NBV added μg/mL
Total found μg/mL
%Recovery* ±SD
Nabilet®
8
4
12.24
102.00 ±1.02
6
3
9.11
101.22±0.67
5
5
9.94
99.40±0.81
8
15.85
99.06±1.61
6
11.87
98.92±1.16
10
15.09
100.60±1.30
12
20.35
101.75± 0.68
9
15.25
101.67±0.88
15
19.86
99.30±0.94
10
5
15.38
102.53±1.46
8
4
12.10
100.83±1.12
12
6
17.48
102.82±1.43
10
20.54
102.54±1.23
12
20.40
102.00±0.67
12
24.36
101.50±0.78
15
24.64
98.56±0.98
16
23.78
99.08±0.76
18
29.71
99.03±0.57
*Mean value of three determinations.
Table 6: Results of recovery study by standard addition method.
Conclusions
This paper presents three visible spectrophotometric methods for the quantitative determination of Nebivolol (NBV) in pure drug and tablets. The proposed methods are based on charge-transfer complexation reaction, and have the advantages of simplicity, speed, accuracy and precision. The methods are characterized by wide linear dynamic ranges and high sensitivity compared to many existing spectrophotometric methods. Moreover, the proposed methods are free from the usual analytical complications like heating or extraction steps and can be performed at room temperature. Thus, the proposed methods are useful for the quality control and routine analysis of NBV in pharmaceuticals because there is no interference from the common excipients usually found in commercial tablets.
References
- Neil MJ. The Merck Index-an Encyclopedia of Chemicals, Drugs and Biologicals, 14th edn, Merck & CoInc; 2006: 6432.
- Sweetman SC. Martindale: The complete Drug Reference, 35th edn, London: Pharmaceutical Press; 2007: 121.
- Xhonneux R, Wouters L, Reneman RS, Janssen PAJ. The l-enantiomer of nebivolol potentiates the blood pressure lowering effect of the d-enantiomer. Eur J Pharmacol. 1990; 181: 261-265.
- Thevis M, Opferman G, Schanzer W. High speed determination of beta-receptor blocking agents in human urine by liquid chromatography/tandem mass spectrometry. Biomed chromatogram. 2001; 15: 393-402.
- Anilkumar S, Bhavesh PRP. Simultaneous estimation of nebivolol hydrochloride and samlodipinebesylate by high performance. Thin Layer Chromato, Inter J of Pharma and Bio Sci. 2010; 1: 339-346.
- Atul AS, Prasad MB, Sanjay JS. First order derivative spectrophotometric determination of nebivolol in bulk and tablets. Pharma Review. 2008; 141-144.
- Malipatil SM, Deepthi M, Patil SK, KiswarJ. Second and third order derivative spectrophotometric estimation of nebivolol hydrochloride in bulk and pharmaceutical dosage forms. Inter J of Pharmacy and Pharma Sci. 2011; 3: 13-15.
- Ramakrishna NVS. Rapid quantification of nebivolol in human plasma by liquid chromatography coupled with electrospray ionization tandem mass spectrometry. J of Pharma and Bio Ana. 2005; 39: 1006-1013.
- Shah A, Bhatt KK, Mehta RS, Baldania SL, Gandhi TR. Stability indicating RP-HPLC estimation of nebivolol hydrochloride in pharmaceutical formulations. Indian J pharm Sci. 2008; 70: 591-595.
- Sastry BS, Srinivasulu D, Ramana H. Reverse phase hplc method for the analysis of nebivolol in pharmaceutical dosage forms. JPRHC. 2009; 1: 25-33.
- Senthamil Selvan P, Veeran Gowda K, Mandal U, Sam Solomon WD, Pal TK. Simultaneous determination of fixed dose combination of nebivolol and valsartan in human plasma by liquid chromatographic-tandem mass spectrometry and its application to pharmacokinetic study. J Chromatogr B. 2007; 858: 143-150.
- Jatin Nandaniaa, SJ. Rajput PC, Pragnesh V, Bhavik S, Mohsin V. Quantitative determination of nebivolol from human plasma using liquid chromatography–tandem mass spectrometry. J Chromatography B. 2013; 923– 924: 110–119.
- Parambi DGT, Mathew M, Jose A, Revikumar KG. A validated U.V spectrophotometric determination of an antihypertensive drug – nebivolol from tablet formulations. InterJ Pharmal Sci Rev and Res. 2010; 3: 139-141.
- Kamila MM, Mondal N, Ghosh LK, Gupta BK. A validated UV spectrophotometric method for estimation of nebivolol hydrochloride in bulk and pharmaceutical formulations. Pharmazie. 2007; 62: 486-487.
- Chandnani VC, Gupta KR, Chopde CT, Kunjwani HK, Manikrao AM, Shivhare SC. Simultaneous uv-spectrophotometric determination of amlodipine besylateand nebivolol hydrochloride in tablet dosage form. Inter J Chem Tech Research. 2010; 2: 69-73.
- Lakshmana Rao A, Rajeswari KR, Sankar GG. Spectrophotometric method for the determination of nebivolol hydrochloride in bulk and pharmaceutical formulations. E-J Chemistry. 2010; 7: 445-448.
- Mural D, Neeharika T, Rambabu C. Spectrophotometric Determination of Nebivolol Hydrochloridein Bulk and Pharmaceutical Formulations. Asian J Chem. 2013; 25: 2981-2984.
- Sharma T, Gowrisankar D, Chandra SS, Extractive spectrophotometric determination of nebivolol hydrochloride in pharmaceutical formulation and biological fluids. Inter J Pharm Tech Res. 2014; 6: 1571-1579.
- Alhemiary N. A novel spectrophotometric method for determination of nebivolol hydrochloride in tablets dosage form with 1,2-naphthoquinone-4-sulphonate as a chromogenic reagent. Am J Pharm Tech Res. 2015; 5: 556-569.
- Nafisur R, Mohammad K. Optimized and validated spectrophotometric methods for the determination of roxatidine acetate hydrochloride in drug formulations using 2,3-dichloro-5,6-dicyano-1,4-benzoquinone and p-chloranilic acid. J Anal Chem. 2005; 60: 636 -643.
- Basavaiah K, Abdulrahman SAM. Use of charge transfer complexation reaction for the spectrophotometric determination of bupropion in pharmaceuticals and spiked human urine. Thai J Pharm Sci. 2010; 34: 134-145.
- Abdel-Hamid ME, Abdel-Salam M, Mahrous MS, Abdel-Khalek MM. Utility of 2,3-dichloro-5,6-dicyano-p-benzoquinone in assay of codeine, emetine and pilocarpine. Talanta.1985; 32: 1002-1004.
- Saito G, Matsunaga Y. Charge-Transfer and Proton-Transfer in the Formation of Molecular Complexes. I. The Complex Isomerization of Some Anilinium Picrates by Melting. Bull Chem Soc Jpn.1971; 44: 3328 3335.
- Kemp W. Organic Spectroscopy, 3rd edn, Delhi, India, Replika Press Pvt. Ltd; 2006: 274.
- Harikrishna K, Nagaralli BS, Seetharamappa J. Extractive spectrophotometric determination of sildenafil citrate (viagra) in pure and pharmaceutical formulations. J Food Drug Anal. 2008; 16: 11–17.
- International Conference on Hormonisation of Technical Requirements for Registration of Pharmaceuticals for Human Use, ICH Harmonised Tripartite Guideline, Validation of Analytical Procedures: Text and Methodology Q2(R 1), Complementary Guideline on Methodology dated 06 November 1996, London, (incorporated in November 2005).