
Research Article
Austin J Anal Pharm Chem. 2017; 4(2): 1087.
Development and Validation of Related Compounds Method for Lorazepam Tablets by Reverse Phase UPLC
Siddareddy K¹*, Aswartha Umakantareddy M¹ and Sreeramulu J²
¹Department of Chemistry, Rayalaseema University, Andhra Pradesh, India
²Department of Chemistry, Sri Krishnadevaraya University, Andhra Pradesh, India
*Corresponding author: Konda SR, Department of Chemistry, Rayalaseema University, Kurnool-518002, Andhra Pradesh, India
Received: June 22, 2017; Accepted: July 18, 2017; Published: July 25, 2017
Abstract
A Novel, stability indicating reversed phase ultra performance liquid chromatography (UPLC) method has been developed and validated for determination of Lorazepam (LP) related compounds in pharmaceutical dosage form. This chromatographic separation was carried out on an Acquity UPLC HSS T3 using reversed phase column (100 x 2.1mm, 1.8μm), a simple isocratic program for 10 minutes used. Mobile phase consists a mixture of water: Acetonitrile: Acetic acid in ratio of 50:42:1.2 (v:v:v), mobile phase flow rate used constantly at 0.50mL /minute. The chromatography analysis was monitored at 230nm with column oven temperature at 25 °C and injection volume as 10μL. All the components were separated with good resolution in less than 10 minutes. The proposed method has been validated according to ICH guidelines, validation of method showed it to be Specific, Precise, Accurate, Robust, Rugged and Linear over a range of analysis.
Keywords: UPLC; Lorazepam; Lorazepam related compounds; Active Pharmaceutical Ingredient; ICH guidelines
Nomenclature and Units: mL: Milli Liter; Min: Minutes; μg: Micro gram; %: Percentage; RSD: Relative Standard Deviation
Introduction
Lorazepam (LP) chemically named as 7-chloro-5-(2- chlorophenyl)-3-hydroxy-1,3-dihydro-1,4-benzodiazepin-2-one [5], is used for short-term treatment of anxiety, insomnia, acute seizures including status epilepticus and sedation of hospitalized patients, as well as sedation of aggressiveness patients [1-4]. It is white or almost white, crystalline powder, practically insoluble in water, sparingly soluble in ethanol (96%), sparingly soluble or slightly soluble in methylene chloride. The molecular formula is C15H10Cl2N2O2 and the molecular weight is 321.2g/mol. It contains five specified related impurities. The chemical structure of Lorazepam and its related impurities were shown Figure 1.
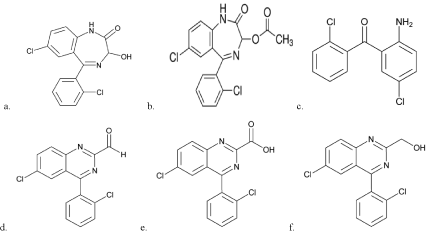
    Figure 1:  Chemical structures for a. Lorazepam b. Related Compound A c.
Related Compound B d. Related Compound C e. Related Compound D f.
Related Compound E.
There were few methods proposed for estimation of LP such as HPLC [6,7], by GC [8], by FTIR [9], by Luminescence [10] and in plasma [11-13]. There was one method proposed for Lorazepam related compounds by HPLC [14], this method has higher runtime with higher mobile phase volume and more over it is not a stability indicating.
Ultra performance liquid chromatography (UPLC) has been considered as a novel development in liquid chromatography. It is specially designed to with stand higher system pressures during chromatographic analysis so that it enables significant decrease in separation time and solvent consumption. The UPLC columns packed with 1.8μm sized particles provides not only increased efficiency but also the ability to work at increased linear velocity without loss of efficiency providing both resolution and speed. Using advantages of UPLC, a number of applications in different fields including pharmacy [15], clinical analysis, pesticide analysis [16] and tetracyclines in human urine [17] have reported.
In literature survey, as far as we aware there was no UPLC method for quantitative estimation of LP degradation products along with potential impurities has been reported. The purpose of the present work was the development of a rapid, stability indicating UPLC method for the determination of LP related compounds in the pharmaceutical dosage forms and to establish the degradation pathway for LP along with its four potential impurities. The developed method was validated according to International Conference on Harmonization (ICH) guidelines [6]. Accordingly the aim of the present study is to establish degradation pathway of LP through stress studies under variety of ICH recommended test conditions. The results prove that the UPLC method is rapid, productive and cost effective for commercial analysis.
Materials and Methods
Chemicals and reagents
HPLC grade of Acetonitrile and Methanol is from Acrose (New Jersey, USA), Sodium acetate trihydrate and Acetic acid is from (Sigma Aldrich). HPLC grade water used for the mobile phase preparation was produced by Elga water system (Germany). Active pharmaceutical ingredient Lorazepam and its related compounds procured from LGC standards. Lorazepam tablets obtained from local pharmacy.
Equipment and chromatographic conditions
The UPLC system is Waters Acquity (Milford, USA) equipped with binary solvent mangers, Ultra fast auto-sampler and a UV visible Detector was used to make sample injections. A reversed phase Acquity UPLC HSS T3 column with dimensions 100 x 2.1mm, 1.8μm particle size was used for analysis, column temperature used at 25°C. Mobile phase consist a mixture of Acetonitrile: Water: Glacial acetic acid in ratio of 42:50:1.2 and delivered at 0.5mL/Min. The Sample injection volume used as 10μL and chromatography was monitored at Detector wavelength 230nm. Photo stability studies are carried out in photo stability chamber (atlas Sunset CPS+). Thermal stability studies are carried out in a dry hot air oven (Cintex precision hot air oven).
Diluent
It consist a mixture of 0.5M Sodium acetate buffer pH adjusted to 5.0 with acetic acid and Methanol in ratio of 75:25 v/v.
Standard and samples solutions
Working standard solution preparation: Standard solutions at a concentration of about 1.6μg /mL of Lorazepam was prepared by dissolving the appropriate amount of standard in diluent, filtered the solution through 0.2μm membrane filter.
Sample solution: Weighed a grinded tablets powder equivalent to 25mg of Lorazepam in 25mL volumetric flask, added 18mL of diluent sonicated for one minute and mechanically shacked for 15 minutes then diluted to volume with diluent. Transferred a small portion in to centrifuge tube and centrifuged for 15 minutes. Pipetted a 4mL of clear supernatant liquid and transferred into a 25mL of volumetric flask, diluted to volume with diluent, filtered the solution through 0.2μm membrane filter before injection.
Impurity standard stock solution: An individual USP Lorazepam Related compound A1 (A), Related compound B (B), Related compound C (C), Related compound D (D) and Related compound E (E) standard stock solutions at a concentration of about 16μg/mL were prepared by dissolving the appropriate amount of standard in diluent, filtered the solution through 0.2μm Nylon membrane filter. These solutions were further diluted based on requirements in method validation parameters.
¹Note: Since Related compound A is a process impurity, it was not used in method validation except for specificity.
Method validation solutions
Linearity solutions: Linearity solutions were prepared by diluting Standard stock solution at six different concentrations levels ranging from 0.14-0.34μg/mL, 0.13-8.85μg/mL, 0.07-1.62μg/mL, 0.07-1.58μg/ mL and 0.3-2.56μg/mL for impurities B, C, D, E and Lorazepam respectively. The responses were measured as peak areas and plotted against concentration.
Specificity solutions: Forced degradation studies were performed to demonstrate selectivity and stability-indicating capability of the proposed method [18,19]. The sample and Placebo were exposed to acid (0.5N HCl, 60min at 60°C), base (1.0N NaOH, 24 Hours at Room temperature), strong oxidation (10% H2O2 for 24 Hours at Room temperature), thermal (105°C, 2 hours), and photolytic (1.2 million lux h, 200wh/m2, 2 days) degradation conditions. Samples were withdrawn at appropriate times and subjected to UPLC analysis after dilution equal to sample solution concentration to evaluate the ability of the proposed method to separate analytes from its impurities and placebo. Photo diode array detector was employed to check and ensure the homogeneity and purity of each analyte peak in all the stressed sample solutions.
Precision samples: Method precision samples were prepared by spiking the targeted impurities at concentration of 0.2% for B, 2.5% for C, 0.5% for D and 0.5% for E to the sample solution. Injected six independent sample preparations against working standard and calculated the %RSD for % obtained impurity values.
Accuracy solutions: The recovery experiments samples were prepared by spiking the impurity solutions to test sample at LOQ, 100 and 120% of the impurity specification limit i.e. 0.2% for B, 3.0% for C and 0.5% for D and E. Calculated the % Recovery using ‘obtained’ and ‘spiked’ amounts.
Robustness solutions: To determine the robustness of the developed method, the experimental conditions are altered and the resolution between Impurity A and E is evaluated. The flow rate of the mobile phase is 0.50mL/min. To study the effect of the flow rate on the resolution, the flow rate is changed by 0.1 units (to 0.4 and 0.6mL/ min). The effect of the column temperature on resolution is studied at 25°C and 30°C. The effect of organic mobile phase ratio is studied by varying ±5% (to 40 and 44). The working standard and spiked sample solutions were used and evaluated variance in each varied condition.
Stability of the solution: The solution study of LP and its impurities is carried out by leaving a spiked sample solution in a tightly capped UPLC vials at 5°C for 24hrs. The content of related compounds B, C, D and E is determined at every 6 hours interval up to 24hrs.
Limit of Detection (LOD) and Limit of Quantification (LOQ): The LOD and LOQ for Related compounds B, C, D and E are estimated at signal-to-noise ratio of 3:1 and 10:1, respectively, by injecting a series of dilute solutions with known concentrations. The precision study is also carried out at the LOQ level by injecting six individual preparations of targeted impurities and calculated the % RSD of the areas.
Filter Study: Filter study was performed to determine the filter suitability for standard and sample filtration and to determine the amount of filtrate to be discarded before a sample solution is collected for analysis. This was performed by comparison of results between centrifuged sample and filtered sample.
Result and Discussion
Method development and optimization
The main objective of the present chromatographic method development is to separate the related compounds A, B, C, D , E , Lorazepam and the generated degradation products from the anlayte peak during stress studies. Impurities and degradation products are co eluted by using different stationary phases, such as Acquity BEH C18, C4 with various mobile phase combinations.
After few experiments, the separation was performed by reversed phase UPLC on Acquity HSS T3 100 x 2.1mm 1.7μm UPLC column using a gradient mobile phase. Mobile phase consist a mixture of Acetonitrile: Water: Glacial acetic acid in ratio of 50:48:1.2 (v/v) and mobile phase flow rate used constantly at 0.5mL/minute, the column oven temperature used at 25°C. It has been observed that the all placebo peaks and impurity peaks were well separated but related compound A and E were co eluted.
Further, to improve separation between Imp-A and E impurities, different parameters were investigated including different mobile phase gradient programs. The decreased organic ratio resulted better separation and peak shape with mobile phase consist a mixture of Acetonitrile: Water: Glacial acetic acid in ratio of 42:50:1.2 (v/v). A detection wavelength 230nm was selected where all components exhibit almost a satisfactory response. A typical chromatogram of spiked sample showing the separation represented in Figure 2 and the Retention and Relative retentions time data were presented in Table 1. The tailing factor for LP is 1.2 and % RSD for six replicates found less than 1.0%. The resolution between related compounds A to E found not less than 2.2. The S/N ratio for Impurity B solution at concentration 0.016μg/mL (0.1%) found 6.
    Compound    name
    Retention time (Min)
    Relative    Retention Time (RRT)2


    LP
    1.3
    1.8


    Imp-D
    1.8
    1.9


    Imp-A
    2.3
    5.5


    Imp-E
    2.5
    1.0


    Imp-C
    3.0
    1.4


    Imp-B
    7.0
    2.3


    2Relative    Retention times are with respect to Lorazepam peak.
Table 1: Peaks Retention and Relative retention time data.
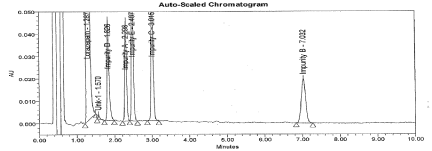
Figure 2: Typical chromatogram for spiked sample.
Analytical parameters and validation
After satisfactory development of method, product was subjected to method validation per ICH guidelines [6]. The method was validated to demonstrate its suitability for intended purpose using the standard procedure and the validation characteristics including System Suitability, Specificity, Accuracy, Precision, Ruggedness, Robustness, LOQ, Linearity and Stability of solution have been evaluated.
System suitability: The main purpose to perform system suitability was to check suitability of machine to perform method validation. This was established by calculating the percentage Relative Standard Deviation for an average area of six replicate injections of working standard. The % RSD found below 0.9, the Tailing factor for analyte peak found 1.2. The S/N ratio for 0.1% Imp-B solution found 6. The typical chromatogram for working standard and 0.1% Impurity B solution represented in Figure 3 and 4.
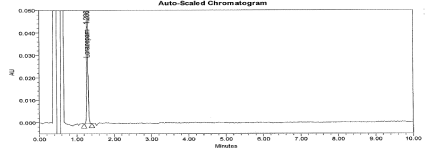
Figure 3: Typical chromatogram for working standard solution.
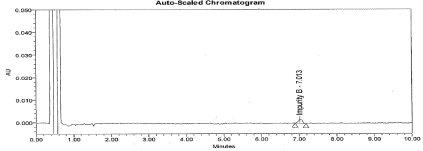
Figure 4: Typical chromatogram for 0.1% Impurity B.
Specificity: There was no interference from the Diluent (Blank) and Placebo (Figure 5 and 6). The forced degradation data revealed that Lorazepam is very sensitive to base, UV light and thermal degradation. The impurities B, C, and D were predominantly formed due to Thermal and Basic degradation, where as Impurity E formed only in Thermal. Two unspecified impurities (> 0.05%) were found in UV light degradation; however there was no interference from degradation impurities at retention time of Lorazepam and targeted impurity peaks. The Purity data for each analyte peak shows the peak is pure and there were no co-eluting peaks. Hence method proved that specific. The typical chromatogram for Forced degradation samples are represented in from Figure 7 to 11.
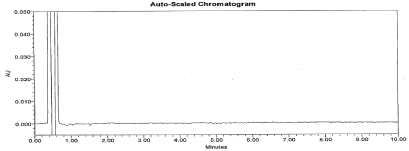
Figure 5: Typical chromatogram for Placebo.
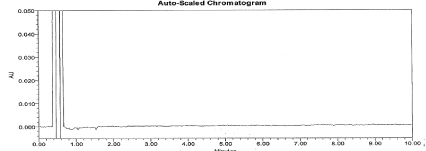
Figure 6: Typical chromatogram for Blank.
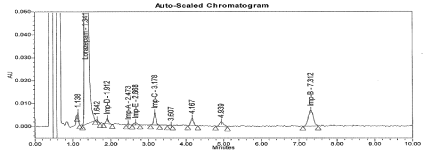
Figure 7: Typical chromatogram for Acid Degradation sample.
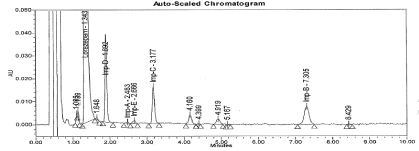
Figure 8: Typical chromatogram for Base Degradation sample.
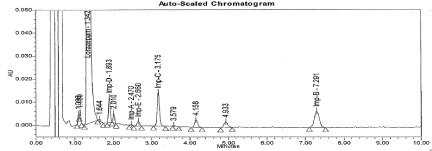
Figure 9: Typical chromatogram for Peroxide Degradation sample.
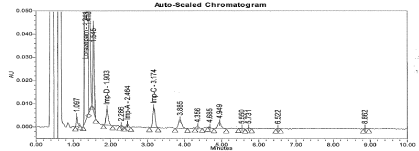
Figure 10: Typical chromatogram for UV light Degradation sample.
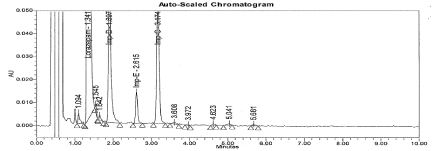
Figure 11: Typical chromatogram for Thermal Degradation sample.
Precision at Limit of Quantitation (LOQ): The concentration with Signal to noise (S/N) ratio of at least not less than 10 for LOQ and 3 for LOD was taken. A series of diluted impurity and LP solutions were injected and calculated S/N ration using empower software. The obtained concentrations were presented in Table 2. The precision at LOQ was carried out by spiking the impurities at LOQ concentration to placebo solution and calculated the %RSD for six sample, the results of LOQ concentration and %RSD for each analyte peak are presented in Table 2.
    Parameter
    LP
    Imp-B
    Imp-C
    Imp-D
    Imp-E


    Slope
    109045
    114046
    85876
    84341
    156869


    Y    intercept
    876
    -4945
    -1567
    215
    559


    R2
    0.9999
    0.9977
    0.9999
    0.9998
    0.9998


    LOQ μg/mL
    0.051
    0.132
    0.12
    0.064
    0.062


    %    RSD at LOQ Precision (n=6)
    5.4
    7.8
    9.2
    6.6
    5.2
Table 2: Summery of Linearity and LOQ results.
Linearity: To demonstrate the linearity of detector response for impurities B, C, D and E, injected the solutions of concentrations ranging from LOQ to 150% of specification limit concentration. To demonstrate the linearity of detector response for LP, injected the solutions of concentrations ranging from LOQ to 150% of working standard concentration. Calculated the correlated coefficient and found to be greater than 0.99 indicated that magnificent correlation between the analyte concentration and peak area. The slope, Y intercept and regression coefficient results were presented in Table 2.
Precision: The values of the % relative standard deviation for sample repeatability lie well within 5.0 indicating the sample repeatability of the method is satisfactory. The results are presented in Table 3. The typical chromatogram for Un-spiked and spiked sample is presented in Figure 2 and 12.
    Sample    No
    Imp-B
    Imp-C
    Imp-D
    Imp-E


    %impurity


    1
    0.24
    2.85
    0.48
    0.56


    2
    0.23
    2.84
    0.47
    0.55


    3
    0.23
    2.86
    0.47
    0.56


    4
    0.23
    2.85
    0.47
    0.57


    5
    0.22
    2.86
    0.48
    0.56


    6
    0.22
    2.86
    0.48
    0.56


    Mean
    0.23
    2.85
    0.48
    056


    %RSD
    3.30
    0.27
    1.2
    1.2
Table 3: Compiled data of method precision.
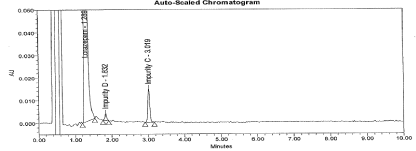
Figure 12: Typical chromatogram for Un-spiked sample.
Accuracy: The accuracy results were expressed in terms of mean percentage. The percentage recoveries obtained from triplicate sample found in a range of 90 to 100. The results were presented in Table 4. The recovery results indicate that the method is accurate and found that there was no interference due to the presence of excipients in the formulation.
    Accuracy    level
    Imp-B
    Imp-C
    Imp-D
    Imp-E


    Average Recovery


    LOQ
    90.0
    97.2
    94.3
    99.5


    80%
    92.9
    98.9
    95.6
    99.5


    100%
    90.7
    98.9
    96.1
    99.8


    120%
    90.3
    96.6
    95.5
    99.4
Table 4: Accuracy results.
Robustness: In all the deliberately varied chromatographic conditions carried out as described in section 3.5 ( flow rate, Column temperature and organic mobile phase composition), the resolution between the closely eluting impurities, namely Imp-A and E is greater than 2.0, the %RSD for system suitability standard injections found less than 3.0%, illustrating the robustness of the method.
Stability of sample solution: The stored Sample and Working standard solutions at refrigeration condition were analyzed at intervals of 6, 12, 18 and 24 hours using fresh working standard. The difference in area count was compared from initial to 24 hours, the results of solution stability for standard and samples found to be stable up to 24hrs at refrigeration temperature 5±2°C.
Filter study: The test sample was prepared by spiking impurities at specification limits described in section 3.4 and a portion of the sample was centrifuged to get the clear supernatant. The centrifuged sample was used as a control for the filter study. A portion of the supernatant solution was filtered through 0.2μm membrane filter (Polyether Sulfonate) by discarding the first 2mL, 4mL and 6mL filtrate and collected a fraction in to an individual UPLC vial and injected.
The difference in area count when comparing filtered and centrifuged sample solutions, the results found that first 2mL of solution should be discarded before collecting for analysis.
Conclusions
The degradation pathway of Lorazepam is established as per ICH recommendations. A rapid stability indicating UPLC method has been developed and used for stress studies also fit for quantitative related compounds determination of Lorazepam. The behavior of Lorazepam under stress conditions is studied. All the degradation products and process impurities are well separated from the drug substance which demonstrates the stability indicating power of RPUPLC analytical method. The method has validated for Specificity, Accuracy, Precision, Linearity, Robustness, Ruggedness, Solution stability and Filter study per ICH guidelines. The method uses a simple mobile phase composition, easy to prepare. The rapid run time of 10 minutes and relatively low flow rate (0.50mL/Minute) allows the analysis of large number of samples with less mobile phase that proves to be cost effective.
Method Application
The UPLC method is Novel, rapid and stability indicating for the quantitative determination of Lorazepam impurities in pharmaceutical tablet formulation.
Acknowledgement
The help rendered by Dr. J. Sreeramulu, Ph.D. Professor, department of Chemistry, Sri Krishnadevaraya University, Anantapur, A.P, India.
References
- Hindmarch I. Benzodiazipines and their effects. 1997. [Benzo.org.uk]. 2017.
- Cox CE, Reed SD, Govert JA, Rodgers JE, Campbell-Bright S, Kress JP, et al. An Economic evaluation of propofol and Lorazepam for critically III patients undergoing mechanical ventilation. Critical Care medicine. 2008; 36: 706-714.
- Walker M. Status epilepticus: An evidence based guide. BMJ. 2005; 331: 673-677.
- Battaglia J. Pharmacological management of acute agitation. Drugs. 2005; 65: 1207-1222.
- Lorazepam compound. 2017.
- ICH Guidelines, ICH Harmonised Tripartite Guideline Impurities in New Drug Products. 2006; Q3B (R2).
- Sreeram V, Basaveswararao MV, Nagendara kumar AVD, Sivanath M and Subhasani K. Validated RP-HPLC method for estimation of lorazepam in pharmaceutical formulation. J Pharm Sci Innov. 2012; 1: 5-8.
- Howard PJ, Lilburn JK, Dundee JW, Toner W and McIlroy PD. Estimation of plasma lorazepam by gas-liquid chromatography and a benzene extraction. Anaesthesia. 1977; 32: 767-770.
- Elaheh K, Amir HMSMS and Samaneh B. Quantitative Analysis of Lorazepam in Pharmaceutical Formulation through FTIR Spectroscopy. E-Journal of Chemistry. 2012; 9: 2232-2238.
- Ganna A, Darya A, Georgii M, Inna L and Alla Y. Luminescence method for the determination of Lorazepam in tablets. Acta Poloniae Pharmaceutica Drug Research. 2010; 67: 469-473.
- Kondo T, Buss DC and Routledge PA. A Method for Rapid Determination of Lorazepam by High Performance Liquid Chromatography. Therapeutic Drug Monitoring. 1993; 15: 35-38.
- Egan JM and Darrell R Abernethy. Lorazepam analysis using liquid chromatography: improved sensitivity for single-dose pharmacokinetic studies. Journal of Chromatography B: Biomedical Sciences and Applications. 1986; 380: 196-201.
- Muchohi SN, Obiero K, Kokwaro GO, Ogutu BR, Githiga IM, Edwards G, et al. Determination of lorazepam in plasma from children by high-performance liquid chromatography with UV detection. Journal of Chromatography B. 2005; 824: 333–340.
- Radulovic D, Ivanovic D and Vujic Z. HPLC determination of lorazepam and lorazepam-related compounds in pharmaceutical formulations. Chromatographia. 2000; 52: 732–734.
- Jerkovich AD, LoBrutto R and Vivelecchia RV. The use of Acquity UPLC in pharmaceutical development separation science redefined. LC-GC north Am. Suppl. 2005; 23: 15-21.
- Leandro CC, Hancock P, Fussel RJ and Keely BJ. Comparison of Ultra performance liquid chromatography and High performance liquid chromatography for determination of priority pesticides in baby foods by tandem quadruple mass spectrometry. J. Chromatogr A. 2006; 1103; 94-101.
- Jin H, Praveen Kumar A, Paik DH, Ha KC, Yoo YJ and Lee YI. Trace analysis of tetracycline antibiotics in human urine using UPLC-QToF mass spectrometry. Microchem J. 2010; 94: 139.
- International Conference on Harmonization. Photo stability testing of new drug substances and products Q1B, in International Conference on Harmonization, IFPMA, Geneva, Switzerland. 1996.
- Singh S and Bakshi M. Guidance on conduct of stress tests to determine inherent stability of drugs. pharmaceutical Technology Online. 2000; 1-24.