
Research Article
Austin J Anal Pharm Chem. 2018; 5(1): 1094.
Development and Validation of RP-HPLC Method for Simultaneous Estimation of Montelukast and Rupatadine in Pharmaceutical Dosage Form
Bangale G*, Ambhore J and Paikrao S
¹Department of Pharmaceutics, Government College of Pharmacy, Amravati, India
*Corresponding author: Ganesh S. Bangale, Government College of Pharmacy, Amravati, India
Received: December 30, 2017; Accepted: February 01, 2018; Published: February 08, 2018
Abstract
The aim of the present study was the development and validation of a simple, precise, and specific RP-HPLC method for assay of Montelukast (MNT) and Rupatadine (RPT) in tablet dosage forms. The separation was achieved on Grace C-18 Column (4.6 × 250mm, 5µm) using Acetonitrile and 0.05% OPA (60:40, v/v) as mobile phase for assay and flow rate 1ml/ min & detection was carried out in U.V detector at 242.0nm. The retention time of RPT and MNT were found to be 3.86min and 7.60min respectively. The linearity of the RPT and MNT was found over the range of 5-25µg/ml. The system suitability test shows the response with retention time, theoretical plate, tailing factor and peak area for both the drugs. The validation of method carried out using ICH guidelines. The developed method was gave good resolution for drugs. The developed RPHPLC method can be applied for routine quantitative and qualitative analysis of RPT and MNT in bulk and pharmaceutical formulations like tablets.
Keywords: Rupatadine; Montelukast; RP-HPLC; Validation; Actonitrile
Introduction
Rupatadine is a second generation antihistamine and PAF antagonist used to treat allergies. Rupatadine fumarate has been approved for the treatment of allergic rhinitis and chronic urticaria in adults and children over 12 years. The defined daily dose (DDD) is 10mg orally. It is soluble in methanol and ethanol slightly soluble in Chloroform and insoluble inwater. It is off white to pinkish crystalline powder. Montelukast is a leukotriene receptor antagonist (LTRA) used for the maintenance treatment of asthma and to relieve symptoms of seasonal allergies. Montelukast is a CysLT1 antagonist; it blocks the action of leukotriene D4 (and secondary ligands LTC4 and LTE4) on the cysteinyl leukotriene receptor CysLT1 in the lungs and bronchial tubes by binding to it. It is off white hygroscopic powder. It is freely soluble in ethanol, methanol and water [1,2]. The development of analytical method for the determination of drugs in bulk, in dosage forms or in body fluids has received attention in recent years because of their importance in quality control, bioavailability and pharmacokinetic study. Literature review reveals that few analytical methods were evoked for the estimation of rupatadine fumarate and montelukast sodium, the present work is an attempt to estimate the same in combination by different method such as RPHPLC method (Figure 1 and 2) [3,4].
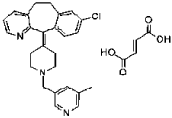
Figure 1: Structure of Rupatadine fumarate [3].

Figure 2: Structure of Montelukast Sodium [4].
Materials and Methods
Chemicals and reagent
Montelukast supplied as gift sample by Macleods Pvt. Ltd. Mumbai, India and its claimed purity was 99.3% and Rupatadine supplied as gift sample by Taj Pharmaceutical Limited Mumbai, India and have 99.5% purity. The RUPANEX M as a marketed formulation used which containing 10mg Rupatadine and 10mg Montelukast, manufactured by Dr. Reddys, India Pvt. Ltd. HPLC grade Methanol, Water, Acetonitrile, Ortho Phosphoric Acid was procured. Hydrochloric acid (35% GR), Hydrogen peroxide, Sodium hydroxide was procured from Merck, India
RP-HPLC method development and optimization
Instrumentation [4]: The HPLC analysis was performed using Younglin (S.K Gradient) equipped with UV 730D detector, column Grace C-18 (4.6 × 250 mm, 5µm) and the output signals were monitor and processed using data processor Autochro-3000. and UV Spectrophotometer (Shimadzu,Model-1700) was used. Ultrasonicator (RC-SYSTEMMU-17000) was used to sonicating the mobile phase and samples. Standard and sample drugs were weighed by using analytical balance model DS-852JSERIES. And pH of mobile phase was adjusted by using Digisun digital pH meter.
Chromatographic condition [5,6]: The separation was achieved on Younglin (S. K Gradient) System with Grace C18 (4.6 x 250mm, 5µm) column. The mobile phase consists of a mixture of Acetonitrile: 0.05% ortho phosphoric acid 60:40 v/v and the pH of mobile phase is adjusted to 2.5. The mobile phase was set at a flow rate of 1ml/ min.wavelength selected for the determination of RPT and MNT was 242.0nm.
Preparation of mobile phase: The mobile phase was prepared by mixing Acetonitrile (HPLC Grade) and 0.05% Orthophosphoric acid in the ratio of 60:40 v/v. pH was made up to the 2.5. Then resulting solution was filtered through 0.45µ.Filtered and degassed using sonicator.
Preparation of stock and working solution for RPT & MNT: An accurately weighed quantity of RPT working standard about 10.0 mg and MNT working standard about 10mg were transferred separately into 100.0 ml volumetric flask. About 10.0ml of methanol (HPLC Grade) was added to each of the volumetric flask and sonicated to dissolve the drug. The solution was cooled to the room temperature and made up to the mark with methanol (HPLC Grade) which gave the final concentrations of 1000µg/ml and 1000µg/ml for RPT and MNT respectively. Take 0.05ml from stock solution of RPT and 0.05ml from stock solution of MNT respectively in a 10.0ml volumetric flask and make up the volume up to the mark with mobile phase to get 5µg/ml RPT & 5µg/ml MNT.
Preparation of sample solution: Take the powder weight of tablet equivalent to 544mg in 50.0 ml of volumetric flask and add sufficient mobile phase and sonicate it for 15min. Make up the volume up to the mark with mobile phase and filtered it with 0.24µ to get 1000µg/ ml of RPT and MNT respectively. Take 0.05ml of RPT and 0.05ml of MNT from above solution of RPT and MNT respectively in a 10.0ml volumetric flask and make up the volume up to the mark with mobile phase to get 5µg/ml RPT & 5µg/ml MNT.
Validation of method
Linearity [7]: To establish the linearity of the analytical method, a series of dilutions with mobile phase were prepared in order to obtain the mixture of MNT & RPT ranging from 1-5µg/ml for MNT and 1-5µg/ for RPT. A constant volume of 20.0µL of each sample was injected and calibration curve was constructed by plotting the peak area versus the drug concentration.
System Suitability [7]: The system suitability parameter with respect to tailing factor, theoretical plates, relative standard deviation and resolution between MNT & RPT peaks was defined.
Accuracy [8]: Recovery studies were carried out by standard addition method by adding the known amount of MNT & RPT separately to the reanalyzed sample at three different concentration levels i.e. 80%, 100% and 120% of assay concentration and percent recoveries were calculated.
Precision [9]: The method precision was evaluated by preparing 6 samples (sample preparation) as per the test method representing a single batch were applied in triplicate and injected this sample preparation, but before diluent, placebo, and standard solution in six replicates injected in HPLC system. Determine the assay of these samples and evaluate the precision of the method by computing the % RSD of the assay results.
Robustness [10]: The Robustness of the method was evaluating the effect of small variation in the chromatographic conditions, such as changing the flow rate by ± 10%, and wavelength by ± 2nm, system suitability was done for each condition.
Ruggedness [11]: The ruggedness of the method was performed by analyzed the drug in the intra and inter day variation.
Result and Discussion
Determination of λ max (selection of wavelength)
Determination of λ max and selection of Analytical Wavelength: From the overlain spectra the two drugs RPT and MNT having the intersection at 242nm so for further studies wavelength selected is 242nm (Figure 3).
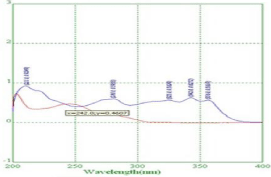
Figure 3: Determination of λ max.
Optimization of chromatographic condition
- The following chromatographic conditions were established by trial and error and were kept constant throughout the method.Trial -1 Acetonitrile : KH2PO4 (60:40%, v/v).
- Trial -2 Acetonitrile: KH2PO4 (70:30%, v/v).
- Trial -3 Acetonitrile: 0.05%OPA (90:10%, v/v).
- Trial -4 Acetonitrile: water (90:10%, v/v).
- Trial -5 Acetonitrile: 0.05% OPA (60:40%, v/v).
Figure 4 shows resolution of peaks were poor, in this chromatogram many noisy peaks were observed hence this method was not suitable. Similarly chromatogram obtained using Acetonitrile: KH2PO4 (70:30%, v/v) separation of peaks were not proper, the two peaks of drugs were not identified so this method was not suitable (Figure 5).
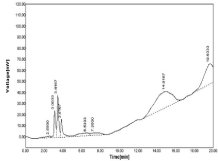
Figure 4: Chromatogram of using Acetonitrile: KH2PO4 (60:40%, v/v).
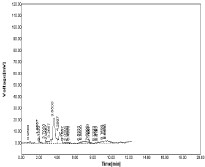
Figure 5: Chromatogram of using Acetonitrile: KH2PO4 (70:30%, v/v).
By using Acetonitrile: 0.05% OPA (90:10%, v/v), RPT & MNT were separated with good peaks, minimum tailing having retention time 5.66 for RPT and 11.11 for MNT (Figure 6) but resolution between peaks were not sufficient. Hence this method was not suitable.
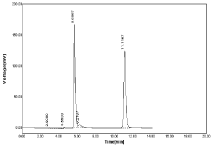
Figure 6: Chromatogram using Acetonitrile: 0.05%OPA (90:10%, v/v).
Good resolution with minimized tailing also proper peak shape and system suitability was observed within the limits. Retention time for RPT was 3.86 and retention time for MNT was 7.50 hence the above chromatographic parameters were finalized (Figure 7,8).
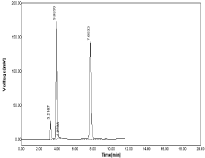
Figure 7: Chromatogram of using Acetonitrile: water (90:10%, v/v).

    Figure 8: Chromatogram of RPT and MNT using Acetonitrile: 0.05%OPA
(60:40%, v/v).
Estimation of Rupatadine and Montelukast from marketed formulation [12]
After establishing the chromatographic conditions, Mix standard and marketed preparation were prepared and analyzed by following procedure described under experimental work. It gave accurate, reliable results and was extended for estimation of drugs in marketed tablet formulation.
Formula for determination of drug concentration and % Label claim as shown below
Math Pending
whereas,
At: Area count for sample solution; As: Area count for standard solution; Ds: Dilution factor for standard;
Dt: Dilution factor for sample; Lc: Label claim; A: Average weight.
Amount of drugs was calculated using formula
Math Pending
EW: Drug estimated in sample weight, mg; CS: Concentration of standard, µg/ml; Au: Area of unknown; As: Area of standard; D: Dilution factor.
The estimation of drug from marketed formulation were carried out by using 20µg/ml concentration of both drug and amount of drug recovered as 19.44 µg/ml for RPT with % label claim as 97.51 & 19.94µg/ml for MNT with % label claim as 99.70 respectively (Figure 9,10).
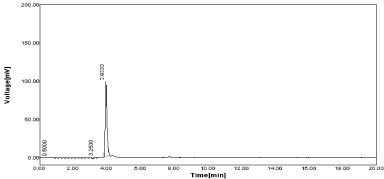
Figure 9: Standard Chromatogram of RPT and MNT.
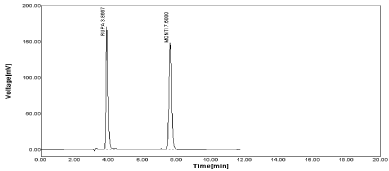
Figure 10: Sample chromatogram of RPT and MNT.
The proposed method was applied to the determination of RPT & MNT in marketed formulation. The mean % amount found was 99.84 (RPT) & 99.71 (MNT) with %RSD values was NMT 2.0% indicates the developed method was successfully applied for analysis of marketed formulation. All the results found were in good agreement with the label content of marketed formulation (Table 1-3).
    Conc. (μg/ml)
    Area
    Amount found
    % Label claim


    20
    166. 73
    19.35
    96.78


    20
    185.38
    19.64
    98.24


    Mean
    1176.06
    19.44
    97.51


    SD
    13.19
    0.21
    0.35


    % RSD
    1.12
    0.83
    0.37
Table 1: Results for estimation of RPT in marketed formulation.
    Conc. (μg/ml)
    Area
    Amount found
    % Label claim


    20
    1353.84
    19.92
    99.6


    20
    1356.6
    19.96
    99.8


    Mean
    1355.22
    19.94
    99.7


    SD
    1.95
    0.03
    0.64


    % RSD
    0.14
    0.14
    0.61
Table 2: Statistical data for estimation of RPT and MNT in marketed Formulation.
    Sr. No.
    RPT
    MNT


    Assay (mg)
    Assay (%)
    Assay (mg)
    Assay (%)


    1
    120.85
    99.83
    4.47
    99.69


    2
    119.24
    99.83
    4.49
    99.7


    3
    119.02
    99.8
    4.46
    99.71


    Mean
    119.7
    99.84
    4.47
    99.71


    SD
    0.1138
    0.024119
    0.351
    0.0452


    % RSD
    0.061
    0.648763
    0.35
    0.417598
Table 3: Statistical data for estimation of RPT and MNT in marketed Formulation.
Method validation
The method was validated for the parameters Accuracy, Precision, LOD & LOQ, Linearity, Standard Deviation, Specificity, Ruggedness, and Robustness.
Accuracy: The accuracy of the method was determined by recovery experiment using the standard addition method by adding the known amount of RPT and MNT separately to the reanalyzed sample at three different concentration levels i.e. 80%, 100% and 120% of assay concentration and percent recoveries were reported in Table 4.
    Level of % Recovery
    Amount of Std. Drug Added (μg/m    l)
    Total Amount Recovered (μg/ml)
    %Recovery


    RPT
    MNT
    RPT
    MNT
    RPT
    MNT


    80%
    8
    8
    8.09
    7.67
    101.5
    98.19


    8
    8
    7.87
    9.75
    99.31
    98.65


    100%
    10
    10
    9.52
    10.15
    98.21
    101.5


    10
    10
    9.67
    10300
    99.72
    101


    120%
    12
    12
    12.18
    11.75
    101.5
    98.96


    12
    12
    12.01
    11.91
    100.9
    99.26
Table 4: Results of Accuracy.
For the level of 80% the mean of RPT recovered as 100.23% with RSD as 1.30% for 100% the mean RPT was recovered as 95.97 with RSD as 1.11 & for 120% total amount of RPT was found to be 101.26 with RSD value less than 2% indicate method was to be accurate for analysis. Similarly % recovery for MNT was found to be 98.42% to 102.33% with RSD values less than 2% respectively (Table 5).
    Level of %
      Recovery
    RPT
    MNT


    Mean
    SD
    % RSD
    Mean
    SD
    % RSD


    80%
    100.23
    1.3
    1.3
    98.42
    0.33
    0.33


    100%
    95.97
    1.07
    1.11
    102.33
    1.08
    1.06


    120%
    101.26
    0.42
    0.41
    98.61
    0.92
    0.93
Table 5: Statistical Validation Data for Accuracy.
Precision: It is a measure of degree of repeatability of an analytical method under normal operation and it is normally expressed as % of relative standard deviation (%RSD). The standard solution was injected for six times and measured area for all six replicates in HPLC system. The %RSD for the area of six replicate injections was found to be within the specified limits as shown in Table 6.
    Sr.No.
    RPT
    MNT


    Peak Area
    % Assay
    Peak Area
    % Assay


    1
    550.4
    98.39
    621.32
    98.1


    2
    899.65
    101.57
    981.63
    97.74


    3
    1159.85
    97.47
    1369.13
    100.73


    4
    552.2
    98.59
    631.32
    98.94


    5
    909.11
    101.89
    992.3
    99.46


    6
    1169.85
    97.47
    1364.46
    100.5


    Mean
    99.23
    Mean
    99.24


    SD
    1.96
    SD
    1.22


    %RSD
    1.97
    %RSD
    1.22
Table 6: Results of precision study.
The mean% recovered as 99.23% for RPT while as 99.24% was recovered as MNT which means that developed method is highly precise for analysis of above drugs.
Linearity: The linearity of an analytical procedure is its ability (within a given range) to obtain test results, which are directly proportional to the concentration of analyte in the sample. Linearity was carried out for five levels. A graph was plotted with concentration on X axis and mean peak areas on Y axis. The r2 value was found to be 0.999 for rupatadine and montelukast r2 value should be 0.999. The result show that excellent correlation exists between concentration and mean peak areas within concentration range. From the studies carried out and result obtained the proposed method compared in terms of statistical data. The data were representing in Table 7 and the linearity curve was represented in Figure 11,12.
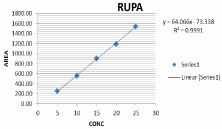
Figure 11: Linearity graph of RPT.
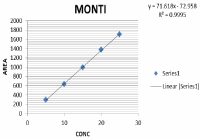
Figure 12: Linearity graph of MNT.
    Sr. No.
    Conc.    (µg/ml)
    Peak Area


    RPT
    MNT
    RPT
    MNT


    1
    5
    5
    250.42
    292.39


    2
    10
    10
    558.99
    631.07


    3
    15
    15
    904.09
    996.16


    4
    20
    20
    1186.35
    1377.17


    5
    25
    25
    1538.38
    1709.8


    Slope
    64.006
    71.618


    Intercept
    73.338
    72.958


    (r2)
    0.9991
    0.9995
Table 7: Result of Linearity study.
The linearity chromatogram was constructed with different concentration of RPT & MNT (5 to 25 µg/ml) are shown in Figure 13-17 & identical with standard supported by r2 & retention time (Rt), % RSD value obtained from linearity study. Hence developed method of RP-HPLC for RPT & MNT is highly linear with respect to concentration vs. peak area obtained in chromatogram (Table 8,9).
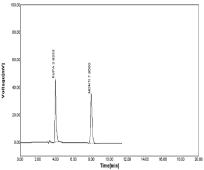
Figure 13: Linearity chromatogram in ratio of 5μg/ml RPT and 5μg/ml MNT.
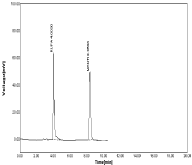
    Figure 14: Linearity chromatogram in ratio of 10μg/ml RPT and 10μg/ml
MNT.
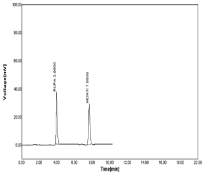
    Figure 15: Linearity chromatogram in ratio of 15μg/ml RPT and 15μg/ml
MNT.
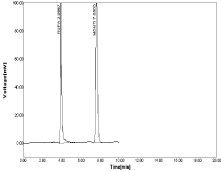
Figure 16: RPT and MNT in ratio of 20μg/ml RPT and 20μg/ml MNT.
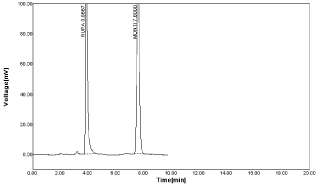
Figure 17: RPT and MNT in ratio of 25μg/ml RPT and 25μg/ml MNT.
    Sr. no
    Conc.    (μg/ml)
    Mean Peak Area
    SD
    %RSD


    1
    5
    250.42
    2.22
    0.76


    2
    10
    558.99
    2.3
    0.36


    3
    15
    904.09
    1.92
    0.19


    4
    20
    1186.35
    17.85
    1.3


    5
    25
    1538.38
    13.87
    0.81
Table 8: Results of Linearity study of Rupatadine.
    Sr.no
    Conc.    (μg/ml)
    Mean Peak Area
    SD
    %RSD


    1
    5
    292.39
    0.78
    0.31


    2
    10
    631.07
    1.12
    0.2


    3
    15
    996.16
    5.43
    0.6


    4
    20
    1377.17
    0.15
    0.01


    5
    25
    1709.8
    13.48
    0.88
Table 9: Results of Linearity study of Montelukast.
System suitability: System suitability tests are an integral part of Method development and are used to verify whether the resolution and reproducibility of the chromatographic system are adequate for analysis. Retention time (Rt), Theoretical plate (N), Tailing factor (T), Capacity factor were evaluated for five replicates for standard drug solution & result was expressed in Table 10.
    Parameters
    RPT
    MNT


    Retention time
    3.86 min
    7.60 min


    Theoretical plate
    6283.7
    12113.1


    Tailing factor
    1.4
    1.2


    Capacity factor
    0.64
    4.31
Table 10: System suitability RPT and MNT.
Ruggedness: When the drugs RPT and MNT were analyzed by proposed method in different conditions like inter-day (during two days) intra-day (in single day at different time) and different analyst using similar operational procedure but by different analyst Peak area was measured for same concentration solutions. The % amount of drugs was found with %RSD (NMT than 2%) which was in agreement with system suitability. Therefore, the proposed HPLC method for the determination of RPT and MNT in a tablet was found to be sufficiently rugged (Table 11,12).
    Sr. No
    Observations
    % Drug estimation


    Intra-day
    Inter-day
    Different    Analyst


    1
    I
    98.1
    98.94
    98.876


    2
    II
    97.74
    99.46
    99.624


    3
    III
    100.73
    100.5
    99.922


    Mean
    976.96
    995.46
    99.472


    ±S.D.
    6.6
    4.48
    0.474


    %R.S.D.
    0.68
    0.45
    0.476
Table 11: Results of ruggedness study for MNT.
    Sr. No
    Observation
    % Drug estimation


    Intra-day
    Inter-day
    Different    Analyst


    1
    I
    98.39
    98.59
    98.932


    2
    II
    101.57
    101.89
    99.53


    3
    III
    97.47
    97.4
    99.676


    Mean
    902.68
    905.82
    99.573


    ±S.D.
    4.29
    4.65
    0.493


    %R.S.D.
    0.47
    0.51
    0.495
Table 12: Results of ruggedness study for RPT.
Robustness: The robustness of assay method was studied by incorporating small but deliberate changes in analytical method as,
1. Effect of variation in flow rate (±1) : If injection volume changed as 0.9ml for RPT using RP-HPLC method resulting peak area for RPT as 493.11 & %RSD value as 0.72 & 461.89 and %RSD as 0.44 for MNT as within acceptable limit (Table 13, Figure 18).
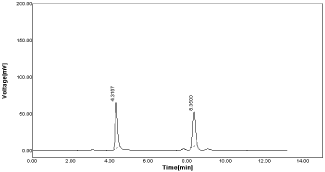
Figure 18: Chromatogram of RPT & MNT at flow rate 0.9ml.
    Flow rate 0.9ml


    Conc.    (µg/ml)
    Area    for (RPT)
    Area    for (MNT)


    10
    490.6
    460.46


    10
    495.62
    463.32


    Mean
    493.11
    461.89


    ±SD
    3.55
    2.02


    % RSD
    0.72
    0.44
Table 13: Result of Robustness study at flow rate 0.9ml.
If flow rate changed as 1.1ml for both drugs mean peak area for RPT was found to be 605.72 & %RSD as 1.08 and 644.01 with % RSD as 1.24 for MNT as satisfactory (Table 14, Figure 19).
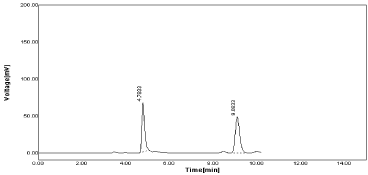
Figure 19: Chromatogram of RPT & MNT at flow rate 1.1ml.
    Flow rate 1.1ml


    Conc.    (µg/ml)
    Area    for (RPT)
    Area    for (MNT)


    10
    601.08
    677.98


    10
    610.36
    610.03


    Mean
    605.72
    644.01


    ±SD
    6.56
    8.05


    % RSD
    1.08
    1.24
Table 14: Result of Robustness study at flow rate 1.1ml.
The % RSD was not more than 2% for both (RPT & MNT) which was in agreement with system suitability. Hence the proposed HPLC method for the determination of RPT and MNT in a tablet was found to be robust.
2. Change in wave length (±1): When analysis was carried out by changing wavelength for measurement as 241nm mean peak area as 452.90 & %RSD as 0.78 was obtained for RPT and 548.69 & %RSD 0.93 for MNT was obtained (Table 15, Figure 20).

Figure 20: Chromatogram of RPT & MNT at wavelength 241nm.
    Wavelength 241nm


    Conc.    (µg/ml)
    Area    for (RPT)
    Area    for (MNT)


    10
    450.41
    545.07


    10
    455.39
    552.3


    Mean
    452.9
    548.69


    ±SD
    3.52
    5.11


    % RSD
    0.78
    0.93
Table 15: Result of Robustness study at wavelength 214nm.
It was observed that there is no effect on retention time, peak area of both drug if they are measured at 243nm the mean peak area for RPT was 535.69 & %RSD value as 1.19 & 511.49 along with %RSD as 1.77 for MNT indicate that change in wavelength slight changes in peak area of both drug supported by %RSD less than 2%. Hence above method was validated as per robustness parameters (Table 16, Figure 21).

Figure 21: Chromatogram of RPT & MNT at wavelength 243nm.
    Wavelength 243nm


    Conc.    (µg/ml)
    Area    for (RPT)
    Area    for (MNT)


    10
    531.17
    505.1


    10
    540.2
    517.87


    Mean
    535.69
    511.49


    ±SD
    6.39
    9.03


    % RSD
    1.19
    1.77
Table 16: Result of Robustness study at wavelength 243nm.
3. Change in Mobile phase ratio (±1): When Mobile phase compositions consider as Acetonitrile: 0.05% OPA (61:39% V/V) and resulting chromatogram obtained from this study shown in Figure 22 The %RSD value for both RPT & MNT as 1.13 and 0.92 respectively (Table 17).
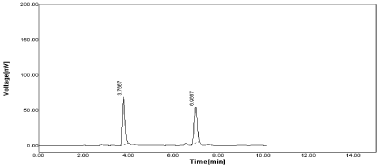
    Figure 22: Chromatogram of RPT & MNT at Acetonitrile: 0.05%OPA
(61:39%, v/v).
    Conc. (µg/ml)
    Area    for (RPT)
    Area for (MNT)


    10
    490.66
    497.44


    10
    498.54
    485.69


    Mean
    494.6
    482.57


    ±SD
    5.57
    4.42


    % RSD
    1.13
    0.92
Table 17: Result of Robustness study at Acetonitrile: 0.05% OPA (61:39%, v/v).
If mobile phase composition as 59:41 v/v for Acetonitrile: 0.05% OPA were selected for study Peak area, SD & %RSD value obtained reported in Table 18 was acceptable.
    Conc. (µg/ml)
    Area    for (RPT)
    Area for (MNT)


    10
    557.65
    530.11


    10
    550.27
    542.31


    Mean
    553.96
    536.21


    ±SD
    5.22
    8.63


    % RSD
    0.94
    1.61
Table 18: Result of Robustness study at Acetonitrile: 0.05% OPA (59:41%, v/v).
From the above study was concludes that change in wavelength (±1) does not affect on retention time of both RPT & MNT (Figure 23).
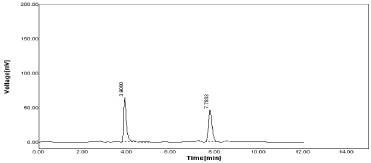
    Figure 23: Chromatogram of RPT & MNT at Acetonitrile: 0.05%OPA
(59:41%, v/v).
Summary of validation parameters: The validation parameters applied for study RPT & MNT from marketed formulation & resulting parameters along with %RSD values was found within limit prescribed by standard (Table 19).
    Parameters
    RPT
    MNT


    Linearity    (range)
      Y= mx    + C
    5-25 µg/ml
      Y = 64.066 X -73.338
    5-25 µg/ml
      Y= 71.618 X -72.958


    Correlation    coefficient
    0.9991
    0.9995


    %    Recovery
    99.84
    99.71


    Precision    (% RSD)
    1.97
    1.22


    Accuracy    (% RSD)


    For    80%
    0.33
    1.3


    For    100%
    1.06
    1.11


    For    120%
    0.93
    0.42


    Ruggedness    (% RSD)


    Intra-Day
    1.47
    0.68


    Inter-Day
    0.51
    0.45


    Repeatability
    0.79
    0.97


    Robustness    (%RSD)


    Flow    change 0.9ml
    0.72
    0.44


    Flow    change 1.1ml
    1.08
    1.24


    Composition    change 61:39
    1.13
    0.94


    Composition    change 59:41
    0.92
    1.61


    Wavelength    change 241nm
    0.78
    0.93


    Wavelength change 243nm
    1.19
    1.77
Table 19: Summary of Validation parameters for RPT & MNT.
Conclusion
The developed RP-HPLC method was found to be linear over wider concentration range. Therefore the developed RP-HPLC method can be applied for routine quantitative and qualitative analysis of RPT and MNT in bulk and pharmaceutical formulations like tablets. The developed RP-HPLC method was validated as per the ICH guidelines.
References
- Nidhi NK, Neelam I, Ajitha A, Uma Maheswara Rao. Analytical Method Development And Validation Of Simultaneous Estimation Of Rupatadine Fumarate And Montelukast Sodium By RP-HPLC. IJPRA. 2014; 4: 393-399.
- Choudekar Rupali L, Mahajan Moreshwar P, Sawant Sanjay D. Spectrophotometric estimation of rupatadine fumarate and montelukast sodium in bulk and tablet dosage form. Int J Pharm Pharm Sci. 2012; 4: 73- 77.
- Patel Nilam K, Patel Shirish, Pancholi S. HPLC Method Development And Validation For Simultaneous Estimation Of Montelukast Sodium And Levocetirizine Dihydrochloride In Pharmaceutical Dosage Forms. International Journal of Pharmacy and Pharmaceutical Sciences. 2012; 4: 242-246.
- Tanneru Raja, A Lakshmana Rao, MVL Ramanakanth, D Ramya and S Padmaja. Development and Validation of a Reversed-Phase HPLC Method for Simultaneous Estimation of Rupatadine Fumarate and Montelukast Sodium from Their Combined Dosage Forms. Eurasian Journal of Analytical Chemistry. 2014; l9: 49-57.
- Arindam Basu, Krishnendu Basak, Mithun Chakraborty, Inder Singh Rawat. “Simultaneous RP-HPLC Estimation of Levocetirizine Hydrochloride and Montelukast Sodium in Tablet Dosage Form”. International Journal of Pharm Tech Research. 2011; 3: 405-410.
- Sushma Somkuwar, AK Pathak. “Simultaneous Estimation Of Levocetirizine Dihydrochloride and Montelukast Sodium by RP-HPLC Method”. Pharmacia. 2013; 1: 91-94.
- ICH. Q2(R1). Harmonized Tripartite Guideline, Test on Validation of Analytical Procedures: Text and methodology, in: Proceedings of the International Conference on Harmonization, Geneva. October, 1994.
- ICH. Q2B. Guidelines for Pharmaceutical Industry, Text on Validation of Analytical Procedures: Methodology, Geneva. November, 1996.
- ICH. Q2A. Guidelines for Pharmaceutical Industry, Text on Validation of Analytical Procedures, Geneva. March, 1995.
- ICH, Harmonized Tripartite Guideline. Validation of Analytical Procedures: text and methodology Q2 (R1); 2005; 1-16.
- NS Dighe, AS Balsane, RB Lawre, SS Dengale and DS Musmade. Method development and validation of Rupatadine fumarate and Montelukast sodium by RP- HPLC”. International Journal of Pharmaceutical Chemistry. 2015; 5: 58-65.
- Singh RM, Saini PK, Mathur SC, Singh GN. Development and Validation of a RP-HPLC Method for Estimation of Montelukast Sodium in Bulk and in Tablet Dosage Form. Indian J. Pharm. Sci. 2010; 72: 235-237.