
Research Article
Austin J Anal Pharm Chem. 2018; 5(1): 1095.
Development of Stability Indicating Assay Method for Estimation of Nebivolol and Hydrochlorothiazide in Tablet Dosage Form
Ambhore J*, Bangale G and Chandak M
¹Department of Quality assurance, Government College of Pharmacy, Amravati, India
*Corresponding author: Jaya Ambhore, Department of Quality Assurance, Government College of Pharmacy, Amravati-444601, India
Received: December 30, 2017; Accepted: February 01, 2018; Published: February 09, 2018
Abstract
A stability indicating HPLC method was developed and validated for analysis of Nebivolol (NBV) and Hydrochlorothiazide (HCZ) in combination from tablet dosage forms and estimation of principal degradation products. The separation was achieved by using C-18 Primesil (4.6 × 250mm,5µm particle size) column as a stationary phase with mobile phase consisting which Methanol and 0.05% Ortho phosphoric acid (60:40v/v) pH 2.5. The flow rate 0.7ml/min and optimum wavelength for detection was 281.0nm. The developed method was validated for Accuracy, Precision, Ruggedness, Robustness, Linearity and Range. The chromatographic analysis time was approximately 10min with complete resolution n of NBV (Rt =4.60min) and HCZ (Rt = 9.00min) .The developed method exhibited good linearity range of 5.0 to 16.0 mg/ml for NBV and 25.0 to 80.0 mg/ml for HCZ. The forced degradation studies were performed as per ICH guidelines under acidic, alkali, oxidative, thermal and neutral condition. The developed RP-HPLC method was found to be linear over wider concentration range. Therefore the developed RP-HPLC method can be applied for routine quantitative and qualitative analysis of NBV and HCZ in bulk and pharmaceutical formulations like tablets and validated as per the ICH guidelines. Hence the proposed method could be employed for the stability studies on pharmaceutical preparations within pharmaceutical industry.
Keywords: RP-HPLC; Nebivolol; Hydrochlorothiazide; Forced degradation
Introduction
Nebivolol (NBV) is chemically 1-(6-Fluorochroman-2-yl)-{[2- (6-fluorochroman-2-yl)-2-hydroxy-ethyl] amino} ethanol. Nebivolol is a ß1 receptor blocker with nitric oxide-potentiating vasodilator effect used in treatment of hypertension. It undergoes first pass metabolism through the cytochrome P-450 2 D 6. Nebivolol is white to off white powder and slightly soluble in methanol, soluble in water [1,2] (Figure 1).

Figure 1: Chemical structure of Nebivolol.
Hydrochlorothiazide (HCZ) is chemically 6-chloro-1,1- dioxo-3,4-dihydro-2H-1,2,4-benzothiadiazine-7-Sulfonamide. Hydrochlorothiazide is a diuretic medication often used to treat high blood pressure and swelling due to fluid buildup. It is does not undergo significant metabolism (>95% excreted unchanged in urine). Hydrochlorothiazide is White and Practically White Crystalline powder and slightly soluble in water and soluble in alcohol [1,2,5] (Figure 2).

Figure 2: Chemical structure of Hydrochlorothiazide.
As per our detailed literature review it has been found that only three analytical methods for the Nebivolol and Hydrochlorothiazide combination have been reported. No stability indicating assay has been reported. Therefore the attempt is made to develop simple, accurate, precise rapid and economical RP-HPLC method for determination of NBV and HCZ in combine dosage form. Further generation of degradation profile both on RP-HPLC through stress testing.
Material and Method
Chemical and reagents
Nibevolol supplied as gift sample by Macleods Pvt. Ltd. Mumbai, India and its claimed purity was 99.3% and hydrochlorothiazide supplied by Leben Pvt. Ltd. Akola, India and has 99.5% purity. The formulation tablet NEBICARD –H was purchased from local pharmacy, manufactured by Torrent Pharmacetuicals. Ltd, Sikkim. HPLC grade Methanol, Water, Acetonitrile, Ortho Phosphoric Acid was purchased. Hydrochloric acid (35% GR), hydrogen peroxide, Sodium hydroxide were purchased from Merck, India.
Instrumentation [5,6]
The chromatographic separation was performed using HPLC Younglin (S.K Gradient) system with UV 730D as a detector. UV Spectrophotometer (UV1700 (SHIMADZU) were used and data handling system Auto chrome -3000. The sample and standard measure by using analytical balance model DS-852J Series. pH of mobile phase was adjusted by using model 7007 pH meter. Ultrasonicator RC-SYSTEMMU-1700 were used to sonicating the mobile phase and sample.
Chromatographic conditions
Separation of Nebivolol and Hydrochlorothiazide was achieved on HPLC column Grace C-18 (4.6 × 250mm, having particle size 5µm). The mobile phase consists of a mixture of Methanol and 0.05% ortho phosphoric acid (60:40 v/v) with pH 2.5. The mobile phase was set at a flow rate 0.7ml/min and volume injected was for every injection. The detection wavelength was set at 282nm.
Preparation of mobile phase
The mobile phase was prepared by using a mixture of Methanol (HPLC Grade) and orthophosphoric acid (HPLC Grade) in the ratio of 60:40, v/v and pH was made up to the 2.5 Then resulting solution was filtered through 0.45µ and degassed using sonicator.
Preparation of stock solution: The stock solution was prepared by accurately weighing quantity of NBV working standard about 10.0mg and HCZ working standard about 25mg were transferred separately into 100.0ml volumetric flask. About 10.0ml of methanol was added to each of the volumetric flask and sonicated to dissolve the drug. The solution was cooled to the room temperature and made up to the mark with methanol which gave the final concentrations of 1000µg/ml and 1000µg/ml for NBV and HCZ respectively.
Preparation of working standard solution: For the preparation of working standard solution, take 0.1ml from stock solution of NBV and 0.1ml from stock solution of HCZ respectively in a 10.0ml volumetric flask and make up the volume up to the mark with mobile phase to get 10µg/ml NBV & 25µg/ml HCZ.
Preparation of sample solution: The sample solution was prepared by taking the powder weight of tablet equivalent to 400mg in 10.0ml of volumetric flask and add sufficient mobile phase and sonicate it for 15min. Make up the volume up to the mark with mobile phase and filtered it with 0.24µ to get 1000µg/ml of NBV and HCZ respectively. Take 0.1ml of NBV and 0.1ml of HCZ from above solution of NBV and HCZ respectively in a 10.0ml volumetric flask and make up the volume up to the mark with mobile phase to get 10µg/ml NBV & 25µg/ml HCZ.
Method validation [1,2,5]
The developed method for simultaneous estimation of Nebivolol and Hydrochlorothiazide has been validated in accordance with the International conference on Harmonization guidelines.
Linearity: To establish the linearity of the analytical method, a series of dilutions with mobile phase were prepared in order to obtain the mixture of Nebivolol and Hydrochlorothiazide ranging from 1-5µg/ml for NBV and 1-5µg/ for HCZ. A constant volume of 20.0µL of each sample was injected and calibration curve was constructed by plotting the peak area versus the drug concentration.
System suitability: The system suitability parameter with respect to tailing factor, theoretical plates, relative standard deviation and resolution between NBV and HCZ peaks was defined.
Accuracy: Recovery studies were carried out by standard addition method by adding the known amount of NBV and HCZ separately to the reanalyzed sample at three different concentration levels i.e. 80%, 100% and 120% of assay concentration and percent recoveries were calculated.
Precision: The method precision was evaluated by preparing 6 samples (sample preparation) as per the test method representing a single batch were applied in triplicate and injected this sample preparation, but before diluent, placebo, and standard solution in six replicates injected in HPLC system. Determine the assay of these samples and evaluate the precision of the method by computing the %RSD of the assay results.
Robustness: The Robustness of the method was evaluating the effect of small variation in the chromatographic conditions, such as changing the flow rate by ± 10%, and wavelength by ± 2nm, system suitability was done for each condition.
Ruggedness: The ruggedness of the method was performed by analyzed the drug in the intra and inter day variation.
Force degradation study [1,2,5-8]
Force degradation study or stress testing of the drug substance will help to identify the degradation products, which can help to establish the intrinsic stability of the molecules. In order to establish the force degradation profile and to determine whether the analytical method for assay was stability indicating, the tablet formulation of NBV and HCZ were subjected to various stress conditions to conduct forced degradation studies. Stress studies were carried out under the condition of acid/alkali hydrolysis, oxidation, neutral and thermal degradation in accordance with ICH Q1A (R2) guideline.
Acid degradation: In this study tablets were crushed to fine powder and powder equivalent to 10mg of NBV and 25mg of HCZ was taken into 10ml volumetric flask to which 5ml mobile phase (Methanol and 0.05% Ortho phosphoric acid (60:40v/v)) and 1 N HCL was added to the flask up to the mark and refluxed on heating mantle for 60min at 60°C.
Basic degradation: In this study fine powder of tablet was taken and powder equivalent to 10mg of NBV and 25mg of HCZ was taken into 10ml volumetric flask to which 5ml mobile phase.
( Methanol and 0.05% Ortho phosphoric acid (60:40v/v)) and 1 N NaOH was added to the flask up to the mark and refluxed on heating mantle for 60min at 60°C.
Oxidative/Peroxide degradation: In this study fine powder of tablet equivalent to 10mg of NBV and 25mg of HCZ was taken into 10ml volumetric flask to which 5ml mobile phase (Methanol and 0.05% ortho phosphoric acid (60:40v/v)) and 3% H2O2 was added to the flask up to the mark and refluxed on heating mantle for 60min at 60°C.k.
Neutral degradation: Neutral degradation in which tablets were crushed to fine powder and powder equivalent to 10mg of NBV and 25mg of HCZ was taken into 10ml volumetric flask to which 5ml mobile phase (Methanol and 0.05% Ortho phosphoric acid (60:40v/v)) and water was added to the flask up to the mark and refluxed on heating mantle for 60min at 60°C.
Results and Discussion
Determination of λ max and selection of analytical wavelength
From the overlain spectra 281nm were selected for estimation of drugs using Simultaneous Equation Method (SEM) (Figure 3).
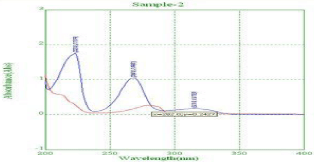
Figure 3: Overlay Spectra of NBV and HCZ.
Optimization of mobile phase and chromatographic condition
For the RP-HPLC method development mobile phase was selected on the bases of trial and error method and some trials are reported as followed. The following chromatographic conditions were established.
Mobile phases were tried as follows:
- Trial -1 MEOH: WATER (80:20%, v/v), pH 2.5 at 281nm.
- Trial - 3 MEOH: WATER (70:30%, v/v), pH 2.5 at 281nm.
- Trial -4 MEOH: WATER (60:40%, v/v), pH 2.5 at 281nm.
- Trial -6 MEOH: 0.05%OPA (60:40%, v/v), pH 2.5 at 281nm.
The optimized method the mobile phase consist a mixture of methanol and 0.05% ortho phosphoric acid (60:40v/v) with pH 2.5. Retention time (Rt) is 4.700 for hydrochlorothiazide and 6.966 for Nebivolol. Hence the above chromatographic parameters are finalized. The theoretical plates and good resolution for NBV and HCZ at the flow rate of 0.7ml/Min (Figure 4-7).
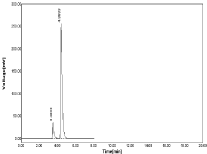
Figure 4: Chromatogram using MEOH: WATER (80:20%, v/v).
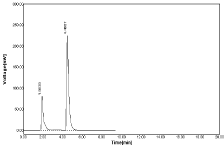
Figure 5: Chromatogram using MEOH: WATER (70:30%, v/v).
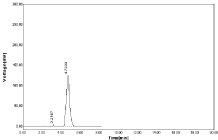
Figure 6: Chromatogram using MEOH: WATER (60:40%, v/v).
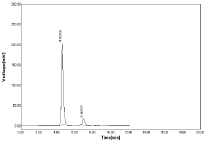
Figure 7: Chromatogram using MEOH: 0.05%OPA (60:40%, v/v).
Estimation of NBV & HCZ from marketed formulation
The final concentration (sample & standard) after dilution of stock solution of NBV as 10-50µg/ml & 25-125µg/ml for HCZ was mixed with optimized concentration of mobile phase injected separately & measured at 281nm.
The peak area of the drug concentration was calculated. The regression of the drug concentration over the peak areas was obtained. This regression equation was used to estimate the amount of drugs in marketed formulation (Table 1-4, Figure 8-9).
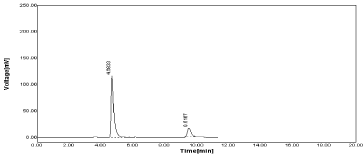
Figure 8: Standard Chromatogram of NBV and HCZ.
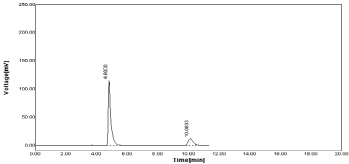
Figure 9: Sample chromatogram of NBV and HCZ.
    Sr. no.
    Concentration in µg/ml
    Peak Area


    NBV
    HCZ
    NBV
    HCZ


    1
    10
    25
    120.99
    434.98


    2
    20
    50
    212.15
    895.77


    3
    30
    75
    305.28
    1398.19


    4
    40
    100
    385.25
    1893.19


    5
    50
    125
    475.85
    2314.48


    Slope
    8.8282
    19.026


    Intercept
    35.058
    39.542


    Correlation Coefficient (r2)
    0.9994
    0.9992
Table 1: Standard Calibration curves of NBV and HCZ.
    Conc.
    Area
    Amount found
    % Label claim


    20
    215.3
    20.41
    102.05


    Mean
    214.33
    20.73
    11.5


    SD
    1.38
    0.16
    0.64


    % RSD
    0.64
    0.75
    0.61
Table 2: Results for estimation of NBV in marketed formulation.
    Conc.
    Area
    Amount found
    % Label claim


    50
    899.44
    49.36
    98.72


    Mean
    902.4
    24.85
    99.04


    SD
    4.19
    0.22
    0.35


    % RSD
    0.46
    0.88
    0.37
Table 3: Results for estimation of HCZ in marketed formulation.
    Sr. no.
    NBV
    HCZ


    Assay    (mg)
    Assay    (%)
    Assay    (mg)
    Assay    (%)


    1
    120.85
    99.83
    4.47
    99.91


    2
    119.24
    99.83
    4.49
    99.92


    3
    119.02
    99.8
    4.46
    99.91


    Mean
    119.7
    99.82
    4.47
    99.91


    SD
    0.11
    0.024
    0.35
    0.045


    % RSD
    0.061
    0.64
    0.35
    0.41
Table 4: Assay of NBV & HCZ.
The proposed method was applied to the determination of NBV & HCZ in marketed formulation. The mean % amount found was 99.82 NBV & 99.91 HCZ with %RSD values was NMT 2.0% indicates the developed method was successfully applied for analysis of marketed formulation. All the results found were in good agreement with the label content of marketed formulation.
Validation of developed method
Linearity: The linearity five levels of concentrations with correlation regression curves are obtained the conc. range of 10-50µg/ ml for NBV and 25-125µg/ for HCZ. A straight line was obtained. The regression coefficient (r2) was 0.999 for both NBV & HCZ & RSD less than 2% indicate the linearity between concentration vs peak area (Table 5, Figure 10-16).
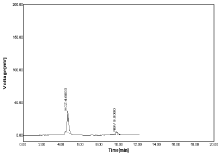
Figure 10: Linearity chromatogram ratio of 10µg/ml NBV and 25µg/ml HCZ.
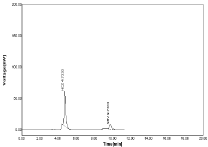
Figure 11: Linearity chromatogram ratio of 20µg/ml NBV and 50µg/ml HCZ.
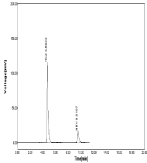
Figure 12: Linearity chromatogram ratio of 30µg/ml NBV and 75µg/ml HCZ.
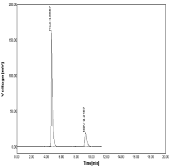
Figure 13: Linearity chromatogram ratio of 40µg/ml NBV and 100µg/ml HCZ.
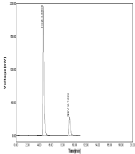
Figure 14: Linearity chromatogram ratio of 50µg/ml NBV and 125µg/ml HCZ.
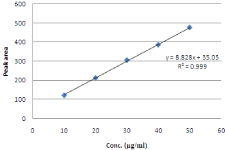
Figure 15: Linearity curve for NBV.
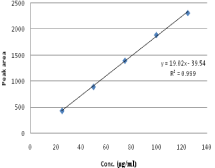
Figure 16: Linearity curve for HCZ.
    Nebivolol
    Hydrochlorothiazide


    Conc. (μg/ml)
    Peak area
    SD
    %RSD
    Conc.
    Peak area
    SD
    % RSD


    10
    120.99
    0.18
    0.15
    25
    434.98
    2.49
    0.57


    20
    212.15
    0.74
    1.02
    50
    895.77
    0.7
    0.08


    30
    305.28
    3.83
    1.26
    75
    1398.5
    3.69
    0.26


    40
    385.25
    6.82
    1.77
    100
    1893.19
    14.32
    0.76


    50
    475.85
    0.05
    0.01
    125
    2314.48
    16.5
    0.71
Table 5: Results of Linearity study of NBV & HCZ.
System suitability studies: The system suitability study was performed in which 40 µg/ml drug solution was used with two replicates and the system suitability parameters were recorded results were shown in table 5, 6. The % amount of NBV was found almost 97.81% supported by standard deviation value as 0.63 & %RSD was 0.64 (Table 6).
    Sr. no
    Concentration    (µg/ml)
    Peak area
    Amount    found
    %Amount found


    1
    40
    378.88
    38.94
    97.36


    2
    40
    382.06
    39.3
    98.25


    Mean
    39.12
    97.81


    SD
    0.25
    0.63


    %RSD
    0.65
    0.64
Table 6: System Suitability test for NBV.
Meanwhile about 99.99% of HCZ was recovered when 100 µg/ml concentrations was used for study it’s verified by value of SD as 1.30 & %RSD as 1.30 respectively (Table 7).
    Sr. no
    Concentration    (µg/ml)
    Peak area
    Amount    found
    % Amount found


    1
    100
    1844.84
    99.07
    99.07


    2
    100
    1879.83
    100.91
    100.91


    Mean
    99.99
    99.99


    SD
    1.3
    1.3


    %RSD
    1.3
    1.3
Table 7: System Suitability Test for HCZ.
Accuracy: The recovery of NBV and HCZ was determined by the 3 various concentration levels. % recovery was found to be 99.79 to 101. 19% for NBV and 98.54 to 99.86% for HCZ. The result indicating that this method was accurate. Chromatograms obtained during study of accuracy were shown in (Table 8-11, Figure 17-19).
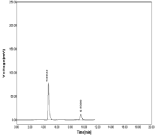
Figure 17: Chromatogram of Accuracy (Conc. 80%).
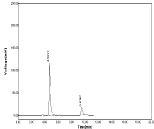
Figure 18: Chromatogram of Accuracy (Conc.100%).
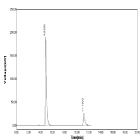
Figure 19: Chromatogram of Accuracy (Conc.120%).
    Concentration (%)
    Amount of conc. added (μg/ml)
    Mean Amount Recovered (μg/ml)
    %Recovery


    HCZ
    NBV
    HCZ
    NBV
    HCZ
    NBV


    80%
    20
    8
    19.64
    8.06
    98.89
    100.86


    100%
    25
    10
    24.21
    10.25
    96.84
    101.52


    120%
    30
    12
    29.87
    12.16
    99.83
    100.76
Table 8: Results of Accuracy.
    Inter day


    Conc. (µg/ml)
    % recovered
    SD
    RSD


    1 day
    25
    99.7
    1.15
    0.9


    4 day
    25
    101.83


    Intra    day


    Conc. (µg/ml)
    % recovered
    1.15
    0.92


    0 hrs
    25
    100.6


    4 hrs
    25
    103.1


    Different    analyst


    1st
    25
    99.8
    1.11
    0.89


    2nd
    25
    98.52
Table 9: Results of ruggedness study for NBV.
    Inter day


    Conc. (µg/ml)
    % recovered
    SD
    RSD


    1 day
    10
    100.31
    1.77
    0.41


    4 day
    10
    99.22


    Intra day


    Conc. (µg/ml)
    % recovered
    0.35
    0.08


    0 hrs
    10
    100.83


    4 hrs
    10
    99.29


    Different analyst


    1st
    10
    95.625
    0.48
    0.48


    2nd
    10
    96.824
Table 10: Results of ruggedness study for HCZ.
    Sr. no.
    NBV
    HCZ


    Peak Area Sample
    % recovered
    Peak Area Sample
    % recovered


    1
    899.44
    98.72
    215.3
    102.05


    2
    905.36
    99.35
    213.35
    100.95


    3
    884.2
    97.68
    211.46
    100.92


    4
    879.11
    99
    213.41
    101.45


    5
    890.64
    98.8
    211.8
    100.48


    6
    902.8
    99.2
    214.25
    100.97


    Mean
    99.04
    Mean
    101.5


    SD
    0.35
    SD
    0.64


    %RSD
    0.37
    %RSD
    0.61
Table 11: Results of precision study of NBV & HCZ.
Precision: Intra-day, Inter-day & Different Analyst. % amount of drugs were found with %RSD (NMT than 2%). For system precision study inter-day, intra-day & different in analyst almost 99-100% drug concentration has been recovered by RP HPLC assay concludes resulting method are highly precise.
Precision of this analysis performing six replicate Precision studies was determined by peak area. Peak area was found with % RSD (NMT than 2%) which was agreement with system suitability.
Robustness: Robustness is the ability of the analytical method to remain unchanged by small, but deliberate changes in method parameters. To determine the robustness of the proposed method, the experimental conditions were deliberately changed. The mobile phase flow rate as 0.6ml, 0.8ml & change in wavelength as 281nm, 283nm & mobile phase ratio as result in significant effects on the chromatographic resolution of the proposed method (Table 12, Figure 20-21).
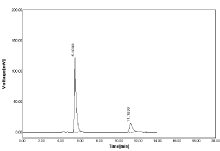
    Figure 20: Chromatogram of Robustness flow change 0.6ml for NBV and
HCZ.
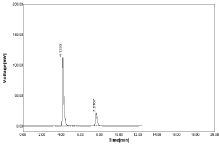
    Figure 21: Chromatogram of Robustness flow change 0.8ml for NBV and
HCZ.
    Sr. no
    Conc.    (µg/ml)
    Area for (NBV)
    Conc.    (µg/ml)
    Area for (HCZ)


    1
    30
    231.41
    75
    1195.29


    2
    30
    237.16
    75
    1199.62


    Mean
    234.29
    Mean
    1197.46


    SD
    4.07
    SD
    3.06


    %RSD
    1.74
    %RSD
    0.26
Table 12: Results of robustness (For 0.6mL).
Flow rate 0.6ml: The robustness is the studied by the evaluating effects of small but the deliberate differences in method condition .The condition is flow rate (±1/min) , The result shows as SD for NBV as 4.07 & 3.06 for HCZ & %RSD is less than 2% if flow rate as 0.6ml.
Flow rate 0.8 ml: If flow rate changes as 0.8ml the SD of NBV as 4.07min & 21.20 for HCZ and %RSD value were 1.74 for NBV & 1.33 for HCZ respectively (Table 13).
    Sr. no
    Conc.    (µg/ml)
    Area for (NBV)
    Conc.    (µg/ml)
    Area for (HCZ)


    1
    30
    231.41
    75
    1581.9


    2
    30
    237.16
    75
    1611.87


    Mean
    234.29
    Mean
    1596.89


    SD
    4.07
    SD
    21.2


    %RSD
    1.74
    %RSD
    1.33
Table 13: Results of Robustness (0.8 ml).
Change in wavelength: The sample were subjected to analyze by change in wavelength (281, 283nm) for measurement area of curve for both NBV & HCZ was quite identical and %RSD values for both drug was less than 2% (Table 14, Figure 22-23).
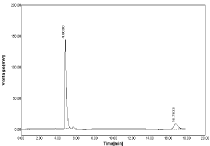
    Figure 22: Chromatogram of Robustness change in wavelength 281nm for
NBV and HCZ.
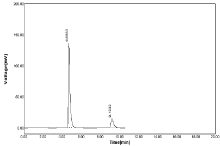
Figure 23: Chromatogram of Robustness change in wavelength 283nm.
    Sr. no
    Conc.    (µg/ml)
    Area for (NBV)
    Conc.(µg/ml)
    Area for(HCZ)


    1
    30
    283.6
    75
    1625.41


    2
    30
    281.11
    75
    1656.94


    Mean
    282.36
    Mean
    1641.18


    SD
    31.76
    SD
    22.3


    %RSD
    0.62
    %RSD
    1.36
Table 14: Results of Robustness for wavelength 281nm.
Peak area for both drugs slight varies at 283nm but value of SD & %RSD was found to be within acceptable range. Hence from this study no significant difference was observed when both drugs measured at change in wavelength as ±1 respectively.
Change in mobile phase ratio: The mobile phase ratio was changed as (±1) i.e. Acetonitrile: OPA (61:39) & (59:41) no significant different is observed in Peak area of both NBV & HCZ (Table 15-16, Figure 24-25).
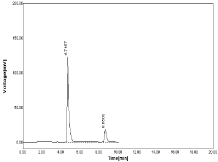
Figure 24: Chromatogram at mobile phase as 61:39.
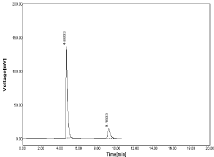
Figure 25 Chromatogram at mobile phase as 59:41.
    Conc. (µg/ml)
    Area    for (NBV)
    Conc. (µg/ml)
    Area for (HCZ)


    30
    284.88
    75
    1503.15


    30
    285.64
    75
    1520.07


    Mean
    285.26
    Mean
    1511.61


    SD
    0.54
    SD
    11.96


    % RSD
    0.19
    % RSD
    0.79
Table 15: Results of Robustness at mobile phase as 61:39 (Acetonitrile: OPA).
    Conc. (µg/ml)
    Area    for (NBV)
    Conc. (µg/ml)
    Area for (HCZ)


    30
    248.03
    75
    1514.66


    30
    281.14
    75
    1527.93


    Mean
    282.59
    Mean
    1521.3


    SD
    2.04
    SD
    9.38


    % RSD
    0.72
    % RSD
    0.62
Table 16: Results of Robustness at mobile phase as 59:41 (Acetonitrile: OPA).
Acid degradation: The negligible amount of drugs was decomposed in acidic environment as was 0.39% for Nebivolol and 1.45 & 2.45% for Hydrochlorothiazide with two additional peaks has been observed in chromatogram shown in Figure 20 (Table 17, Figure 26)
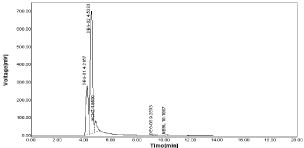
Figure 26: Chromatogram of tablet in acid degradation (0.1 NHCl).
    Name time
    Retention    time
    % Degradation
    % Purity


    NBV DEG
    39.2333
    0.39
    99.61


    HCZ DEG-1
    142.2167
    1.45
    98.55


    HCZ DEG -2
    24.6333
    2.45
    97.65
Table 17: Acid degradation of NBV & HCZ.
Base degradation: The alkaline degradation was done by sample was treated with 0.1N NaOH for 60min at 60°C. Alkaline degradation was found to be 0.015% for NBV and 0.24% for HCZ (Figure 27).
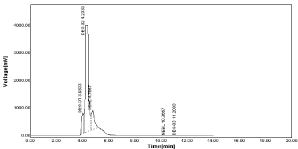
Figure 27: Chromatogram of tablet in base degradation (0.1N NaOH).
Oxidative/Peroxide degradation: The oxidative degradation was done by sample treated with 3% H2O2 was added to the flask up to the mark and refluxed on heating mantle for 60 min at 60°C. The degradation result was found to be 0.14% for NBV and 0.29% HCZ (Table 18, Figure 28).
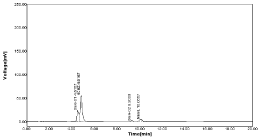
Figure 28: Chromatograms of tablet in oxidative degradation (3% H2O2).
    Name
    Area
    % Degradation
    % Purity


    NBV-DEG
    14.5167
    0.14
    99.86


    HCZ-DEG
    29.3
    0.29
    99.71
Table 18: Oxidative Degradation (3% H2O2).
Neutral degradation: The neutral degradation was done by sample treated with 5ml mobile phase (Methanol and 0.05% ortho phosphoric acid (60:40v/v)) and water was added to the flask up to the mark and refluxed on heating mantle for 60 min at 60°C. Two additional peaks are observed for HCZ after degradation with area as 013.88 & 024.48 as well as for NBV peak area was 093.55 respectively (Table 19-20, Figure 29).
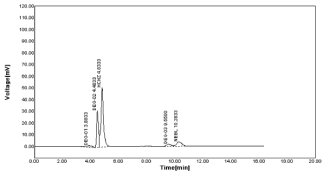
Figure 29: Chromatograms of tablet in Neutral degradation.
    Name
    Area
    % degradation
    % Purity


    HCZ
    615.774
    0.68
    99.32


    HCZ-Deg-1
    13.8833
    0.66
    99.34


    HCZ-Deg-2
    24.483
    0.122
    99.87


    NBV
    100.96
    0.29
    99.71


    NBV-DEG
    39.55
    0.122
    99.87
Table 19: Neutral Degradation.
    Sr. no
    Conc.    (µg/ml)
    Area for (NBV)
    Conc.    (µg/ml)
    Area for (HCZ)


    1
    30
    253.88
    75
    2082.34


    2
    30
    254.76
    75
    2086.22


    Mean
    254.32
    Mean
    2084.28


    SD
    0.62
    SD
    2.74


    %RSD
    0.24
    % RSD
    0.13
Table 20: Results of Robustness for wavelength 283nm.
Conclusion
The developed RP-HPLC method was found to be simple, accurate, sensitive, precise, specific, economical and rapid. The developed RP-HPLC method shows the good resolution between NBV and HCZ within the run time of 10 min. The developed RPHPLC method is very simple involving no complicated sample preparations. The parent drugs and degradation products were well resolved under optimized chromatographic conditions indicating the selective nature of developed RP-HPLC method. The developed RPHPLC method was found to be highly specific. The developed RPHPLC method was found to be linear over wider concentration range. Therefore the developed RP-HPLC method can be applied for routine quantitative and qualitative analysis of NBV and HCZ in bulk and pharmaceutical formulations like tablets. The developed RP-HPLC method was validated as per the ICH guidelines. The developed RPHPLC method has a stability indicating nature hence the proposed method could be employed for the stability studies on pharmaceutical preparations within pharmaceutical industry.
References
- The British Pharmacopoeia Commission. British Pharmacopoeia. Vol. I. London: the Stationery Office Books. 1993.
- Susan Budavari. The Merck Index, Merck Research Laboratories, 12th Edition. 1994; 1103.
- Moin Shakeb, SB Puranik and Swamy Sreenivasa. Stress Degradation Studies of Irbesartan and Hydrochlorothiazide and Development of Validated Stability Indicating Method”. Journal of Parmacetuics and Biotechnology. 2014.
- Sirisha N, Haripriya A, SwethaBhavani N, Bhagirath R, Satyanarayana M and Panikumar D Anumolu. “Simultaneous quantification of nebivolol hydrochloride and hydrochlorothiazide by first derivative UV-Spectroscopy”. Scholars Research Library Der Pharmacia Lettre. 2013; 5: 78-84.
- Napa Delhi Raj, Sockalingam Anbazhagan, Kunapareddy Anudeep Babu, Sunkara Narendra Babu, Chusena Narasimharaju Bhimanadhuni. “Validated stability indicating gradient RP-HPLC method for the estimation of antihypertensive drugs in bulk and pharmaceutical dosage forms”. International Current Pharmaceutical Journal. 2012; 1: 336-341.
- Tripti Sharma, Rajesh Patra, Dannana G Sankar, Sudam C SI. “Development and Validation of UV Spectrophotometric Method for Determination of Nebivolol Hydrochloride following ICH guidlines and study of its degradation profile”. Asian Journal of Pharmaceutical and Clinical Research. 2012; 5.
- Mohammad Yunoos, D Gowri Sankar. “Validated Stability Indicating RP- HPLC Method for Simultaneous Quantitative Estimation of Hydrochlorothiazide and Nebivolol Hydrochloride in Bulk and Combined Tablet DosageForm”.
- Mahesh Dangi, Darshana Chaudhari, Mayur Sinker. Stability Indicating HPTLC Method for Estimation of Nebivolol Hydrochloride and Amlodipine Besylate in Combination. Eurasian J. Anal. Chem. 2010; 5: 161-169.