Research Article
Austin J Anal Pharm Chem. 2018; 5(2): 1102.
Application of Different Spectrophotometric Methods for Determination of Aspirin and Omeprazole in Pharmaceutical Preparation
Nassar MWI1, Attia KAM1, Mohamed AA1, Morshedy S2 and Shahin M2*
¹Analytical Chemistry Department, Faculty of Pharmacy, Al-Azhar University, Cairo, Egypt
²Pharmaceutical Analysis Department, Faculty of Pharmacy, Damanhour University, Damanhour, Egypt
*Corresponding author: Mohamed Shahin, Pharmaceutical Analysis Department, Faculty of Pharmacy, Damanhour University, Damanhour, Egypt
Received: June 29, 2018; Accepted: September 12, 2018; Published: September 19, 2018
Abstract
Three spectrophotometric methods have been developed for determination of aspirin and omeprazole in their new pharmaceutical dosage form. The zero order absorption spectra of aspirin and omeprazole show severe overlap. Second derivative, simultaneous equation and area under the curve spectrophotometric methods have been applied to resolve this overlapping through using different mathematical manipulations. The described methods has been validated with respect to linearity, limits of detection and quantification, accuracy, precision and specificity. Also, they have been applied for the determination of aspirin and omeprazole in their new pharmaceutical preparation.
Keywords: Aspirin; Omeprazole; Quantitative analysis
Introduction
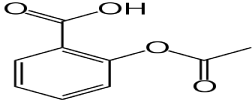
Yosprala tablet, a new combination of Aspirin (ASP), Figure 1 and Omeprazole (OPZ), Figure 2 was recently approved to protect high risk patient of developing aspirin-associated gastric ulcers [1].

Figure 1: Structure formula of ASP.

Figure 2: Structure formula of OPZ.
In this work three validated simple spectrophotometric methods have been developed for determination of ASP and OPZ in their pure and pharmaceutical dosage form. The described methods namely second derivative (2D), simultaneous equation (SE) and area under the curve (AUC) [2-4].
Experimental
Materials and reagents
Pure ASP (99.25%), OPZ (99.75%) and Yosprala® tablets nominally containing 81mg of ASP/40mg of OPZ per tablet were kindly supplied by National Organization for Drug Control and Research, Giza, Egypt. Ethyl acetate, methanol, and toluene, HPLC grade (Sigma-Aldrich, Germany).
Apparatus
Shimadzu UV-Visible 1650 Spectrophotometer, (Tokyo, Japan), equipped with 10mm matched quartz cells.
Standard solutions
A standard solution of 100μg/mL of ASP and OPZ was prepared by dissolving 10mg of the drug powder in 50mL of methanol using a two separated 100-mL volumetric flask and completing to volume with methanol.
Procedures
General procedures: Different aliquots of ASP and OPZ standard solutions (100μg/mL) were transferred to 10 ml volumetric flasks ranging from (20–140) μg for ASP and (4–20) μg for OPZ then volume completed with methanol. The absorption spectra (from 200 to 400 nm) of these solutions were recorded using methanol as a blank.
For 2D method, the second derivative corresponding to each absorption spectrum of each drug was recorded, using Δλ = 8nm and scaling factor 70. The amplitude values were measured at 242nm for ASP and 318nm for OPZ.
For SE method, the absorbance values at 275nm (Λmax of ASP) and 302nm (Λmax of OPZ) were recorded. Absorbance and absorptivity coefficient values were used for calculating the concentration of ASP and OPZ in their mixture using these equations:
where: A1 and A2 are absorbance of samples at 275 and 302 nm respectively, ax1 and ax2 are absorptivity values` of ASP at 275nm and 302nm respectively, aY1 and aY2 are absorptivity values of OPZ at 275nm and 302nm respectively, Cx is the concentration of ASPCy is the concentration of OPZ.
For AUC method: areas under curve [for the selected wavelength ranges 260-270 nm and 280-290 nm] were recorded. Areas under curve and area absorptivity values were used for calculating the concentration of ASP and OPZ in their mixture using equations these equations:
where AUCX λ1- λ2 and AUCX λ3- λ4 are area under curve for ASP at the wavelength range 260- 270 and 270-280, respectively. AUCY λ1- λ2 and AUCY λ3- λ4 are area under curve for OPZ at the wavelength range 260- 270 and 270-280, respectively. AUCX λ1- λ2 and AUCX λ3- λ4 are absorptivity values for ASP at the wavelength range 260- 270 and 270-280, respectively. AUCY λ1- λ2 and AUCY λ3- λ4 are absorptivity values for OPZ at the wavelength range 260- 270 and 270-280, respectively.
Analysis of laboratory prepared mixtures: Into serious of 10ml volumetric flasks an accurate aliquots equivalent (20–140) μg and (4–20) μg for ASP and OPZ respectively were added together and volumes were completed with methanol. These laboratory mixtures were analyzed using the general procedures of each method.
Analysis of pharmaceutical formulation: Five Yosprala® tablets (81mg of ASP/40mg of OPZ per tablet) were weighed and powdered. Appropriate weight of powder equivalent to one tablet was accurately weighed, transferred to 100ml volumetric flask and the volume was made up to 50ml with methanol. The solution was shaken vigorously for 20min then sonicated for 30 min and filtered. The volume was completed to 100ml with methanol to produce a stock solution labeled to contain 0.81 and 0.4mg/ml of ASP and OPZ respectively. Necessary dilutions of the stock solution were made with methanol to obtain different concentrations of ASP and OPZ covering the linearity range.
Result and Discussion
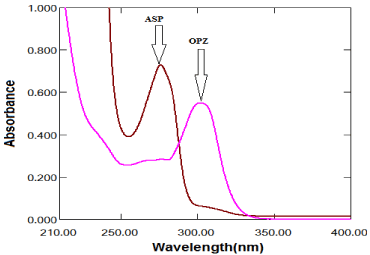
The zero order absorption spectra of ASP and OPZ, Figure 3 show severe overlap which hindered the application of direct spectophotonetric methods. 2D, SE and AUC spectrophotometric methods have been developed to severe overlapping of the absorption spectra of ASP and OPZ without previous separation.

    Figure 3: Zero-order absorption spectra of ASP (100μg/mL) OPZ (10μg/mL)
in methanol.
Methods development and optimization
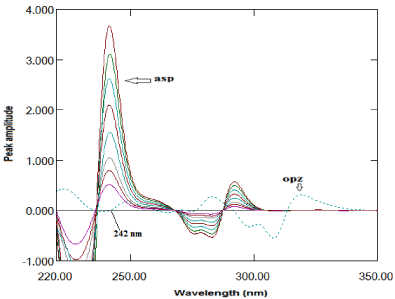
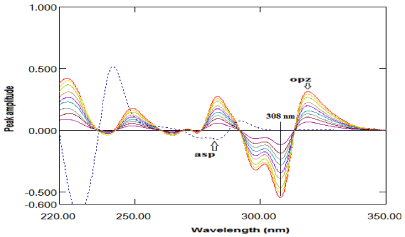
Second derivative method: The second derivative method enabled determination of ASP and OPZ in their binary mixture. Two factors have been checked to give the most accurate results. Several delta lambda and scaling factor values were examined and it was found that delta lambda= 8 and scaling factor= 70 were the best values factors to give the most derivative spectra enabled the estimation of the two compounds. A to f 242nm, ASP was determined without any contribution of OPZ which cross zero line at this wavelength, as shown in Figure 4. On the other hand, ASP cross zero line at 308nm as shown in Figure 5, so the amplitudes at 308nm was proportional to the concentrations of OPZ without any interference from ASP. The measured amplitude values versus the final drug concentrations in μg/mL were plotted to get the calibration graph and the regression equation was derived for each one as shown in Table 1.
    Parameters
    Second derivative
    Simultaneous equation
    Area under the curve


    ASP
    OPZ
    ASP
    OPZ
    ASP
    OPZ


    Wavelength (nm)
    242
    308
    276 and 302
    260-270 and 280-290


    Linearity
      range (μg/mL)
    20-140
    4-20
    20-140
    4-20
    20-140
    4-20


    Accuracy (%R)a
    100.093
    99.04
    99.78
    99.69
    98.77
    100.23


    Precision
      (%RSD)a
    Repeatability
    0.934
    0.87
    0.87
    0.721
    0.658
    0.524


    Intermediate
      precision
    1.043
    0.987
    0.987
    1.023
    0.871
    0.742


    aValues for 3 determinations of 3 different    concentrations.
Table 1: Characterization and validation data for determination of ASP and OPZ by the proposed spectrophotometric methods.

    Figure 4: Second derivative of absorption spectra of ASP (20- -140μg/ml)
and OPZ (20μg/ml) in methanol.

    Figure 5: Second derivative of absorption spectra of OPZ (4- 20μg/mL) and
ASP (20μg/mL) in methanol.
Simultaneous equation method: For quantitative estimation of ASP and OPZ, absorbance values were recorded at 275nm and 302nm. The absorptivity coefficient values of each component at both wavelengths were determined. Then the absorbance and absorptivity coefficient values were used for calculating the concentration of ASP and OPZ in their mixture using equations 1&2 mentioned under the general procedure. The characterization and validation of the method were presented as shown in Table 1.
Area under the curve method: The area under the curve for ASP and OPZ were recorded over wavelength ranges of 260–270 nm and 270–280 nm. The absorptivity values of ASP and OPZ were determined at each wavelength range. The concentrations of ASP and OPZ in their mixture using the equations 3&4 mentioned under the general procedure. The characterization and validation of the method were presented as shown in Table 1.
Methods validation
The proposed methods were validated in compliance with the ICH guidelines. Table1 shows the LOD, LOQ, linearity and range also accuracy and precision of the proposed methods.
The validity of the proposed procedures is further assessed by applying the standard addition technique and the results indicated that no excipients interference. The results obtained were shown in Table 2. Table 3 shows the specificity; recovery of the laboratory prepared mixtures of the studied drugs.
    Drug
    Pharmaceutical
      Taken (&mug/mL)
    Pharmaceutical found (&mug/mL)
    Pure
      added
      (μg/mL)
    Pure
      found
      (&mug/mL)
    % Recovery


    Second derivative
    ASP
    24.3
    24.20a
    20
    20.18
    100.9


    40
    40.33
    100.82


    60
    60.14
    100.23


    Mean± %RSD
    100.65±0.366


    OPZ
    8
    7.97a
    15
    15.12
    100.8


    20
    20.13
    100.65


    30
    30.41
    101.36


    Mean± %RSD
    100.93±0.374


    Simultaneous equation
    ASP
    24.3
    24.19a
    20
    20.12
    100.6


    40
    40.22
    100.55


    60
    60.81
    101.35


    Mean± %RSD
    100.83±0.448


    OPZ
    8
    7.94a
    15
    15.12
    100.8


    20
    20.08
    100.4


    30
    30.14
    100.46


    Mean± %RSD
    100.55±0.216


    Area under the curve
    ASP
    24.3
    24.26a
    20
    20.12
    100.6


    40
    40.27
    100.67


    60
    59.73
    99.55


    Mean± %RSD
    100.27±0.627


    OPZ
    8
    7.89a
    15
    14.96
    99.73


    20
    20.09
    100.45


    30
    29.61
    98.7


    Mean± %RSD
    99.63±0.879


    aAverage of five determinations.
Table 2: Recovery study of ASP and OPZ by adopting standard addition technique via the proposed spectrophotometric methods.
    Method
    ASP (μg/mL)
    ASP (μg/mL)
    % Recovery of ASP
    OPZ (μg/mL)
    OPZ found (μg/mL)
    % Recovery of OPZ


    Second derivative
    8.1
    7.99
    98.64
    4
    3.95
    98.75


    16.2
    16.45
    101.54
    8
    7.9
    98.75


    24.3
    24.23
    99.71
    12
    12.1
    100.83


    32.4
    32.68
    100.86
    16
    16.04
    100.25


    Mean± %RSD
    100.19±1.279
    Mean± %RSD
    9.65±1.061


    Simultaneous equation
    8.1
    8.12
    100.24
    4
    3.99
    99.75


    16.2
    16.32
    100.74
    8
    7.94
    99.25


    24.3
    24.36
    100.24
    12
    12.12
    101


    32.4
    32.53
    100.4
    16
    16.19
    101.18


    Mean± %RSD
    100.41±0.233
    Mean± %RSD
    100.29±0.946


    Area under the curve
    8.1
    8.13
    100.37
    4
    3.97
    99.25


    16.2
    16.41
    101.29
    8
    7.98
    99.75


    24.3
    24.19
    99.54
    12
    12.21
    101.75


    32.4
    32.48
    100.24
    16
    16.11
    100.68


    Mean± %RSD
    100.37±0.719
    Mean± %RSD
    100.35±1.102
Table 3: Determination of aspirin and omeprazole in laboratory mixtures by the proposed spectrophotometric methods.
Application to pharmaceutical formulation
The quantitative analysis of ASP and OPZ in Yosprala® tablets was determined by the proposed methods. Satisfactory results were obtained in good agreement with the label claim, indicating no interference from excipients and additives as shown in Table 4.
    Parameters
    Second derivative
    Simultaneous equation
    Area under the curve


    ASP
    OPZ
    ASP
    OPZ
    ASP
    OPZ


    na
    5
    5
    5
    5
    5
    5


    Average (%Recovery)
    100.36
    100.77
    98.25
    99.58
    100.25
    98.78


    %RSD
    0.75
    0.51
    0.98
    0.87
    0.62
    0.52
Table 4: Determination of ASP and OPZ in Yosperala® tablets by the proposed spectrophotometric methods.
Conclusion
In this work, three different spectrophotometric methods provide a simple, accurate and precise ways for quantitative analysis of aspirin and omeprazole in their pure and pharmaceutical dosage form. The suggested methods found sensitive and could be applied for routine analysis of studied drugs in the pure form or in the pharmaceutical formulation.
References
- Veltri KT. Yosprala: A fixed dose combination of aspirin and omeprazole. Cardiol Rev. 2018; 26: 50.
- Attia K, El-Abassawi N, El-Olemy A, Abdelazim A. Second derivative spectrophotometric and synchronous spectrofluorometric determination of lesinurad in the presence of its oxidative degradation product. New J Chem. 2018; 42: 995-1002.
- Attia KA, El-Abasawi NM, El-Olemy A, Abdelazim AH. Simultaneous spectrophotometric determination of elbasvir and grazoprevir in a pharmaceutical preparation. J AOAC Int. 2017; 101: 394-400.
- Attia KA, El-Abasawi NM, El-Olemy A, Abdelazim AH. Application of different spectrophotometric methods for simultaneous determination of elbasvir and grazoprevir in pharmaceutical preparation. SpectrochimActa A Mol Biomol Spectrosc. 2018; 189: 154-160.