
Research Article
Austin J Anal Pharm Chem. 2018; 5(2): 1103.
Determination of NaHCO3 Content in Alka-Seltzer Tablets: An Acoustic Approach
Crespo Sariol H,1, Mari&nTilde;o Peacok T1, Sánchez Roca á2, Carvajal Fals H2, Puente Torres J3, Yperman J4*, Carleer R4 and Brito Sauvanell á2
¹Faculty of Chemical Engineering, Laboratory of Applied Acoustics, Universidad de Oriente, Santiago de Cuba, Cuba
²Faculty of Mechanical Engineering, Universidad de Oriente, Santiago de Cuba, Cuba
³Facultyof Electrical Engineering, Universidad de Oriente, Santiago de Cuba, Cuba
4Research group of Applied and Analytical Chemistry, Hasselt University, Agoralaan building D, B-3590 Diepenbeek, Belgium; Email: jan.yperman@uhasselt.be
*Corresponding author: Jan Yperman, Research group of Applied and Analytical Chemistry, Hasselt University, Agoralaan building D, B-3590 Diepenbeek, Belgium
Received: July 21, 2018; Accepted: September 12, 2018; Published: September 19, 2018
Abstract
The feasibility of using acoustic emission analysis in order to determine the sodium bicarbonate (NaHCO3) content in Alka-Seltzer tablets is evaluated. The mass of reactive NaHCO3 of two different types of tablets has been assessed using the acoustic emission method based on the signal of the typical bubbling sound produced by CO2 formation in the acid-base reaction by water and lactic acid solution flooding the Alka-Seltzer tablets. The produced sound intensity can not only be related to the amount of NaHCO3 present but also to the differences in the total composition of the tablets. The NaHCO3 content in the tablet was acoustically determined using calibration curves from the bubbling sound produced by contacting moisturized sodium bicarbonate and lactic acid. NaHCO3 determined is in very good agreement with the bicarbonate content reported by the manufacturer using the cumulative energy parameter.
Keywords: Alka-Seltzer; NaHCO3 content; Acoustic emission; Bubbles
Introduction
Alka-Seltzer is a well-known antacid and pain-relief medication that is dissolved in water before it is ingested. It is presented as an effervescent tablet that contains basically aspirin (acetylsalicylic acid: MW=180.16), citric acid (MW=192.13), and sodium bicarbonate (MW=84). As the tablet dissolves in water, sodium bicarbonate undergoes the acid–base reaction with the acids (citric and acetylsalicylic) contained in the tablet releasing carbon dioxide which causes the bubbling (effervescency) effect according to reaction I [1].
The content of carbonates and bicarbonates can be quantified by measuring parameters such as simple weight loss, gravimetric analysis, eudiometry, titration or volume of CO2 formed from the reaction with a dedicated acid [2,3]. The percent by mass of sodium bicarbonate in Alka-Seltzer tablets can be determined by the method of eudiometry [4].
Recently, a number of papers have been published describing an acoustic emission method for the characterization of activated carbons [5-7]. By flooding an activated carbon sample with water, it results in a sound emission produced by the bubbles escaping from the carbon cracks and pores when water molecules occupy the air filled voids inside of the material by displacing the present air. The bubbles escape through the bulk water and explode at the liquid surface. It was found that parameters of the carbon acoustic signal can be successfully correlated with the porosity of the material [5-7]. Bubbles and its corresponding sound patterns are in general widely studied, theoretically analyzed and applied in many scientific fields.
The analysis of acoustic and vibrating signals to characterize different events such as pump cavitation, cooking stages or stir spot welding process have proven to be accurate and sensitive techniques [8-11].
The effervescency effect of the of Alka-Seltzer tablets by releasing the CO2 after contacting with water (or an acid) produces a typical bubbling sound which can give information about the volume of gas produced in the acid-base reaction, therefore, it can be considered as an analogous phenomenon which is used for the activated carbon acoustic porous assessment [5-7]. Since the amount of CO2 is stoichiometry related with the reacting amount of NaHCO3, using a proper acoustic method to analyze the CO2 bubbling process, the amount of reacting bicarbonate can be quantified.
In this work, acoustic emission measurements of the typical Alka- Seltzer effervescence sound are evaluated in order to determine the reactive bicarbonate content in the tablet. This study is an approach to assess the NaHCO3 content not only in Alka-Seltzer tablets but also in other materials where the amount of carbonates/bicarbonates or other gas forming acids needs to be evaluated using an acid-base reaction.
Materials and Methods
Alka-Seltzer tablets
Two types of Alka-Seltzer tablets (Bayer Corporation) were evaluated: Alka-Seltzer Original (AZ-Original) and Alka-Seltzer Extra Strength (AZ-Extra). Table 1 shows the compounds listed in each type of tablet according to the reported values by the manufacturer labeled in the product.
    Content
    Type of Tablet


    AZ Original
    AZ Extra


    Anhydrous    citric acid (mg)
    1000
    1000


    Aspirin (mg)
    325
    500


    Sodium    bicarbonate (mg)
    1916
    1985


    Total (g)*
    3.241
    3.485


    *Calculated using the reported values.
Table 1: Content of each type of tablet (labeled on the product).
Five packages (10 tablets) for each type of Alka-Seltzer were used for the experiments as follows: five tablets from each type were used to perform the experiments using water and the other five tablets were tested applying a lactic acid solution (1.63mol/L) to determine NaHCO3 content in the tablet based on the acoustic measurements. The lactic acid was selected for the experiments due to its low volatility and suitable pKa value (3.8). Too corrosive inorganic acids, or low density organic acids such as acetic or formic acids which can produce fumes during the reactions must be avoided for the acoustic experiments since acid fumes can damage the microphone diaphragm (sensor) as displayed in Figure 1. Further modification on the current acoustic setup is in process in order to tackle the current inconveniences in using different reactants without affecting the microphone. The lactic acid (reactant quality) was supplied by UNICHEM ®. Tablets were weighed on a FX-1200iAND balance (± 0.01g).
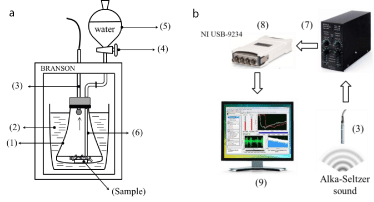
    Figure 1: Simplified scheme of the sound enclosure box (a) and acoustic
measurement set-up (b).
Sodium bicarbonate (UNI-CHEM®) was used to obtain the calibration curve. Different amounts of NaHCO3 were put in contact with 35mL of the lactic acid to initiate the acid-base reaction which is used as model to correlate with the Alka-Seltzer reaction in terms of sound intensity produced by formed CO2 bubbles. The bicarbonate was intentionally moistened (water content: 48%) to make the acoustic measurement possible. Pure bicarbonate (heat-treated) was ineffective to perform the experiments; as dust of pure NaHCO3 is too light, part of the material (particles) float on the liquid surface being also dragged out from the bubbling liquid by the intense gas flow in form of thick white foam. On the contrary, the moistened material is not affected by the gas dragging process.
Signal capture and processing
The acoustic emission experiments were performed in a calibrated BRANSON® sound enclosure box (Figure 1a) under similar conditions as previously reported [6,7] but further sample (NaHCO3 or Alka-Seltzer tablet) is put on the bottom of Erlenmeyer flask (1) which is now placed into a vessel and almost completely surrounded by sand (2) in order to reduce optimally possible external interferences (Figure 1a).
The microphone (G.R.A.S.® 46 AG) (3) is adjusted capping the Erlenmeyer flask using a soft foam-sponge gasket avoiding the rigid interconnections, thus reducing the possibility of measuring undesirable vibrations produced during the bubbling process. After closing the sound enclosure box, the valve (4) is opened and 35ml of liquid (water or lactic acid solution) flow from the separator funnel (5) through the injection tube (6) towards the bottom of the Erlenmeyer. It takes about 4s for the liquid to flood the sample and immediately CO2 bubbles are generated producing the typical effervescent sound.
(1) Erlenmeyer flask, (2) Sand, (3) Microphone, (4) Valve, (5) funnel, (6) Injection tube, (7) Separator Power module, (8) NIUSB- 9234 data acquisition card, (9) PC.
In this case, acoustic emission is captured by the microphone (Figure 1b) and amplified in the power module (7) (Gain: +50dB) and digitalized using a NI USB-9234 data acquisition card. Digital data is recorded in the computer to be processed using MATLAB® software. The set-up was calibrated using a G.R.A.S® 42AP Intelligent Pistonphone.
The methodology applied for signal processing and analysis was performed following the same methodology previously described [6,7] for the characterization of activated carbons. Summarizing, to discard any external interference associated with the frequency of interest, spectrogram and components of frequency within the range of 0.2-25 kHz were recorded at empty sound enclosure box. No external interferences (noise) were found in the original signal in the selected frequency range. A high-pass (HP) filter was used for the signal filtering in the range of interest (0.8-25 kHz), the acoustic signals were characterized within the time domain using the Hilbert Transform of the vibro-acoustical signals. The Hilbert Transform of the function x(t) is defined by the equation (2) [6,7,9].
The Hilbert transform facilitates the formation of the analytical signal, which is useful for the signal processing. The analytical signal is a complex signal consisting of the original signal X(t) as the real part and the imaginary part as the Hilbert transform of the original signal y(t) [6,7,9],
where y (t) = H(t) (3)
The Hilbert transform of the signal was found using a finite impulse response (FIR) filter, and it is then multiplied by “i” (the imaginary unit) and added to the original signal, obtaining a new complex signal z(t), named the analytical signal (equation (4)) [9].
z(t) = x(t) + iy(t) (4)
The original signal is time delayed before being added to the Hilbert transform to match the delay caused by the Hilbert transform, which is one-half the length of the Hilbert filter. The envelope of the signal can be found by taking the absolute value of the analytical signal z(t). The imaginary part is a version of the original sequence with a 90° phase shift. The Hilbert transformed series have the same amplitude and frequency value as the original data and include phase information that depends on the phase of the original data. Once the envelope of the acoustic signal has been obtained, and in order to eliminate the rise and smooth of the envelope, the signal is passed by a low pass filter [6,7]. The main goal of this process is to facilitate the extraction of the signal envelope data in order to correlate them with the CO2 bubbling intensity which is proportional to the content of reactive bicarbonate in the tablet.
The cumulative energy of the acoustic signal was calculated applying the Parseval’s theorem (1799) which is often described with the equation (5) [12,13].
Where X(ω) represents the continuous Fourier transform (in normalized unitary form) of X(t)and ω is the frequency in radians per second. The interpretation of this theorem is that the total energy of a signal can be calculated by summing power-per-sample across the time or spectral power across frequency.
For discrete time signals, the theorem becomes
where X is the discrete time Fourier transform of x and ø represents the angular frequency in radians per sample of x. The obtained results establish the relationship between envelopes and the cumulative energy of Alka-Seltzer effervescence acoustic signals generated by a liquid flooding the tablet and its reactive NaHCO3 content.
Results and Discussion
Figure 2 depicts the typical features of the Alka-Seltzeracoustic signal in contact with 35mL of water (left) or 35mL of lactic acid solution (of a 1.63molL-1 solution) (right). Lactic acid was chosen to mimic more the citric acid present in the tablets. The amplitude in time domain for Alka-Seltzer tested in water (a) is different in comparison with the signal found when the lactic acid is used (b).

    Figure 2: Features of the Alka-Seltzer acoustic signal using different liquids:
water (35mL) and lactic acid (35mL of a 1.63molL-1 solution). Signal amplitude
(a), spectrogram (c) and frequency distribution (e) in the tablet-water contact
and signal amplitude (b), spectrogram (d) and frequency distribution (f) in the
tablet-acid contact.
For the tablet tested in water, the amplitude increases in the first twenty seconds and progressively diminishes with the presence of randomly and separated “clicks” which are associated with the last bubbles exploding on the water surface. On the other hand, when the lactic acid solution is used, the signal amplitude behaviour (Figure 2b) is quite different from the experience with water. After the initial amplitude increment, the signal amplitude keeps approximately a constant value but lower than the observed for the tablet in water.
After about 50s, the signal amplitude slowly increases again using the lactic acid solution, and suddenly decays after 180s demonstrating longer bubbling period than for the tablet in water.
Figure 2c and 2d show the spectrograms of the signal when water and lactic acid are applied, respectively. The explosion of the gas bubbles on the liquid surface appears thus randomly and chaotically, therefore they cause a great increase in pressure pulsation and a turbulent sound in a wide frequency range [11]. According to the spectrogram presented in Figure 2c and 2d, the Alka-Seltzer bubbling process is chaotic and bubbles of different size appears at the same time defined by an specific frequency based on the Minnaert theory (1933) [14,15]. Additionally, differences in the bubbles sizes and its volumetric concentration in the liquid as a function of time can be noticed from the spectrogram in Figure 2b. The analogous phenomenon was reported by Z. Travnicek et al. (2012) studying the process of degasification of cold water [8].
Although the same frequencies components are present in both cases within the range of 0.8-25 kHz (double arrow), differences in intensity and time distribution can be noticed. For water (Figure 2c) at the beginning of the contact water-tablet the most intense gas production is observed with the highest value of amplitude for all the frequencies which demonstrate a drastic reduction after 60s time. After this period, the sound amplitude gradually decreases according to the diminishing of the CO2 bubble production rate and its concentration. On the contrary, for the tablet-acid contact (Figure 2d), the initial part of the process shows lower amplitude than in the case of water contact with a lack contribution in amplitude at high frequencies range (5-25 kHz). However, as the reaction progresses, the amplitude at lower frequencies bands (0.8-5 kHz) diminishes and the amplitude at higher frequencies reaches its maximum to abruptly decay at around 180s. The frequencies distribution for tablet-water and tabletacid contacts are presented in Figure 2d and 2e respectively. Four distinctive peaks located within the frequency ranges of (1to1.3kHz), (2 to 3 kHz), (4 to 5 kHz) and (8 to 25 kHz) but exhibiting different amplitude can be observed in both cases. For tablet-water contact the peak (1 to 1.3kHz) has higher amplitude in comparison with the tablet-acid contact which suggests more contribution of amplitude in the other frequency ranges. Each frequency band is associated with a specific bubble size, according to the Minnaert theory [14,15] the bigger the bubble, the lower the frequency), in the tablet-water contact, the contribution of bigger size bubbles in the Alka-Seltzer sound is higher than in the case of tablet-acid contact. This behaviour is an expected fact as this “bubble sound” is actually produced by an excitation process which comes from the bubble surface being torn apart as the liquid skin maintained by surface tension breaks, forming a Helmholtz resonator [16,17]. Therefore, the physical properties of the liquid highly influences the size distribution of the gas bubbles formed and consequently the sound pattern produced.
Figure 3 displays the signal envelopes in time domain (high-pass filtered at 0.8-25 kHz) of the Alka-Seltzer original sound using water and lactic acid solution.
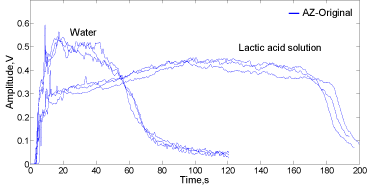
    Figure 3: Signal envelopes for Alka-Seltzer original in contact with water
(35mL) and lactic acid solution (35mL of a 1.63mol.L-1 solution).
Comparing the envelopes behaviour, the described patterns confirm the differences between the signal amplitude in time domain shown in Figure 2a and 2b. In the first 20s, the signal abruptly increases in amplitude reaching its maximal value near to 0.6 V when water is used for the contact. In the period from 20 to near 60s a decreasing tendency in amplitude is observed which is associated with the diminishing of the bubbles production rate. After 60s, an abrupt decay in amplitude is observed reaching the lowest amplitude after 100s where technically the bubbling process ends, just a few bubbles exploding on the liquid surface.
In contrast, when the lactic acid solution is used, at the beginning the amplitude increment is lower than the value observed for the tablet-water pair, followed by a slower growing trajectory in amplitude reaching its maximum within around 100-120 s followed by a discrete decreasing trend to abruptly drop at around 180s when the bubbling process stops.
The integral area under the signal envelope curves (SS in Vs) and the cumulative energy of the signal (E0 in V2/s) were determined for tablets in contact with water and lactic acid solution and values are depicted in Table 2. Five experiments were performed, and the statistical parameters were determined. The Multiple Comparison Method was applied to determine statistical differences between the mean of the samples. The applied method was the Fisher’s Lower Significant Difference (LSD) method. Significant statistical differences were found in the means of SS and E0 between the tablet-water and tablet-acid pairs.
    AZ-Original


    Water
    Lactic acid    solution


    #
    Tablet mass (g)
    SS (Vs)
    E0 (V2/s)
    Tablet mass (g)
    SS (Vs)
    E0 (V2/s)


    1
    3.21
    29.67
    7.98
    3.21
    65.69
    19.05


    2
    3.22
    28.96
    7.52
    3.24
    70.6
    18.52


    3
    3.22
    30.14
    8.31
    3.23
    67.26
    18.48


    4
    3.24
    29.33
    7.83
    3.24
    73.24
    19.53


    5
    3.23
    32.17
    8.24
    3.22
    69.46
    17.48


    3.22
    30.05
    7.98
    3.23
    69.25
    18.61


    s(x)
    0.01
    0.58
    0.32
    0.01
    2.93
    0.77


    VC (%)
    0.35
    4.19
    4.02
    0.4
    4.24
    4.11


    Averaged value , s(x): Standard deviation, VC: Variability coefficient. Normal    distribution of the data was confirmed.
Table 2: Experimental data for AZ-Original reacting with water and lactic acid
solution: (integral area under the signal envelope curve (SS) and cumulative
energy of the signal (E0)).
In the case of tablet-acid contact, the area under the envelope curve and the cumulative energy are approximately the double of the value observed for tablet-water system. This is in line with the amount of reacting bicarbonate in each pair. Indeed, for the tablet-water contact the acid-base reaction occurs between the acetylsalicylic acid, citric acid and the bicarbonate. Therefore, according to the manufacturer information on the tablet packaging (Table 1), the amount of acids originally present in the tablets is not enough to neutralize all of the sodium bicarbonate. The stoichiometric amounts of acid/base content for the tablets expressed as ratio (mmol of H+/ mmol of HCO3 -) in each type of explored tablet is (17.40/22.81) for AZ-Original and (18.38/23.63) for AZ-Extra. Therefore an excess of NaHCO3 is present and coinciding with a deficiency of needed amount of acid to have a 100% transformation of all NaHCO3 into CO2 according reaction (1), making a quantitative determination of sodium bicarbonate not possible.
In contrast, when the lactic acid solution is used for the reaction, the bicarbonate is completely consumed as the acid is in excess present; therefore, more CO2 bubbles are formed in accordance with the original amount of NaHCO3 present with a correspondent acoustic signal of higher SS and E0.
Beyond the values of SS and E0, the envelopes shape (Figure 3) suggests two different reaction schemes. According to Figures 2 and 3, water interacts with the tablet in a different way as the acid does. In water, a massive amount of bubbles is formed releasing high energy at the beginning of the process with an important contribution of the bigger bubbles. The tablet is quickly dissolved in water within about 80 s. However in the lactic acid solution it takes around the double of the time to dissolve the tablet and the process is characterized by a more monotonic acoustic signal in comparison with the tablet-water contact. Taking into account the chemical-physical differences of both liquids used and its distinctive interaction with the tablet, these results suggest two different reaction mechanisms.
Figure 4 depicts the experimental and fitted data of cumulative energy for the AZ-Original from the experiments using water and lactic acid. Although other models can be explored, in both cases the data were fitted using the classical Boltzmann’s model (equation 7).
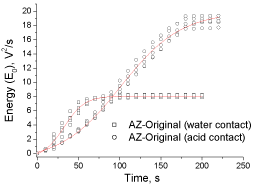
    Figure 4: Experimental and fitted data of cumulative energy (E0) for the
experiments using water and lactic acid (AZ-Original).
According to the found differences between the fitting parameters applying water and acid depicted in Table 3, but also comparing the characteristics of the experimental cumulative energy data of Figure 4, the Boltzmann model properly describes the experimental E0values. Making a comparison between curve trajectories, fitting parameters and direct visual observation of the experiments, different bubbling processes are taking place.
    Model: Boltzmann
    AZ-Original


    Parameter
    Water
    Lactic acid solution


    A1
    -0.67 (+/- 0.22)
    -1.07 (+/- 0.33)


    A2
    8.08 (+/- 0.04)
    19.94 (+/- 0.26)


    x0
    32.51 (+/- 0.98)
    101.39 (+/- 0.98)


    dx
    12.59 (+/- 0.69)
    36.77 (+/- 0.69)


    R2
    0.987
    0.992
Table 3: Parameters and characteristics of experimental cumulative energy data
fitted at the Boltzmann’s model for AZ-Original reacting with water and lactic acid.
Figure 5 displays a simplified scheme of the AZ-Original reacting in water (a,b,c) and with the lactic acid solution (c,d,e) at three different stages as a solid-fluid heterogeneous reaction process. In the case of tablet-water contact, as soon as the water touches the tablet ((a): t=0) an intense bubbling process takes place with bubbles of different sizes but characterized by an important contribution of bigger bubbles.
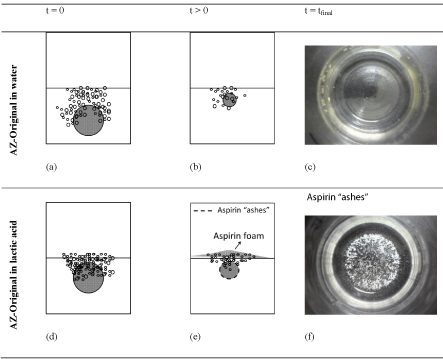
    Figure 5: Simplified scheme of the AZ-Original reacting in water (a,b,c) and
with the lactic acid solution (d,e,f) at different reaction stages.
These bigger bubbles arrive and explode at the liquid surface faster than the smaller ones, thus releasing more energy [16,17]. In about 40s (represented in (b): t >0) the bubbles concentration diminishes. Finally, after 100 s the tablet has been completely dissolved in water as it is shown in the picture ((c): t = tfinal) of the bottom of the Erlenmeyer flask after performing the experiment.
On the other hand, the tablet-lactic acid contact behaves in a different way Figure 5 (d,e,f). In this case, smaller bubbles dominates the bubble size distribution already at the beginning of the process ((d): t=0). However, as the reaction progresses, a white foam of floating particles of aspirin is formed at the liquid surface. As three acids are competing for neutralizing the bicarbonate, the preferential reaction will depend of the acid strength and in this case, NaHCO3 being the limiting substance. Comparing the strengths of the reacting acids, aspirin has no opportunity to react with the bicarbonate which is faster consumed by citric and lactic acid leaving the aspirin in a sort of “ash” on the tablet surface, affecting the tablet-liquid reaction mechanism, making the diffusion rate of the liquid to the inner part of the tablet slower and also blocking the gas diffusion out of the particle.
The aspirin ashes are eventually pulled up from the reacting surface due to the progressive structural weakening of the tablet during the reaction coinciding the bubbles dragging force in a kind of flotation process which drives the non-reactive aspirin to the liquid surface as foam. This foam becomes thicker as the reaction proceeds ((e): t > 0). Finally, when the reaction is over, the aspirin ashes precipitate to the Erlenmeyer’s bottom ((f): t = tfinal).
The combined effect of the chemical-physical properties of the used liquid for the reaction, the aspirin ashes formation at the tablet surface and its flotation process (foam) suggest a complex reaction mechanism which in turn affect the sound pattern obtained. It can be suggested that the CO2 bubbles find more resistance to finally explode at the liquid surface to produce the bubbling sound when lactic acid is applied. The aspirin ashes diminish the solid-liquid and the solid-gas diffusion rates and induce foam modification in the airliquid phase on the surface where the bubbles explode. In addition, the bubbles explosion under the aspirin foam, also may affect the frequency distribution amplitude as discussed in Figure 2f. From a closer look to Figure 4, a somewhat higher dispersion of the energy data is realized after 100s of reaction. During that time period, fully developed foam of around three millimetres thick was observed and at the same time the bubbling process started to diminishes. This combined effect produces a slight variability in the measured values of signal amplitude and energy. Comparing the variability coefficient of SS and E0 for water and acid in Table 2, the same conclusion can be deducted. For an equal tablet size (25x5 mm) AZ-Extra presents 175 mg and 69 mg more of aspirin and bicarbonate respectively than for AZ-Original. Thus the effect of the ashes is more significant in that case as is shown in the simplified scheme of the AZ-Extra reacting with the lactic acid solution in Figure 6a, 6b, 6c. The amount of produced aspirin ashes is higher for AZ-Extra than AZ-Original (Figures 5f and 6c).
Again, smaller bubbles dominate the bubbles size distribution in Figure 6a and the formed foam is even thicker than in the case of AZ-Original Figure 6b. For AZ-Extra reaction in lactic acid, other phenomenon was observed. In the majority of the experiments the tablet is fractured into bubbling pieces in a sort of ash-blocks disseminated on the liquid surface slightly floating as part of the foam (Figure 6b).
Perhaps, these ash-blocks are formed by a preferential site of reaction in the tablet body where the liquid can make a kind of cavity which offers an easier way of access for the reactant to the inner part of the tablet, thus creating a weak point in the tablet structure which finally enters in a zone of fracture under the erosive effect of the bubbles dragging force. Since the bubbling ash- blocks float, they are not in contact with the acid in an effective way, thus increasing the time required to reach the complete reaction stage (tablet degradation) but also leading to more variable results than in contrast to AZ-Original with lactic acid mainly in the final stage of the reaction.
The increment in the variability for AZ-Extra in contact with lactic acid can be observed by direct comparing the signal envelopes depicted in Figure 7. The variability of the signal envelopes for AZOriginal and AZ-Extra is comparable before 200s, after this time, a higher dispersion in the envelopes profiles described by AZ-Extra (tail of the curves) is found by the acoustic method.
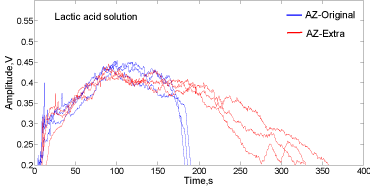
    Figure 7: Signal envelopes for Alka-Seltzer Extra (red) and Original (blue) in
contact with 35mL of lactic acid solution (1.63mol/L).
In the case of the reaction in water for both types of tablet presented in Figure8, a rather higher dispersion in the AZ-Extra envelopes trajectories is also observed. However, for the AZ-Extra, the water offers more reproducible results than using lactic acid solution.
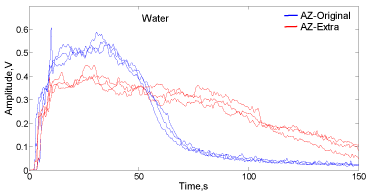
    Figure 8: Signal envelopes for Alka-Seltzer Extra (red) and Original (blue) in
contact with 35mL of water.
According to the correlation between the reaction system features and the acoustic emission profile of the signal, the typical characteristics and features of the Alka-Seltzer sound depends on the combined effect of the whole reaction mechanism. If just one of the components of the system changes (in nature and/or in amount), the acoustic signal properties will change as a finger print of a specific reaction mechanism process and thus gives extra information dealing with typical chemical differences between the tablets.
Table 4 depicts the integrated area under the envelope curves (SS) and cumulative energy (E0) for AZ-Extra in contact with water and lactic acid solution. Comparing the values of the variability coefficients for AZ-Original (Table 2) and AZ-Extra (Table 4), a lower dispersion of the experimental results for SS and E0were found for the AZ-Original.
    AZ-Extra


    Water
    Lactic acid    solution


    #
    Mass (g)
    SS (Vs)
    E0 (V2/s)
    Mass (g)
    SS (Vs)
    E0 (V2/s)


    1
    3.51
    32.61
    9.63
    3.51
    131.48
    20.76


    2
    3.52
    30.64
    10.55
    3.5
    111.11
    18.95


    3
    3.51
    31.11
    9.9
    3.51
    146.56
    22.68


    4
    3.51
    31.91
    9.22
    3.52
    122.59
    19.42


    5
    3.52
    30.73
    10.1
    3.51
    110.17
    17.61


    3.514
    31.4
    9.88
    3.51
    124.38
    19.88


    s(x)
    0.01
    2.83
    0.5
    0.01
    15.19
    1.93


    VC (%)
    0.15
    9.03
    5.06
    0.2
    12.21
    9.73


    Averaged value , s(x): Standard deviation, VC:    Variability coefficient, Normal distribution of the data was confirmed.
Table 4: Experimental data for AZ-Extra reacting with water and lactic acid
solution: (integrated area under the signal envelope curve (SS) and cumulative
energy of the signal (E0)).
In addition, the highest dispersion in measured SS and E0 values were observed when AZ-Extra was tested using lactic acid, thus complementing the results discussed in Figures 7 and 8. Differences in dispersion of the experimental results for AZ-Extra can be detected also when comparing the cumulative energy curves using water and lactic acid (Figure 9) confirming that the highest dispersion is for AZExtra tablet-acid pair.
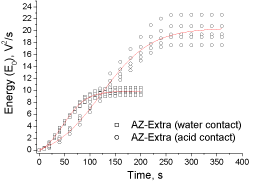
    Figure 9: Experimental and fitted data of cumulative energy (E0) for the
experiments using water and lactic acid (AZ-Extra).
The shape of the cumulative energy curves found for AZ-Extra presented in Figure 9 are very similar to the AZ-Original (Figure 4). Again and based on the data fitting parameters presented in Table 5, the Boltzmann’s model can appropriately describe the experimental E0 data. However, the regression coefficients are a little bit lower than the AZ-Original as evidenced from the dispersive effect produced by the specific mechanism characteristics for the composition of AZExtra in contact with acid. The aspirin ashes and its amount modify the acoustic pattern obtained.
    Model: Boltzmann
    AZ-Extra


    Parameter
    Water
    Lactic acid    solution


    A1
    -1.29 (+/- 0.31)
    -1.59 (+/- 0.89)


    A2
    9.90 (+/- 0.07)
    20.48 (+/- 0.35)


    x0
    47.83 (+/-    1.63)
    122.70 (+/-    5.14)


    dx
    22.42 (+/-    1.13)
    48.68 (+/-    4.51)


    R2
    0.989
    0.969
Table 5: Parameters and characteristics of experimental cumulative energy data
fitted at the Boltzmann model for AZ-Extra reacting with water and lactic acid.
Based on acoustic measurement comparing the fitting parameters presented in Table 5, differences in the reaction mechanisms during the tablet degradation in water and lactic acid can induce as discussed in Figure 4 and Table 3.
In order to determine the reactive NaHCO3 content in the Alka- Seltzer tablets, calibration curves using powdered bicarbonate were conceived. Figure10 displays the envelope curves for the acoustic signal of sodium bicarbonate in contact with the lactic acid solution (35mL) under the same experimental conditions performed with the Alka-Seltzer tablets.
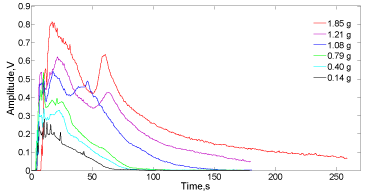
    Figure 10: Signal envelopes of the bubbling sound produced by different
amounts of NaHCO3 in contact with 35mL of lactic acid solution (1.63molL-1.).
In this case, powdered bicarbonate produces a different sound pattern from the experiments performed with Alka-Seltzer. A highest and sudden initial peak of signal amplitude features the NaHCO3 and lactic acid reacting system, which is due to a massive acid-base reaction between the powdered bicarbonate (different from the tablets which is similar to pellets) and the lactic acid. The amplitude of this initial peak depends on the amount of reacting bicarbonate (about 0.25V for 0.14g and 0.82V for 1.85g). However, after this initial peak the signal envelope shape also behaves according to the weight of NaHCO3 applied. At lower mass of bicarbonate (0.14 to 0.4 mg), the initial peak can be partially detected into a broader zone of variable amplitude followed by a descending trajectory of the signal amplitude as the bicarbonate is consumed and the bubbles production diminishes. At higher content of bicarbonate in the reacting system, the initial amplitude peak is clearer observed with a rapid decreasing period of high slope followed by a second peak lower in amplitude. After this second peak, a constant descending trajectory is observed, being eventually asymptotical as the CO2 production finishes. This doublepeak behavior at high mass of NaHCO3 can be explained based on the dynamics of the reaction itself. The lactic acid initially reacts with the solid bicarbonate producing preferably sodium lactate, CO2 and water.
This initial and massive acid-base contact generates a significant amount of water which diminishes the lactic acid concentration in the vicinity of the bicarbonate, therefore the production of CO2 decays. Then, the diffusion process increases again, the acid concentration produces a second moment of high amplitude and finishing in a descending process of neutralization.
Figure 11 presents the cumulative energy curves obtained for different NaHCO3 amounts reacting with lactic acid solution. Although the envelope curves of Alka-Seltzer tablets and powdered bicarbonate are quite different in shape, the characteristics of the cumulative energy curves are quite similar, mainly at low mass of reacting bicarbonate. This suggests the suitability of the cumulative energy of the signal as more representative parameter of the acidbase reaction process instead of the signal envelope which is more dependent on the reacting system characteristics.
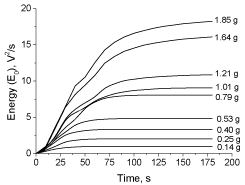
    Figure 11: Experimental data of cumulative energy (E0) at different amounts
of powdered bicarbonate reacting with lactic acid solution (35mL/ 1.63molL-1).
Figure 12 (a) and (b) display the calibration curves SS and E0 vs mass of NaHCO3 respectively. Good linear correlations were obtained and the correlation parameters are presented on the figure. According to the results, the integral area under the signal envelope (SS) and the cumulative energy of the acoustic signal HP-filtered (0.8- 25kHz) produced in the bicarbonate-lactic acid reaction signal can be considered as directly proportional to the reacting NaHCO3 content related to the mass of sample which in turn is proportional to the amount of produced CO2 .
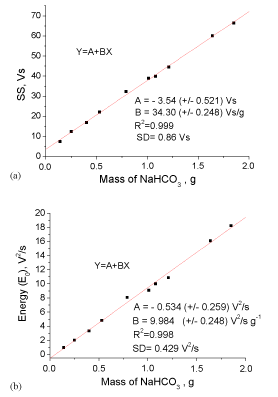
    Figure 12: Acoustic calibration curves in terms of integrated area under the
envelope curve (a) and cumulative energy of the signal (b) using powdered
bicarbonate. SD = standard deviation of the linear model.
Using the linear models based on the acoustic measurements (depicted in Figure 12) and the averaged values obtained (x)of SS and E0 from Tables 2 and 4the content of bicarbonate in the Alka- Seltzer tablets AZ-Original and AZ-Extra was assessed using the acid lactic solution. Results are presented in Table 6.
    Acoustic    signal parameter
    NaHCO3 content    in the tablet (g)


    AZ-Original
    AZ-Extra


    Integral area    of the envelope curve (SS)
    2.12 (+/- 0.1    g)
    3.73 (+/- 0.5    g)


    Cumulative    energy of the signal (E0)
    1.92 (+/- 0.1    g)
    2.05 (+/- 0.2    g)
Table 6: Results of acoustic determination of the reacting NaHCO3 content in the
Alka-Seltzer tablets in contact with lactic acid in terms of SS and E0.
According to results presented in Table 6,more reliable results were found using the cummulative energy of the acoustic signal. Based on E0, the sodium bicarbonate content determined by the acoustic method is within the range of the value reported by the manufacturer in the explored Alka-Seltzer tablets. In contrast, using the integrated area of the envelope curve as parameter of estimation, acceptable results were found only for the AZ-Original, but an incorrect value was obtained for NaHCO3 content in AZ-Extra. This significant error in the case of AZ-Extra, using SS as parameter, can be attributed to the typical characteristics of the composition of the tablet (Figure 6) having (in this case) a higher acetylsalicylic acid content resulting in more aspirin ashes, and thus thicker foam formation and bubbling leads to a greater deviation in the acoustic measurement, mainly affecting the behavior of the signal envelope and thus its integral area. Using the water flooding experiments for AZ-Original only 0.85 (+/- 0.1g) of NaHCO3 is found and in the case of AZ-Extra, only 1.04 (+/- 0.1g) of bicarbonate could be registered, which is too low according the given amount defined by the producer and in accordance with the too low amount of acids in the tablets present to neutralize the bicarbonate completely.
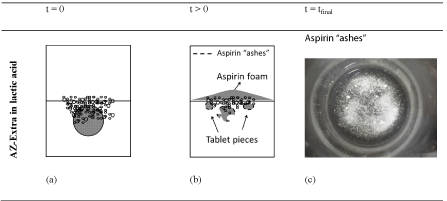
    Figure 6: Simplified scheme of the AZ-Extra reacting in water and with the
lactic acid solution at different reaction stages.
Conclusions
It can be stated that the acoustic technique based on signal processing of the effervescency sound produced by Alka-Seltzer flooded with water or a dedicated acid can be a sensitive method for determining the reacting bicarbonate content in the tablet using an acoustic calibration curve from a bicarbonate-acid reacting system.
It is demonstrated that the integral area under the sound signal envelope curve (SS) in the time domain and the cumulative energy of the Alka-Seltzer sound obtained by HP filtering within the frequency range (0.8-25 kHz) can be satisfactory (linear) correlated with the CO2 production from an specific acid-base reaction system.
According to the correlation between the explored reaction system features and the acoustic emission parameters of the acoustic signal, it was found that the typical characteristics of the Alka-Seltzer sound will depend on the combined effect of the whole reaction system. If one of the parameters of the system changes, the acoustic signal properties will change as a finger print of a specific composition and thus resulting reaction mechanism, as is clearly demonstrated by the two different researched tablets.
The cumulative energy is a more reliable acoustic parameter to determine the bicarbonate content in Alka-Seltzer tablets due to its less dependency of changes in the reaction mechanism.
The simplicity and advantages of the acoustic emission method can be very interesting as a fast complementary analytical method to assess the content of base or acidic compounds in different materials and products by analyzing the typical bubbling sound produced by a gas formation during the neutralization reactions.
Nevertheless, further studies on the proposed acoustic method have to be addressed in order to optimize the experimental conditions with a more suitable and general reacting system in order to tackle the observed inconveniences in the experiments for the improvement of the current results.
Acknowledgements
The authors would like to thank VLIR-UOS (Flemish Interuniversity Council for University Development Cooperation) project between Belgium and Cuba for providing funding and granting the support of the current and future studies.
References
- Yueh-Huey Chen, Jing-Fun Yaung, Alka-Seltzer Fizzing. Determination of Percent by Mass of NaHCO3 in Alka-Seltzer Tablets. Journal of Chemical Education. 2002; 79: 848–850.
- Roser CE, McCluskey CLJ. Pressure and Stoichiometry. Chem. Educ. 1999; 76: 638. 8.
- Dudek EJ. A carbonate project introducing students to the chemistry lab. Chem. Educ. 1991; 68: 948.
- Peck L, Irgolic K, O’Connor RJ. Bicarbonate in Alka-Seltzer: A general chemistry experiment. Chem. Educ. 1980; 57: 517.
- H Crespo Sariol, J Yperman, A Brito Sauvanell, R Carleer, J Navarro Campa and G Gryglewicz. A novel acoustic approach for the characterization of granular activated carbons used in the rum production. Ultrasonic. 2016; 70: 53-63.
- Crespo Sariol H, Mari&nTilde;o Peacok T, Yperman J, Sánchez Roca A, Carvajal Fals H, Brito Sauvanell A, et al. Comparative study between acoustic emission analysis and immersion bubble-metric technique, TGA and TD-GC/ MS in view of the characterization of granular activated carbons used in the rum production. Beverages. 2017; 3: 1-21.
- Crespo Sariol H, Mari&nTilde;o Peacok T, Yperman J, Leyssens K, Meynen V, Sanchez Roca A, et al. Characterization of Thermally Regenerated Activated Carbons Used in Rum Production by Acoustic Emission Analysis, N2 and Ar Gas Adsorption. J. Adv. Chem. Eng. 2017; 7: 176.
- Z Travnicek, AI Fedorchenkon, M Pavelka, J Hruby. Visualization of the hot chocolate sound effect by spectrograms, Institute of Thermomechanics, v.v.i., Academy of Sciences of the Czech Republic, Prague 8, Czech Republic. Journal of Sound and Vibration. 2012; 331: 5387–5392.
- EJ Macías, AS Roca, HC Fals, JCS Muro and JB Fernández. Characterisation of friction stir spot welding process based on envelope analysis of vibroacoustical signals. Sci. Technol. Weld. Join. 2015; 20: 172–180.
- M Tabacchi, C Asensio, I Pavón, M Recuero, J Mir, MC Artal. A statistical pattern recognition approach for the classification of cooking stages. The boiling water. Applied Acoustics. 2013; 74: 1022–1032.
- M Cudina, J Prezelj. Detection of cavitation in operation of kinetic pumps. Use of discrete frequency tone in audible spectra. Applied Acoustics. 2009; 70: 540–546.
- Alan V. Oppenheim and Ronald W. Schafer, Discrete-Time Signal Processing 2nd Edition (Prentice Hall: Upper Saddle River, NJ, 1999) p 60.
- William Mc C. Siebert, Circuits, Signals, and Systems (MIT Press: Cambridge, MA, 1986), pp. 410-411.
- Minnaert M. On musical air-bubbles and sounds of running water. Philosophical Magazine. 1933; 16: 235–248.
- Vazquez, R Manasseh, RM Sáncheza, G Metcalfeb. Experimental comparison between acoustic and pressure signals from a bubbling flow. Chemical Engineering Science. 2008; 63: 5860-5869.
- Leighton TG, Walton AJ. An experimental study of the sound emitted from gas bubbles in a liquid. Eur. J. Phys. 1987; 8: 98104.
- Ucke C, Schlichting HJ. “Why does champagne bubble?”, Physics and Technology Quest Journal. 1997; 2: 105-108.