
Research Article
Austin J Anal Pharm Chem. 2018; 5(4): 1110.
Energy Consumed During Oxidative Degradation of Vitamin-C Tablets
Ahmed SM1 and Shahata MM2*
1Chemistry Department Faculty of Science, Assiut University, Assiut, 71517, Egypt
2Environmental Affairs Department, Assiut University Hospitals, Assiut, 71517, Egypt
*Corresponding author: Mohamed M Shahata, Environmental Affairs Department, Assiut University Hospitals, Assiut, 71517, Egypt
Received: October 09, 2018; Accepted: November 09, 2018 Published: November 16, 2018
Abstract
The oxidation time based on the fitting of experimental data was taken out. Drawing of the Absorbance (λmax=265nm) vs. oxidation time (sec) of Vitacid C by K2CrO4 were studied. Energy consumed during oxidative degradation of vitamin-C (Vit-C) Tablets in aqueous potassium chromate (K2CrO4) medium was studied spectrophometrically at 25oC. The reduction of the absorbance at ~265nm with increasing time was scanned. A good linearity (R-square ≥ 0.99). The slope (EC/ppm) vs reductant (Vit-C/ppm) at constant oxidant is about 1.218, while, the slope of EC vs. oxidant (K2CrO4/ppm) is about 3.653. Calculations suggest that the EC during reduction of Cr (VI) to Cr (VI) is about three times of magnitude faster than the oxidation of the Vit - C sample.
Keywords: Ascorbic acid (H2A); Hexacyanoferrate (III); Kinetics; Oxidation; Mechanism
Introduction
Ascorbic acid is a white crystalline and odorless substance. Due to its polar characteristics, it is easily soluble in water and its solubility in nonaqueous media, such as ethanol and acetonitrile, is quite limited. The crystalline and pure ascorbic acid is stable when exposed to air, light, and ambient temperature for a long period [1]. Vitamin C is the generic kind of all compounds exhibiting qualitatively the biological activity of ascorbic acid. It suffices as a water-soluble antioxidant by reacting with free radicals and reducing reactive oxygen species to protect against the oxidation of lipids, proteins, and DNA [2]. The non-isothermal aerobic degradation of ascorbic acid (AA), and the organization and subsequent degradation of the dehydroascorbic acid (DHAA) are distinguished by two simultaneous rate equations. Also accepted is that the temperature-dependence of these three reactions' rate-constants follows the exponential model, a simpler substitute for the traditional Arrhenius equation [3]. Vitamin C and its degradation products participate in chemical modifications of proteins in vivo through non-enzymatic glycation (Maillard reaction) and formation of different products called advanced glycation end products. The identification of 3-deoxythreosone as the major degradation product bound to human lens proteins provides in vivo evidence for the non-oxidative pathway of dehydroascorbate degradation into erythrulose as a major pathway for vitamin C degradation in vivo [4]. Matei et al. [5] determinate the rate constant, the half-time and the activation energy for vitamin C. It can take note that the rate constants depend strongly on temperature, typically increasing rapidly with increasing T. It can take note that the values of the activation energy, analytical and graphical determined are in good agreement. The dynamics of vitamin C have been examined extensively in model systems with exceptional care to intermediate moisture foods and during storage studies. Hence, it is necessary to study the subject of different processing temperatures on the retention of vitamin C in the product and kinetic modeling to anticipate the losses during processing by different heating methods [6]. Cyclic Voltammetry was used to examine the kinetics of degradation of ascorbic acid (AA) at different temperatures. It has been shown that the reduction of the concentration of AA in all temperatures follows the dynamics of the first order reaction. The kinetics of degradation of vitamin C were also studied using titrimetric and spectrophotometric methods [7]. The decision of the dynamics of the oxidation of ascorbic acid applies the integral and half-change time methods, while the compactness of the remained ascorbic acid in sixty minute intervals is determined by iodimetric titration method. Pre-exponential factor or the frequency of collisions is a factor which is a quantity of the collision rate. The activation energy and the pre-exponential factor for the oxidation of ascorbic acid were calculated [8]. In parliamentary law to compare the data published, the rate constants of degradation have been estimated assuming the first-order kinetics of degradation [9]. It has been established that temperature, the form of vitamin and the matrix are the factors affecting most the stability of vitamin C in foods and drinks. Lower storage temperature brings about a higher retention of vitamin C. The matrix also affects the rate constants of degradation. For liquid matrices and for comparable temperatures, the rate constants are much higher for the degradation in milk that in fruit juices and drinks. Equally for the solid matrices, the rate constants of vitamin C degradation in bread are from 2–3 orders of magnitude higher than those for the bran flakes, grains, dried apple chips and potato chips. Lanny et al. [10] study the kinetics of degradation of vitamin C in fresh strawberry juices upon storage and to investigate the result of storage temperatures and sugar added to the ascorbic acid loss in strawberry juices. The results showed that the degradation reaction of vitamin C followed zero-order kinetic models in all types of juices. The activation energy for the vitamin C degradation in fresh strawberry juices with sugar and without the sugar addition was estimated to be 1.90kcal/mol and 1.65kcal/mol, respectively. The degradation kinetics of vitamin C and colour in terms of a reaction rate constant, destruction kinetics, enthalpy and entropy for different methods of heating discussed [11]. The destruction of vitamin C was influenced by the method of heating and the temperature of processing. The degradation was highest during microwave heating due to uncontrolled temperature generated during processing. The visual color is generally used an index of the carotenoid content. The activation energies for both vitamin and color were within the range of literature reported values of 7.54–125.6 KJ/Mol. The rate of vitamin C degradation in the Lettuce and Cabbage samples under the same processing method was investigated [12]. The rate of degradation is dependent on the concentration of the vitamin C present in both vegetables. This impresses the fact that the blanching of Cabbage at 700C of water is more preferable in terms of vitamin C retention than Lettuce, hence, is recommended for food supplement Industries to deploy this research findings for further processing into semi and finished products after dehydration because degradation of vitamin C during processing might be a critical factor for the shelf life of some products such nutrient concentrates, since vitamin C content of fruits undergoes destruction during processing and storage.
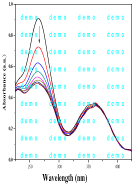
Figure 1a: Absorption spectra of Vit-C in the presence of oxidant (K2CrO4).
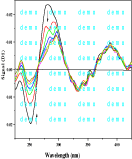
Figure 1b: Firest drevative of 1a.
Materials and Methods
Solutions and chemicals
Vitacid C (Vit-C) Tablets was purchased for Chemical Industries Development (CID), Giza-Egypt-G. C. R. 19717. Stock solutions of Vit-C and potassium chromate (K2CrO4) Aldrich, Milwaukee, WI) were set up by dissolving a single tablet or appropriate amount of the respective samples in double distilled water. L-Ascorbic acid (L-Asc) was purchased from Merck, Germany. Solutions of H3PO4, NaH2PO4, Na2HPO4, and Na3PO4) were used for preparation of buffer media. All other reagents used were of analytical grade.
Instrumentation
Thermo Electron-Vision pro Software V 4.10 UV/Vis spectrophotometer (190–1100 nm) with 1.0cm quartz cell (scan speed, H3PO4, 8.0nms-1) was used for spectrophotometric measurements.
Procedure
Ten milliliters of 1.0mmolL-1 solution of K2CrO4 (oxidant) in strong acid was placed in into a calibrated flask. The background spectrogram of this solution was recorded. Then, different amounts of the analyte (Vitacid C Tablet, Vit-C) were added into individual flasks by means of a micropipette (Waco, UK). All presented absorption spectra are corrected for the blank reagent, which was made in a similar way as the samples, all the same, not containing the analyte. All measurements were carried out at room temperature (21±10C).
Method of calculations
MM+ calculations, including MM2 and MMP2 force field [13-15] were carried out assuming the investigated molecule in the gas phase. The values of potential and geometric energies as well as the dipole moment were obtained considering dPE ¼ 0.42J and the normal method. The search for a minimum energy of the molecule geometry resulted in a 3D structure. MM+ calculations iteratively change the location of particles towards the structure characterized by lower energy until the molecular internal energy has been down played. The potential energy of a molecular system is a function of the atomic coordinates [13-15]:
Estr is the bond stretch, Eang is the bond angle bend; Estb is the stretch-bend, Eoop is the out-of-plane, Etor is the torsion, Evdw is the van der Waals force, Eele is electrostatic, Esol is the implicit solution, Eres is restraint energy, and Xj þ is the electro negativity of the positive ion of atom.
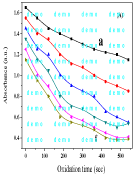
Figure 2: Computer drawing of the Absorbance (A) (λmax=265nm) vs. oxidation time (sec) of Vitacid C (0.5mmoL/L) by K2 CrO4.
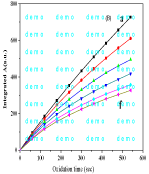
Figure 3: Computer drawing of the integrated A (λmax=265nm) vs. oxidation time (sec) of Vitacid C (0.5mmoL/L) by K2 CrO4.
Results and Discussions
Oxidative degradation mechanism of Vit-C by K2CrO4
The absorption spectra of Vit-C (Vitacid concentration: 16.8x10⁻⁵ molL-1) after different addition of K2CrO4 (2x10⁻⁵ molL-1) were studied (Time effect, t=1min) as shown in Figure 1a.The decreases of the absorbance rapidly with increasing the concentration of K2CrO4 could be attributed to the oxidative degradation of Vit-C according to the following mechanism:
3[C6H8O6 + 6H2O ® 6CO2 + 20H+ + 20e- (11)
20[K2CrO4 + H2O + 3H+ + 3 e- ® 2KOH + Cr(OH)3] (12)
20K2CrO4 + 3C6H8O6 + 38H2O « 40KOH + 20Cr(OH)3 + 18CO2 (13)
The maximum was shifted to higher wavelength (λmax ≈ 285 nm) via the firest derivative (D1). This shift indicates that the higher derivative is more sensitive than D0 derivative (normal spectra) as shown in Figure 1b.
Oxidation time of Vit-C in aqueous media
The oxidation time based on the fitting of experimental data obtained. For example, when oxidative degradation of Vit-C (0.5mmol L-1) by KMnO4 (0.05, 0.1, 0.15, 0.2, 0.25 and 0.3 mmolL-1) was carried out. Computer drawing of the Absorbance (A: a-f) (λmax=265nm) vs. oxidation time (sec) of Vitacid C by K2CrO4 as shown in Figure 2. Reaction rate constant (k¼) 2.207 x 10⁻⁴s-1 was computed and the values of statistical parameters r¼ 0.989 and RSD¼, 2.23x10⁻⁴ were obtained. While, Computer drawing of the integrated A (λmax=265nm) vs. oxidation time (sec) of Vitacid C by K2CrO4 is shown in Figure 3. The limit of detection can be as low as 18ppm (mgL-1) of Vit-C, suggesting the possible application of this procedure for the determination of Vit-C in real samples.
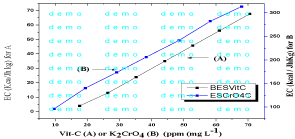
Figure 4: Variation of Energy consumed (EC) vs. Vit-C (ppm) for A, and K2CrO4 (ppm) for B.
Vit-C (ppm)


17.62


26.41


35.2


44.1


52.8


61.1


70.48


E.C (kcal kg-1 h)


4.016


12.92


23.86


34.92


45.74


56.06


67.72


K2CrO4 (ppm)


9.71


19.42


29.13


38.34


48.56


58.26


67.97


E.C (kcal Kg-1 h)


96.21


140.07


173.37


206.06


241.69


282.13


313.02
Table 1: Variation of Energy consumed (EC) during oxidation of Vit-C or K2CrO4.
K2CrO4 -Matrix


Slope (kcal kg-1 h ppm-1)


Correlation coefficient-R-Square


Standard Error(RSD)


EC vs. Vit-C


1.21872


0.9991


0.01424


EC vs. K2CrO4


3.69107


0.9983


0.06173
Table 2: Calibration plot data of the variation EC during oxidation of Vit-C or K2CrO4 –Matrix.
Energy consumed (EC) of Vit-C in aqueous medium
The fundamental property of an electrically activated chromogenic material is that it exhibits a large change in optical properties upon a change in either electrical field, injected or ejected charge. The increases of EC with increasing of Vit-C at constant oxidant (K2CrO4) or at constant Vit-C with increasing K2CrO4 were recorded as seen in Table 1.
A good linearity (R-square ≥ 0.99) as shown in Figure 4. The slope (EC/ppm) vs reductant (Vit-C/ppm) at constant oxidant is about 1.218, while, the slope of EC vs. oxidant (K2CrO4/ppm) is about 3.653 (Table 2). These calculations indicate that the EC during reduction of Cr(VI) to Cr(VI) is about three times of magnitude faster than the oxidation of Vit-C sample.
Conclusions
Computer drawing of the Absorbance (λmax=265nm) vs. oxidation time (sec) of Vitacid C by K2CrO4 was computed. Energy consumed during oxidative degradation of vitamin-C (Vit-C) in aqueous potassium chromate (K2CrO4) medium has been studied spectrophometrically and computationally. The decrease of the absorbance at ~265nm with increasing time was scanned. A good linearity (R-square ≥ 0.99). The slope (EC/ppm) vs reductant (Vit-C/ppm) at constant oxidant is about 1.218, while, the slope of EC vs. oxidant (K2CrO4/ppm) is about 3.653. Calculations indicate that the EC during reduction of Cr(VI) to Cr(VI) is about three times of magnitude faster than the oxidation of Vit-C sample.
References
- Santos PHS and Silva MA. Retention of vitamin C in drying processes of fruits and vegetables-A review. Drying Technology. 2008; 26: 1421-1437.
- Gerald F Combs Jr and James P McClung. The Vitamins (Fifth Edition) Fundamental Aspects in Nutrition and Health. 2017; 267–295.
- Micha Peleg. Theoretical study of aerobic vitamin C loss kinetics during commercial heat preservation and storage. Food Research International. 2017; 102: 246-255.
- Ina Nemet and Vincent M Monnier. Vitamin C Degradation Products and Pathways in the Human Lens. The journal of biological chemistry. 2011; 286: 37128–37136.
- N Matei, S Birghil, V Popescu, S Dobrinas, A Soceanu, C Oprea, et al. Kinetic study of vitamiv C degradation from pharmaceutical product. Rom. Journ. Phys. 2008; 53: 343–351.
- Ahmed J, Kaur A & Shivhare US. Color degradation kinetics of spinach, mustard and mixed puree. Journal of Food Science. 2002; 67: 1088–1091.
- Veselinka V Grudic, Nada Z Blagojevic, Vesna L Vukasinovic, Pesic Snezana R Brašanac. Kienetics of degradation of ascorbic acid by cyclic voltammetry method. Chem. Ind. Chem. Eng. Q. 2015; 21: 351−357.
- Sitti Rahmawati and Bunbun Bundjali. Kinetics of the oxidation of vitamin C. Indo. J. Chem. 2012; 12: 291-296.
- Andrea Steškova, Monika Morochovicova, Emilia Lesckova. Vitamin C degradation during storage of fortified foods. Journal of Food and Nutrition Research. 2006; 45: 55-61.
- Lanny Sapeia, and Lie Hwaa. Study on the Kinetics of Vitamin C Degradation in Fresh Strawberry Juices. Procedia Chemistry. 2014; 9: 62-68.
- VB Vikram, MN Ramesh, SG Prapulla. Thermal degradation kinetics of nutrients in orange juice heated by electromagnetic and conventional methods. Journal of Food Engineering. 2005; 69: 31–40.
- Awagu EF, EKANEM EO, Kolo AM, Adamu MM. Kinetic Modeling of Vitamin C (Ascorbic Acid) Degradation in Blanched Commonly Consumed Salad Vegetables Using Computer Simulation Analysis. IOSR Journal of Applied Chemistry (IOSR-JAC). 2017; 10: 59-66.
- Alexander D Mackerell Jr, Michael Feig, Charles L Brooks. Extending the treatment of backbone energetics in protein force fields: Limitations of gas-phase quantum mechanics in reproducing protein conformational distributions in molecular dynamics simulations. J. Comput. Chem. 2004; 25: 1400–1415.
- Michal Wojciechowski and Bogdan Lesyng. Generalized Born Model: Analysis, Refinement, and Applications to Proteins. J. Phys. Chem. B. 2004; 108: 18368–18376.
- Jay W Ponder and David A Case. Force Fields for Protein Simulations. Advances in Protein Chemistry journal. 2003; 66: 27-85.