
Research Article
Austin J Anal Pharm Chem. 2019; 6(3): 1123.
A Newer RP - HPLC Stability Indicating Method Development and Validation of Darunavir in its Bulk and Formulation
Marri Laxman Reddy Institute of pharmacy, Dundigal, Medchal, Hyderabad, Telangana, India, 500043
*Corresponding author: Nalini Kanta Sahoo, Professor & H.O.D, Department of PA & QA, MLR Institute of Pharmacy, India
Received: October 14, 2019; Accepted: November 07, 2019; Published: November 14, 2019
Abstract
The present paper deals with the development of a stability indicating reverse phase HPLC with UV-Visible detector method for the determination of Darunavir using phenomenx RP-C18 (250x4.6 mm, packed with Luna 5µ) column. A mobile phase consisting of Acetonitrile: methanol: water (60:30:10%v/v/v) was employed in this study. The flow rate was kept at 1.0ml/min and the injection volume was 20µl. The separation was performed at ambient temperature. Eluents were monitored by UV detector set at 270nm. The developed method was statistically validated for the linearity, precision, accuracy, robustness, specificity, LOD and LOQ. The specificity of the method was ascertained by force degradation studies by acid hydrolysis, alkali hydrolysis & degradation by oxidation. The degraded products were well resolved from the analyte peak with significant difference in their RT values.
Keywords: RP-HPLC; Darunavir; Forced degradation
Introduction
The quantitative test methods which detect the changes with time in the properties of drug products & drug substances are known as Stability indicating methods. A stability indicating analytical method (SIAM) can be defined as validated analytical procedure which accurately & precisely measures active ingredients (drug substance) free from potential interferences excipients, impurities, degradation products, or other potential impurities and all assay procedures for stability studies be stability indicating is recommended by FDA [1].
The degradation of drug substances or drug products at different conditions more severe than the accelerated conditions is known as Forced degradation [2]. This generates degradation products which can be studied to determine the stability of the molecule [3].
The International Conference on Harmonization (ICH) drug stability test guideline Q1A (R2) requires that through the use of validated stability-indicating analytical methods (SIAMs) [1] the analysis of stability samples should be done.
The ICH guidelines that are applicable to forced degradation studies are:
- ICH Q1A – Stability Testing of New Drug Substances and Products.
- ICH Q1B – Photostability Testing of New Drug Substances and Products.
- ICH Q2B – Validation of Analytical Procedures: Methodology [2].
Darunavir[(3aS,4R,6aR)-2,3,3a,4,5,6a-hexahydrofuro[2,3-b]furan-4-yl]N-[(2S,3R)-4-[(4-aminophenyl)sulfonyl-(2-methylpropyl)amino]-3-hydroxy-1-phenylbutan-2-yl]carbamate (Figure 1) is an inhibitor of the human immunodeficiency virus (HIV) protease enzyme by forming an inhibitor-enzyme complex thereby preventing cleavage of the gag-pol polyproteins. Immature, non-infectious viral particles are subsequently produced. It is used to treat HIV, the virus that can cause acquired immunodeficiency syndrome (AIDS) [4].

Figure 1: Darunavir.
The present work is designed to develop a simple, precise and rapid analytical LC procedure, which would serve as stability indicting assay method for analysis of Darunavir API.
Materials and Methods
HPLC instrumentation & conditions
Quantitative HPLC was performed on a ion gradient HPLC with Cyber lab LC-100 HPLC, LC-P100 HPLC pumps, with a 20µl sample injection loop (manual), LC-UV100 UV Detector were used. The output signal was monitored and integrated using WS-100 Workstation Software. Phenomenex RP-C18 (250 x 4.6 mm, packed with Luna 5 micron) column was used for the separation.
Chemicals and reagents
Darunavir (API) was provided by Hetero Labs limited, Jeedimetla, Hyderabad, India. Methanol, acetonitrile & water of HPLC grade were purchased from Thermo Fisher Scientific India pvt Ltd., Mumbai, India. Hydrogen peroxide I.P (3%) Solution and commercial formulation of Darunavir (PREZISTA, Janseen–cilag Ltd) was purchased from local medicine store.
Standard & sample preparation
The preparation of standard & sample stock solutions were done by dissolving standard & sample in the mobile phase (60:30:10 v/v/v of acetonitrile, methanol& water) separately & diluting with the same mobile phase which is also used as solvent.
Forced degradation studies
Forced degradation studies includes subjecting the drug substance to various stress conditions to observe the extent of degradation and rate of degradation which is likely to occur in the course of storage and/or after administration to body. The degradation pathways studied are acid hydrolysis, basic hydrolysis, dry heat degradation, oxidative degradation & photolytic degradation.
Acid hydrolysis: Acid hydrolysis was done by adding accurately weighted 10mg of pure drug in to a clean & dry round bottomed flask. 50ml of freshly prepared 0.1N HCl was transferred to it & it was refluxed in a water bath for 4hrs by maintaining the temperature at 70°C. After reflux the solution was filtered with vacuum filtration. The refluxed drug sample was then neutralized using 2N NaOH solution & its final volume was made up to 100ml with the mobile phase to prepare 100ppm solution. The sample was then injected into the HPLC system against the blank of Acetonitrile: methanol: water (60:30:10%v/v/v).
Basic hydrolysis: To a clean & dry round bottomed flask accurately weighed 10mg of pure drug was transferred. 50ml of freshly prepared 0.1N NaOH was added to it & it was refluxed in a water bath for 4hrs by maintaining the temperature at 70°C.After reflux the solution was filtered with vacuum filtration. The refluxed drug sample was then neutralized using 2N HCl solution & its final volume was made up to 100ml with the mobile phase to prepare 100ppm solution. The sample was then injected into the HPLC system as above.
Oxidation with (3%) H2O2: To a clean and dry 100ml volumetric flask accurately weighed 10mg of pure drug was taken, to this 30ml of 3% H2O2 was added & was diluted with little amount of acetonitrile &kept as such for 24hrs in the dark, final volume was made up to 100ml using the mobile phase to get 100ppm solution. This sample was injected into HPLC system as above.
Dry heat degradation: Dry heat degradation was performed by taking some amount of pure drug in to a clean & dry petri plate covered with glass lid which was kept in Autoclave for a period of 72 hours at a temperature of 60°C. After 72 hours 10mg of weighed sample was withdrawn from the above sample in to a volumetric flask and volume was made up with the mobile phase and was injected in to the HPLC system as above.
Photolytic degradation: Photolytic degradation studies was carried out by taking 10mg of pure drug in to a clean & dry petri plate which is covered with a glass lid. This sample was exposed to UV light for 24 hours at 250 watt hours/square meter and after 24 hours the weighed sample was taken in to volumetric flask. Final volume was made up to 100ml with mobile phase. This sample solution was analyzed by injecting into HPLC system as above.
Method validation
Accuracy: Determination of accuracy was done by the standard addition method. Previously analyzed samples of Darunavir API were added with standard drug solutions and are analyzed by this method. For each concentration Recovery (%), RSD (%) and bias (%) were calculated.
Accuracy is reported as percentage bias, which is calculated from the expression
Precision: According to ICH guidelines, precision was determined as both repeatability & intermediate precision. Intraday variation was determined by repeatability of sample injection& measurement of inter day variation was determined by intermediate variation. To determine these, 2 concentrations (2 and 3 µg/ml) of the solutions of Darunavir API were used.
Robustness: According to ICH guidelines, robustness of an analytical procedure was defined as “a measure of its capacity to remain unaffected by small but deliberate variations in method parameters”. Mainly robustness is the method in which ability of the drug to remain unaffected by small changes in parameters like temperature, wave length of detection, pH of the mobile phase, % organic solvent strength and buffer concentration, flow rate etc. The evaluation of chromatographic characters & alteration of experimental conditions were performed to determine the robustness of a method. To determine the robustness of the method small changes in chromatographic conditions such as change in flow rate (±0.2ml/min), temperature (±20C), wavelength of detection (±2nm).
Limit of detection (LOD): The limit of detection (LOD) is the concentration that gives rise to the signal of instrument which is significantly different from the blank. For spectroscopic techniques or other methods that rely upon a calibration curve for quantitative measurements, the standard deviation of the intercept (Sa),which may be related to LOD & the slope of the calibration curve, b, by,
LOD = 3Sa/b
Limit of quantitation (LOQ): LOQ can be defined as the concentration which can be quantified reliably with a specified level of accuracy &precision. The concentration of analyte that would give a signal-to-noise ratio of 10 which represents LOQ.
LOQ = 10Sa/b
Where, Sa is the standard deviation of the peak area ratio of analyte to IS (5 injections) of the drugs and b is slope of the corresponding calibration curve.
Specificity: The determination of the specificity of the method can be done by exposing the drug sample to acidic (0.1N HCl), basic (0.1N NaOH), dry heat, photolysis and oxidizing (3% H2O2) stress conditions. The analyte peak of the resulting solutions were analyzed and evaluated for peak purity & resolution from the nearest eluting peak.
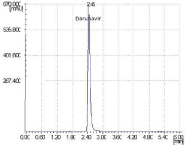
Figure 2: HPLC spectrum of Darunavir (100ppm, Rt 2.45min).
Results and Discussion
Optimization of chromatographic conditions
Optimization of chromatographic conditions can be done by the following as by using different means (different mobile phase, column, wavelength of detection, flow rate, & diluents for sample preparation etc.) these are summarized in Table 1 and Figure 2.
Forced degradation studies
The results of the forced degradation studies were given in Table 7 and 8 and Figures 3-7. In all the stress conditions, there is significant change in peak area but not in retention time of Darunavir API. Well separation of the degraded product from the parent peak in case of Acid degradation and basic degradation shows the method is stability indicating. In other degration conditions applied the API remains stable without any degradation.
Method validation
Accuracy: Recovery study: The recovery study can be determined by adding a previously analyzed test solution with that of additional drug standard solution, was 99.2-99.8%. This method can accurately indicated in the Table 5 in which the values of recovery (%) and RSD (%) were listed.
Precision: Intra-assay & inter-assay: In the Table 3 and 4 the high values of mean assay and low values of standard deviation & % RSD (% RSD < 2%) within a day (Inter day variation) and day to day variation (Intraday variation) for Darunavir revealed that the proposed method is precise.
Linearity & Range: In the range of 1-5µgm/ml linearity calibration curve which has the regression equation y = 41413x + 1982.7, showed good linearity for Darunavir API with correlation coefficient (R2) of 0.9996 (Figure 8) and Table 2.
Robustness: Robustness of Darunavir API was determined by studying the small changes in chromatographic conditions as change in flow rate (±0.1ml/min), Temperature (±20C), Wavelength of detection (±2nm) & water content in mobile phase (±2%) are given in the Table 6, %RSD < 2%.
LOD & LOQ: The LOD &LOQ at which the analyte can be detected at the minimum concentration were found to be 0.017 & 0.057 µg/ml respectively.
Specificity & stability in analytical solution: According to the United States Pharmacopoeia (USP) and International Conference on Harmonization (ICH) guidelines specificity was defined as the ability of an analytical method to assess unequivocally the analyte of interest in the presence of potential interferences [5-16]. In the presence of degraded sample the peak was pure which is the specificity results. Darunavir API was stable in solution form up to 24hrs at 250C.
The validation of the developed RP-HPLC method for analysis of Darunavir was established by the results of linearity, robustness, LOD, LOQ, specificity, precision, inter & intraday assays, robustness and stability in the analytical solution.
Assay: Commercial formulation of tablets was chosen for testing the suitability of the proposed method to estimate Darunavir in tablet formulations. Twenty tablets were weighed and powdered. An accurately weighed portion of this powder equivalent to 10mg of Darunavir was transferred into a 10mL volumetric flask and dissolved in 5mL of mobile phase. The contents of the flask were sonicated for 15min and a further 5mL of the diluent was added, the flask was shaken continuously for 15min to ensure complete solubility of the drug. The solution was filtered through a 0.45µm membrane filter. This solution containing 5µg/mL of Darunavir was injected into the column six times. The average peak area of the drug was computed from the chromatograms and the amount of the drug present in the tablet dosage form was calculated by using the regression equation obtained for the pure drug. The relevant results are furnished in Table 8.
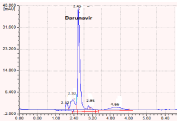
Figure 3: Chromatogram showing the acid degraded products.
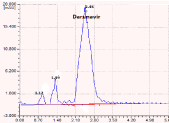
Figure 4: Chromatogram showing the base degraded products.
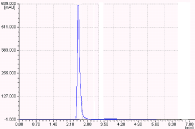
Figure 5: Chromatogram showing the photolytic degraded products.
Column Used


Mobile Phase


Flow Rate


Wave length


Observation


Result


Microbondapak C18, 5µm, 50x4.6 mm i.d.


Methanol only


0.5 ml/min


275nm


Low resolution


Method rejected


Phenomenex RP- C18, Luna 5µm,
250 x 4.6 mm i.d.


Methanol: water = 9:1


0.8ml/min


265 nm


Resolution but
not satisfied


Method rejected


Microbondapak C18, 5µm, 50x4.6 mm i.d.


Methanol : water = 75:25


1ml/min


272nm


Poor resolution


Method rejected


Phenomenex RP- C18, Luna 5µm,
250 x 4.6 mm i.d.


Methanol: Acetronitrile = 50:50


1ml/min


270nm


Poor resolution


Method rejected


Phenomenex RP- C18, Luna 5µm,
250 x 4.6 mm i.d.


Acetonitrile: Methanol: water= 60:30:10


1ml/min


270nm


Good resolution


Method accepted
Table 1: Summary of process optimization.
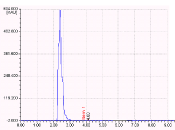
Figure 6: Chromatogram showing the dry heat degraded products.
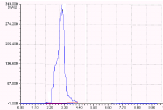
Figure 7: Chromatogram showing the oxidative degraded products.
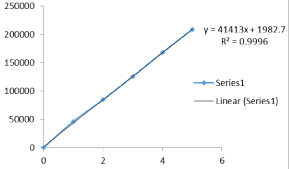
Figure 8: Calibration curve of Darunavir API.
    0
    0


    1
    46245.6


    2
    84542.6


    3
    125581


    4
    168223


    5
    208495
Table 2: Values for linearity.
Conc. Of Darunavir


%R S D


3µg/ml


9AM


12PM


3PM


0.0211


0.17


0.15


Overall %R S D


0.1137
Table 3: Results of intra-assay.
    Conc. Of Darunavir
    %R S D


    2µg/ml
    Day 1
    Day 2
    Day 3


    0.23667
    0.17
    0.23667


    Overall %R    S D
    0.212
Table 4: Results of inter-assay.
    Amount of drug added    (µg) to analyte
    Recovery from    Formulation


    Mean Amount (µg )    found (n=6)
    Mean % Recovery
    % RSD


    4
    3.99
    99.75%
    0.34


    5
    4.96
    99.20%
    0.221


    6
    5.99
    99.80%
    0.028
Table 5: Results of recovery study.
Change in parameter


% RSD (n=6)


Flow (0.8 ml/min)


0.079


Flow (1.2 ml/min)


0.54


Temperature (270C)


0.31


Temperature (230C)


0.4


Wavelength of Detection (263nm)


1.2


Wavelength of detection (267nm)


1.04
Table 6: Result of robustness test.
Stress conditions


Darunavir API


Degraded Product 1


Degraded Product 2


Degraded Product 3


Degraded Product 4


Degraded Product 5


Rt


Area


Rt


Area


Rt


Area


Rt


Area


Rt


Area


Rt


Area


0.1 N HCl


2.45


2.12


2.32


2.95


4.66


-


-


0.1N NaOH


3.85


2.25


2.72


-


-


-


-


-


-
Table 7: Peak results for forced degradation studies.
Brand name of tablet


Amount of Drug consider (mg)


Mean (±SD) amount (mg) found by the proposed method (n=6)


% Mean Assay


Daruvir 300


100


99.99+ 0.12


99.99
Table 8: Assay of Darunavir marketed formulation.
Conclusion
A sensitive & selective stability indicting RP-HPLC method has been developed & validated for the analysis of Darunavir. Based on peak purity results, obtained from the analysis of force degradation samples using described method, it can be concluded that the absence of co-eluting peak along with the main peak of Darunavir indicated that the developed method is specific for its estimation in presence of its degradation products. Further the proposed RP-HPLC method has excellent sensitivity, precision and reproducibility. Even though so many attempts have been made to identify the degraded products, proposed method can be used as a better stability indicating method for assay of Darunavir in commercial formulations.
Acknowledgements
The authors would like to acknowledge the contributions of Marri Laxman Reddy Institute of Pharmacy, Dundigal, Medchal, Hyderabad, Telangana, 500043, India for providing necessary facilities to carry out the research work.
Availability of data and materials
The data used in this study is presented in the main paper.
Authors’ contributions
- Rajitha contributed to the sampling preparation and validation of the method. N.K. Sahoo contributed by designing the whole work and developed the entire method. K.S. Muralikrishna contributed to the manuscript preparation. All authors read and approved the final manuscript.
Ethics approval and consent to participate
We hereby declare that there is no human participation or human tissues used in this study, and ethics approval and consent to participate are thus waived.
Consent for publication
We hereby declare that no individual person’s data is gathered or used in this study in any form, and thus, consent for publication is hereby waived.
References
- Importance of Stability Indicating Analytical Methods for Analyzing Organic Impurities in Active Pharmaceutical Ingredients. chapter -1, 1-20.
- Forced Degradation to Develop Stability-indicating Methods, Simon R. J. Hicks, Ph.D., 2.
- SS Quadri, LV Sonwane, B Poul, S Kamshette. Review on Stability Indicating Assay Methods (SIAMs). Pharma Tutor. 2014; 2: 16-31.
- Darunavir.
- The United State Pharmacopeia 25/National Formulary 20, ch. 1225,pg. 2256-2259 (The United State Pharmacopeial Convention, Inc., Rockville, Maryland, 2002).
- ICH, Q2B Validation of Analytical Procedure; Methodology (International Conferences on Harmonization of Technical requirements for the registration of Drugs for Human use, Geneva, Switzerland, May 1997).
- Hemant K. Jain. Development and validation of RP-HPLC method for estimation of darunavirethanolate in bulk and tablets. International Journal of Pharmacy and Pharmaceutical Sciences. 2015; 7: 1-4.
- Josilene Chaves Ruela Corrêa. Stability study of Darunavir Ethanolate Tablets Applying a New Stability-Indicating HPLC Method. Hindawi Publishing Corporation Chromatography Research International. 2013; 2013: 1-7.
- Nagaraju, et al. Development and validation of stability indicating RP-HPLC method for simultaneous estimation of darunavir and cobicistat in pharmaceutical dosage form. European Journal Of Pharmaceutical And Medical Research. 2016; 1-6.
- Deshpande, et al. Development and validation of stability- indicating HPTLC method for determination of darunavirethanolate and ritonavir. International Journal of Pharmacy and Pharmaceutical Sciences. 2015; 7: 1-6.
- B.V. Rami Reddy, et al. Stability-Indicating HPLC Method for the Determination of Darunavir Ethanolat. Journal of Chromatographic Science. 2012; 51: 471-476.
- S.H. Rizwan, et al. A New and Validated Stability Indicating RP-HPLC Analysis of Darunavir and Cobicistat in Bulk Drug and Tablet Dosage Form. Scholars Research Library. 2015; 8: 1-8.
- Patel, et al. RP-HPLC Method development and validation for estimation of darunavirethanolate in tablet dosage form. International journal of pharmacy and pharmaceutical sciences. 2012; 4: 270-273.
- Nagendra kumar AVD, Sreenivasa Rao B and Basaveswara Rao MV. Validated RP - HPLC Method for the Determination of Darunavir in Bulk and Pharmaceutical Formulation. Research Journal of Pharmaceutical, Biological and Chemical Sciences. 2014; 63-72.
- Lakshmana Rao, et al. Development and validation of novel HPLC method for estimation of darunavir in pharmaceutical formulations. International journal of research in pharmacy and chemistry. 2013; 438-443.
- Bhuse, et al. RP-HPLC Method development and validation for determination of darunavir in bulk and dosage form. World Journal of Pharmacy and Pharmaceutical Sciences. 2017; 6: 1752-1766.