
Research Article
Austin J Anal Pharm Chem. 2022; 9(1): 1140.
A Validated Method Developed for Estimation of Lifitegrast in Bulk and Pharmaceutical Dosage Form by UV-Spectrophotometer and RP-HPLC
Pannu S1, Bhatia R1,2# and Kumar B1,2*
¹Department of Pharmaceutical Analysis, ISF College of Pharmacy, Ghal Kalan, G.T Road, Moga, Punjab, India
²Department of Pharmaceutical Chemistry, ISF College of Pharmacy, Ghal Kalan, G.T Road, Moga, Punjab, India
#Co-Corresponding author
*Corresponding author: Bhupinder Kumar, Department of Pharmaceutical Chemistry, ISF College of Pharmacy, Ghal Kalan, G.T Road, Moga, Punjab, India
Received: January 29, 2022; Accepted: February 21, 2022; Published: February 28, 2022
Abstract
Lifitegrast is an LFA-1 antagonist, tetrahydroisoquinoline derivative, formulated as sterile eyedrops. Lifitegrast ophthalmic solution 5.0% was the first medication approved by the US FDA for treatment of the signs and symptoms of DED. We developed and validated two novel, economic, specific, and sensitive UV spectrophotometric and RP-HPLC methods for estimation of lifitegrast in bulk and dosage form. The linearity was found in the concentration range of 05-30 μg/mL in UV method (R²=0.9995) and 2-12 μg/mL in HPLC method (R²=0.999) with good correlation coefficient. The LOD and LOQ were found to be 0.77 μg/mL and 2.33 μg/mL, respectively by UV method. RP-HPLC method was developed at SunFire C 18 column (250 × 4.6 mm i.d., 5μm) using methanol, acetonitrile, and water as a mobile phase in the ratio of 20:60:20 (v/v) (pH = 2.27 adjusted with orthophosphoric acid). The LOD and LOQ were found to be 0.50 μg/mL and 1.52 μg/mL respectively by HPLC method. These developed methods were validated according to ICH (Q2 (R1)) guidelines with the following validation parameters i.e., specificity, linearity, accuracy, precision, LOD, LOQ, robustness, and ruggedness. The results of the study proved the applicability of the method in routine analysis of lifitegrast.
Keywords: UV-Spectrophotometric; RP-HPLC; Lifitegrast; LOD; LOQ; Validation; DED
Introduction
Lifitegrast is a tetrahydroisoquinoline derivative, formulated as sterile eyedrops having a concentration of 50 mg/mL (5.0%). It was designed to bind to LFA-1 and thus blocking the interaction of LFA- 1 with its ligand, ICAM-1. Lifitegrast ophthalmic solution 5.0% was approved by the US Food and Drug Administration (FDA) in 2016 for treatment of the signs and symptoms of DED in adults. It is the first medication approved by the US-FDA for treatment of both signs and symptoms of DED. Lifitegrast is highly aqueous soluble (>100 mg/mL), preservative-free, sterile eye drop having a target pH of 7.0- 8.0. It is stable in an aqueous solution at room temperature and the osmolarity of this solution is in the range of 200-330 mOsmol/kg [1]. Dry eye disease is also known as keratoconjunctivitis sicca, a disease of the tears and ocular surface [2]. XiidraTM (lifitegrast ophthalmic solution) 5% is used for the treatment of signs and symptoms of dry eye disease (DED) [3]. It was discovered by identifying amino acids side chains vital for LFA-1 and ICAM-1 binding. Lifitegrast (SAR-1118) was approved by the US-FDA in July 2016 for the treatment of DED which effectively blocks LFA-1/ICAM-1 interaction [4]. Lifitegrast (Figure 1) inhibits the specific T cell-mediated inflammatory pathway involved in the pathogenesis of dry eye disease.
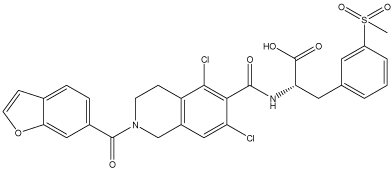
Figure 1: Structure of Lifitegrast.
Based on the current understanding of its mechanism of action, lifitegrast blocks the recruitment and activation of T cells to the ocular surface, thus lessening overall inflammatory responses [5]. Lifitegrast has the potential to be the first treatment indicated to treat both signs and symptoms of DED [4] Lifitegrast inhibits the release of interferon d, tumor necrosis factor-alpha (TNF-a), cytokines, and interleukins (ILs) proved by in vitro assay [6]. It was rapidly distributed in ocular and periocular tissues, cleared by normal tear drainage, having no systemic side effects proved by In vivo studies [7]. The safety and efficacy of lifitegrast were proved by a dose tolerability study in dogs suffering from keratoconjunctivitis sicca [6]. The mean peak plasma concentration (Cmax) of lifitegrast was found to be 1.70 ng/mL that was reached within 15 minutes of application. Quantifiable plasma concentrations of lifitegrast ranged from 0.55-3.74 ng/mL. The plasma protein binding of lifitegrast was found to be independent of concentration i.e., approximately 99%. Binding of lifitegrast to human serum albumin was 95-98%. Invitro metabolism study using fresh human hepatocytes proves that lifitegrast does not undergo significant metabolism. Breastmilk levels of lifitegrast have not been measured in humans. Because absorption from the eye is limited, ophthalmic lifitegrast would not be expected to cause any adverse effects in breastfed infants [8]. Chung et al. measured the lifitegrast concentration in rabbit plasma and multiple eye matrices by using LC-MS/MS method. In this method, rabbit plasma was used as a proxy matrix for the analysis of rabbit aqueous and vitreous humour. The chromatographic separation was achieved on a RP18 HPLC column, (2.1×50mm, 3.5 μm) with a mobile phase gradient. The mass spectrometer was operated in turbo ionspray (+ve mode). The LLOQ for lifitegrast was found to be 0.500 ng/tissue with standard curve ranges between 0.5-100 ng/sample [9]. The analytical method validation is adopted to confirm that the employed analytical procedure for specific tests meets the intended requirements. Results from the method validation can be considered to judge its quality, reliability as well as consistency about analytical results [10,11]. Validated analytical methods play a key role in achieving the quality and safety of the final product, especially in the pharmaceutical industry [12-16]. There is no UV-Spectrophotometric and RPHPLC method reported for the determination of lifitegrast in bulk and pharmaceutical dosage form, so this study aims to develop and validate new, simple, rapid, and sensitive UV-Spectrophotometric and HPLC methods for the determination of lifitegrast in bulk and pharmaceutical dosage form.
Materials and Methods
Materials
Lifitegrast working standard was obtained as a gift sample from Metrochem API Pvt. Ltd, Hyderabad, Telangana, India. Lifitegrast Ophthalmic solution (5%) was formulated in the Department of Pharmaceutics, ISF College of Pharmacy Moga, Punjab, India. Acetonitrile (HPLC grade) and Methanol (HPLC and AR grade) were purchased from Rankem (New Delhi, India). HPLC grade triethylamine and orthophosphoric acid were purchased from CDH (P) Ltd. New Delhi. HPLC grade water was acquired from water purification systems ELIX 03 (MILLIPORE, USA).
Instrumentation
UV-Visible double beam spectrophotometer (UV 1700, Shimadzu, Japan) with 1 cm matched quartz cells, Micropipette of variable volumes (Microlit, India), and Digital balance (Denver Instrument, Germany) were used for the UV-Spectrophotometric method. The HPLC experiment was executed on WATERS HPLC system which is compiled of 515 HPLC pump, arrayed with Rheodyne injection valve with loop having 20 μl capacity. Detection was performed by WATERS 2489 UV-Visible detector. EMPOWER-2 software was used to record and process the chromatographic data. PCI analytics Ultrabath sonicator with 3.5 L capacity was used for mixing and sonication purposes. Agilent Cary 360 FT-IR spectrometer with micro lab software was used to record IR spectra of API. Analytical Balance Mettler Toledo, AB204-S/FACT was used for weighing purposes.
UV method development and validation
Determination of wavelength of maximum absorption (λmax): A standard stock solution (1000 μg/mL) of lifitegrast was prepared by dissolving 25 mg lifitegrast in 25 mL methanol. From the standard stock solution, a reference stock solution was prepared by taking 1 mL of stock and diluted it up to 10 mL with the same solvent i.e., methanol to obtain 100 μg/mL reference stock. From the reference stock, further dilutions from 05-30 μg/mL were made. The standard solution of Lifitegrast (5 μg/mL) was scanned in the wavelength region of 200-400 nm (Figure 2) and the λmax was found to be 260nm.
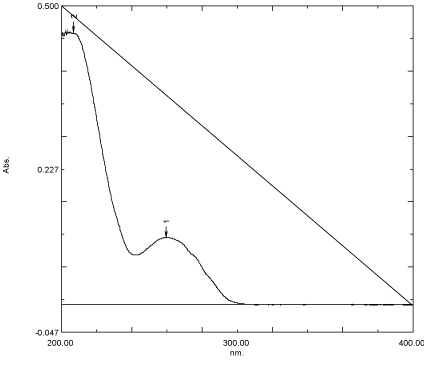
Figure 2: UV Spectrum of pure lifitegrast (5μg/mL).
Linearity: Six solutions (05-30 μg/mL) of different concentrations were prepared from the reference stock solution of lifitegrast for the linearity study. The absorbance of these solutions was observed by using methanol as blank at 260 nm and the obtained data was used for the linearity calibration curve.
Accuracy: Accuracy of the developed method was carried out by performing recovery studies using the standard addition method, in which standard drug was added at three different concentrations (80%, 100%, and subsequently by 120%) to the pre-analyzed formulation (10 μg/mL).
Precision: Precision study of the method was performed by intra-day and inter-day variation study. The intraday precision and inter-day precision were ascertained by determining the absorbance of 3 replicates of a fixed concentration of the drug (10 μg/mL) at three different periods of the same day and on three different days. The result of the precision studies was expressed in terms of % RSD (Relative Standard Deviation).
Solution stability study: To test the short-term stability of lifitegrast solution two different concentrations of 10 and 15 μg/mL prepared and analyzed after 24 hours.
LOD and LOQ: Limit of detection (LOD) and Limit of quantitation (LOQ) for the assay was calculated by using the following formula:
LOD=3.3 × (standard deviation of the y-intercept of the regression line/slope of the calibration curve)
LOQ=10 × (standard deviation of the y-intercept of the regression line/slope of the calibration curve)
Assay of the content of lifitegrast in ophthalmic solution (50 mg/mL): The newly developed method was applied to analyze the lifitegrast in the formulation. Lifitegrast ophthalmic solution (5%) equivalent to 100 mg (2 mL) of lifitegrast was dissolved into 100 mL methanol by shaking to get the final concentration of 1 mg/mL. The solution was then filtered through Whatman filter paper #41. This filtrate was diluted suitably with methanol to get the solution concentration of 10 μg/mL. The absorbance of this solution was measured and the amount of lifitegrast was calculated from the calibration curve.
Ruggedness and robustness: The ruggedness of the method was determined on carrying out the method by two different analysts and the robustness of the method was determined by measuring the absorbance of 10 μg/mL solution of lifitegrast at 258 nm, 260 nm, and 262 nm.
HPLC method development and validation
HPLC chromatographic conditions: The mobile phase consisting of Methanol: Acetonitrile: Water in the ratio of 20:60:20 (v/v) of pH 2.27 (adjusted using orthophosphoric acid) was used in isocratic mode at WATERS Sunfire C18 column (4.6 mm × 250 mm i.d., 5 μm) with a flow rate of 0.8 mL/min at 2500-2600 psi pressure was used for separation purpose. For peak sharpness, 0.1% triethylamine was used in the mobile phase. The wavelength of detection was set at 260 nm. The volume of injection was 20 μL. These conditions were selected after taking a lot of trials.
Preparation of standard solutions: The stock solution of lifitegrast was prepared by taking 25 mg of lifitegrast in a 25 mL volumetric flask and dissolved in methanol. After adding 15 mL of diluent in the volumetric flask, sonication was performed for 20 minutes and then the volume was made up to 25 mL with diluent. 1 mL stock solution of the standard drug was pipetted out and diluted with diluent to 10 mL to make target concentration. This stock solution was also used for the preparation of a desired calibration concentration range of dilutions.
Preparation of sample solution: From the ophthalmic solution (50 mg/mL) 2 mL of solution was pipette out and made-up volume to 100 mL with diluent. The made sample solution was filtered through a 0.45 μm syringe filter. This solution was labeled as a stock solution. Then 1 mL of stock solution was pipette out and made-up volume to 10 mL with diluents to prepare target concentration.
Preparation of mobile phase: The mobile phase consisted of Methanol: Acetonitrile: Water (in the ratio of 20:60:20 (v/v)) with 0.1% triethylamine was prepared by adding 200 mL methanol, 600mL of Acetonitrile and 200 mL water in 1000 mL of volumetric flask. The pH of the mobile phase was adjusted to 2.27 with orthophosphoric acid. Then, the solvent has undergone the process of sonication for 25min to achieve proper mixing of methanol, acetonitrile, and water. The mobile phase was filtered through a membrane filter with 0.22 μm pore size to remove any insoluble particulates.
Results and Discussion
UV-spectrophotometric method development
The choice of the solvent was based upon the solubility of the drugs. Lifitegrast was completely soluble in methanol and practically insoluble in water. Hence, methanol was used as a solvent to prepare the stock solution and subsequent dilutions. The analytical wavelength was selected by scanning the standard solutions of lifitegrast (5 μg/ mL) in the range of 200-400 nm against blank. The λmax of lifitegrast in methanol was found to be 260 nm.
Validation
Linearity: Lifitegrast was found to be linear within the concentration range of 05-30 μg/mL and exhibited a correlation coefficient of 0.9995 (Figure 3). The linearity overlay spectrum is shown in Figure 4. The results of regression analysis are given in Table 1.
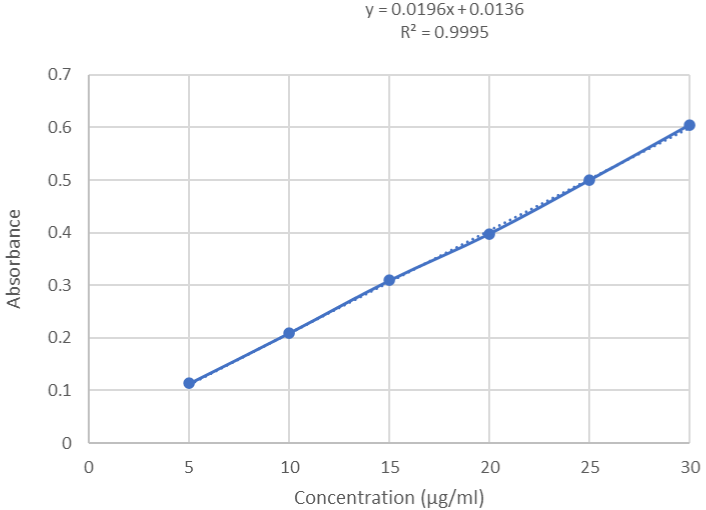
Figure 3: Linearity curve of Lifitegrast by UV Spectroscopy.
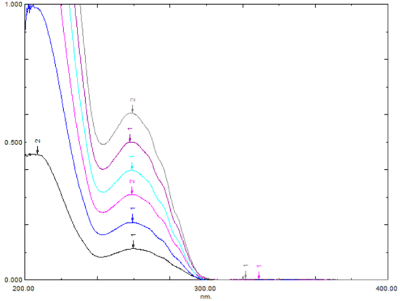
Figure 4: Linearity overlay spectrum of lifitegrast.
Table 1: Quantitative parameters of UV Spectrophotometric method.
Accuracy: Results of the recovery study were within the range of 98.28%-101.69% indicating that the developed method is an accurate method for the determination of lifitegrast. The overlay spectra of accuracy studies are shown in Figure 5 and results are summarized in Table 2.
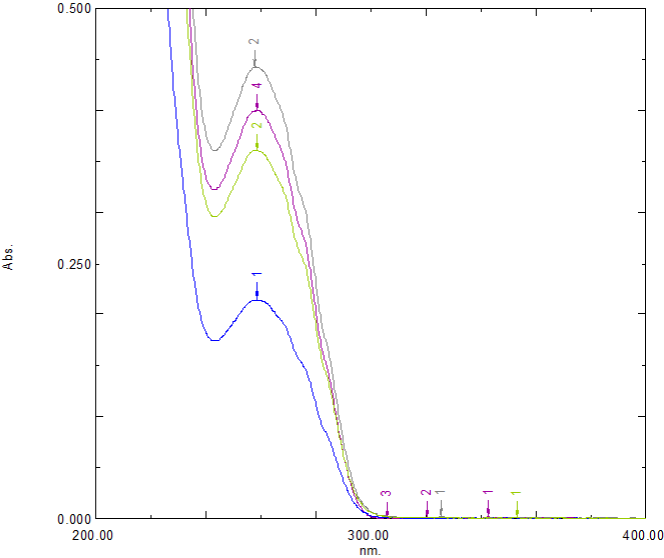
Figure 5: Fortified and unfortified sample spectra.
    Amount of sample (μg/mL)

    Amount of drug added    (μg/mL)

    Percent of the spiked    sample

    Amount recovered (μg/mL)

    Percent recovery


    10

    8

    80

    17.899

    98.73


    10

    10

    100

    19.657

    98.28


    10

    12

    120

    22.169

    101.69
Table 2: Statistical analysis for accuracy of the proposed method.
Precision: The developed method was found to be precise as the average % RSD values for intraday and the inter-day precision study were found to be 0.3432% and 0.3686% respectively (Table 3 and 4).
    S. No.

    Concentration (μg/mL)

    Absorbance

    Average % RSD


    Morning

    Afternoon

    Evening


    1

    10

    0.208

    0.21

    0.209

    0.3432


    2

    10

    0.209

    0.21

    0.209


    3

    10

    0.21

    0.209

    0.21


    % RSD

    0.4785

    0.2754

    0.2758
Table 3: Statistical analysis for intraday precision of the proposed method.
Absorbance
Average % RSD
Day 1
Day 2
Day 3
1
10
0.209
0.208
0.21
0.3686
2
10
0.21
0.209
0.208
3
10
0.209
0.209
0.208
% RSD
0.2758
0.2767
0.5533
Table 4: Statistical analysis for interday precision of the proposed method.
LOD and LOQ: The limit of detection (LOD) and limit of quantification (LOQ) was found to be 0.77 μg/mL and 2.33 μg/mL (Table 5). Which indicates that the proposed UV method is sensitive.
LOQ (μg/mL)
Lifitegrast
0.77
2.33
Table 5: Result of LOD and LOQ.
Assay of the content of lifitegrast in ophthalmic solution 5%: The assay results of the formulation are shown in Table 6. The developed method was in good agreement with the label claim.
    Drug

    Label claim

    Amount of drug estimated    (mg/mL)

    % Assay


    Lifitegrast ophthalmic    solution 5%

    50 mg/mL

    49.364 ± 0.3897

    98.061 ± 0.4772
Table 6: Result of assay (n=3).
Ruggedness and robustness: It was observed (Table 7 and 8) that there were no significant changes in the results, which demonstrated that the developed method is rugged and robust.
Analyst 1
Analyst 2
Concentration in (μg/mL)
Absorbance
Statistical analysis
Concentration in (μg/mL)
Absorbance
Statistical analysis
10
0.209
Mean -0.2095
S.D - 0.0007
%RSD-0.337510
0.208
Mean -0.209
S.D -0.0014
%RSD -0.676610
0.21
10
0.21
Table 7: Statistical analysis for ruggedness of the proposed method.
    S. No

    258nm

    260nm

    262nm


    1

    0.21

    0.211

    0.209


    2

    0.209

    0.21

    0.208


    3

    0.21

    0.211

    0.209


    Mean

    0.21

    0.211

    0.209


    SD

    0.0005

    0.005

    0.005


    %    RSD

    0.2754

    0.274

    0.2767
Table 8: Statistical analysis for robustness of the proposed method at different

wavelengths.
Solution stability study: The result of the short-term stability study (Table 9) indicates the sample stability in the solution for 24 hours which is within the acceptable range.
    Concentration (μg/mL)

    Concentration    found at 24 hours Mean (μg/mL)


    10

    9.919


    15

    14.891
Table 9: Short term stability study.
HPLC method development
A Single reversed-phase HPLC method was developed by applying mobile phase in different compositions, ratios, and pH for the estimation of lifitegrast. This method shows good linearity within the concentration range 2-12 μg/mL for lifitegrast.
System suitability: System suitability tests were performed according to USP-24 on freshly made 5 replicates from a standard stock solution of lifitegrast in optimized chromatographic condition. The evaluation of system suitability was accomplished by some parameters like retention time, % RSD of Rt, peak area, and number of theoretical plate, etc. [17,18]. The results are discussed in Table 10.
    System suitability    parameter

    BP Limits

    Results


    Retention    time

    -

    4.515 min


    %RSD    of Rt

    -

    0.2225


    Mean    peak area

    -

    763542


    %RSD    of peak area

    = 2.0

    0.6475


    Mean    number of theoretical plates

    = 2000

    5338
Table 10: System suitability parameters.
Analytical method validation
Validation of the developed RP-HPLC method was performed according to ICH guideline parameters [11,19]. The recent U.S. Food and Drug Administration (FDA) method validation guidance documents [20-22] as well as the United States pharmacopoeia (USP) both refer to ICH guidelines [23]. Validation is a very important factor in controlling the reliability of the method that is determined by the validation results, where accuracy, sensitivity, applicability, specificity, the limit of detection, and the limit of quantification are reported [24,25]. Validated analytical methods play a key role in achieving the quality and safety of the final product, especially in the pharmaceutical industry. Analytical method validation should always be understood concerning the lifecycle of the analytical procedure [12-16].
Specificity: Specificity may be defined as the ability of an analytical method to individualize and accurately quantify the analyte by measuring the response in the existence of another potential sample mixture. The entire separation and identification of lifitegrast by RPHPLC technique was obtained without any interference (Figure 6 and 7) which corroborates the specificity of the developed method.
Figure 6: Blank chromatogram.
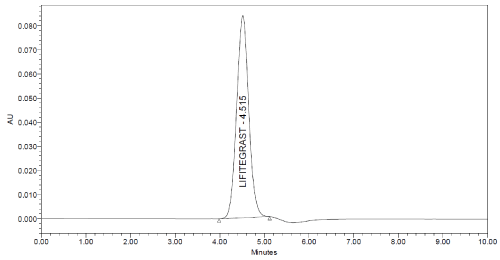
Figure 7: Chromatogram of Sample showing no interferences.
Linearity and range: The linearity of the HPLC method was performed by preparing six concentrations of lifitegrast standard solution in methanol from their stock solution individually. The linearity was followed in the concentration range of 2-12 μg/mL for lifitegrast with a 0.999 correlation coefficient (Figure 8 and 9). The results confirmed that the concentration range in which the standard curve of linearity was performed has good reproducibility as per Table 11.
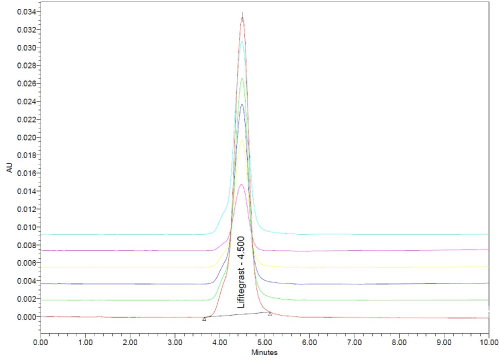
Figure 8: RP-HPLC chromatogram of linearity.
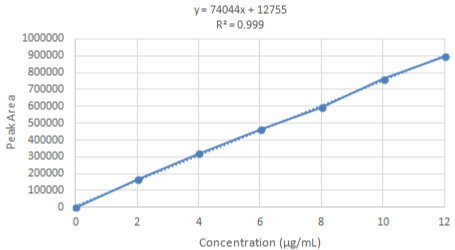
Figure 9: RP-HPLC Linearity curve of lifitegrast.
    S. No.

    Concentration (μg/mL)

    Mean peak area (n=2)


    1

    2

    166939


    2

    4

    318988


    3

    6

    463772


    4

    8

    593232


    5

    10

    762526


    6

    12

    893687
Table 11: Linearity results of lifitegrast.
Accuracy: The spiking method was followed to perform accuracy or recovery studies. According to the ICH guideline, the replicates of each three different concentrations were taken to accomplish the accuracy studies. The overlay is displayed in Figure 10 and the % recovery results are shown in Table 12.
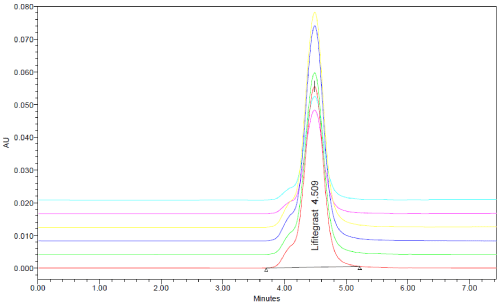
Figure 10: RP-HPLC chromatogram of accuracy.
    S. No

    Unfortified sample

    Fortified sample

    % Recovery


    Conc (μg/mL)

    Mean peak area

    Conc (μg/mL)

    Mean peak area


    1

    8

    569806

    18

    1358161

    100.24


    2

    10

    786412.5

    20

    1569538

    99.58


    3

    12

    851823

    22

    1647026

    101.11
Table 12: % Recovery results of lifitegrast.
The followed formula for calculating % recovery is as follows:
% RECOVERY = Spiked value - unspiked value/unspiked value*100
Detection and quantitation limits: The value of LOD was found to 0.50 μg/mL for lifitegrast. Similarly, LOQ was found to be 1.52 μg/ mL for lifitegrast. The LOQ and LOD values depend upon different factors like pH, Column type, type, and sensitivity of detector used. The Results of LOD and LOQ of drugs are shown in Table 13.
    S. No

    Validation parameter

    Results


    1

    Absorption maxima λmax    (nm)

    260nm


    2

    Linearity range (μg/mL)

    2-12 (μg/mL)


    3

    Correlation coefficient    (R2)

    0.999


    4

    Regression equation (y)

    74044x + 12755


    5

    Limit of detection    (μg/mL)

    0.5


    6

    Limit of quantification    (μg/mL)

    1.52
Table 13: Validation parameters.
Precision:
System precision: For the system precision study, a test sample was used. Six replications of 100% test concentration were used for this study. The % R.S.D. of the area shown for the spectra of six replicates of lifitegrast test concentration was calculated. The % R.S.D for system precision was within the limit (Table 14).
    Conc. (μg/mL)

    System precision Peak    area

    Conc. (μg/mL)

    Method precision Peak    area


    10

    762126

    10

    759354


    10

    769321

    10

    766003


    10

    769251

    0

    770212


    10

    770612

    10

    767124


    10

    761200

    10

    768215


    10

    771354

    10

    759641


    Mean

    767310.7

    Mean

    765091.5


    ± SD

    4455.888

    ± SD

    4551.143


    % RSD

    0.580715

    % RSD

    0.59485
Table 14: System and method precision studies of lifitegrast at test concentration.
Method precision: For the method precision study, a test sample was used. Six replicates of 100% of test concentration of lifitegrast. According to ICH guidelines, the % RSD should be less than 1% and 2% for drug substance and drug product respectively. The developed method has fulfilled the limit of % RSD as shown in Table 14.
Robustness: According to USP, robustness tests the capacity of an analytical process to remain uninfluenced by minor yet deliberate changes in parameters of the method. Robustness gives some sense of an analytical method’s reliability during daily use. The results achieved were not influenced by the variation in the conditions and were in parallel with the findings for previous conditions as shown in Table 15.
     Drug

    Conc. (μg/mL)

    Flow rate (0.8mL/ min)

    pH (2.27)

    Wavelength (260nm)


    0.7

    0.9

    2.17

    2.37

    258nm

    262nm


    Lifitegrast (% RSD)

    10

    0.427

    0.437

    0.256

    0.329

    0.515

    0.259
Table 15: % RSD of lifitegrast in the study of robustness.
Assay determination (percentage purity) of dosage form: The estimated % purity of lifitegrast and was found to be 100.31%. Results are shown in Table 16.
    Drug

    Label Claim (mg/mL)

    Amount Found (mg/mL)

    % Assay


    Lifitegrast

    50

    50.155

    100.31
Table 16: Assay determination (percentage purity w/v) of ophthalmic solution

by RP-HPLC.
Conclusion
Lifitegrast is a promising therapeutic candidate in the treatment of dry eye. It is being produced by several industries and marketed at a large scale. Therefore we have developed and validated UV and HPLC methods for its easy quantification in the marketed formulations. The methods proposed in the above study were found to be simple, sensitive, specific, economic, precise, and rapid for the determination of lifitegrast in bulk and its ophthalmic solution. Being economic and precise, the developed methods may be preferred for the routine analysis of the lifitegrast in the bulk and pharmaceutical dosage form.
Acknowledgement
The authors are thankful to the Chairman and Director Sir of ISF College of Pharmacy, Moga, Punjab for supporting this work.
References
- Donnenfeld ED, Perry HD, Nattis AS. Rosenberg ED. Lifitegrast for the treatment of dry eye disease in adults. Expert Opin Pharmacother. 2017; 18: 1517-1524.
- Keating GM. Lifitegrast ophthalmic solution 5%: a review in dry eye disease. Drugs. 2017; 77: 201-208.
- Ravisankar P, Navya CN, Pravallika D, Sri DN. A review on step-by-step analytical method validation. IOSR J Pharm. 2015; 5: 7-19.
- Abidi A, Shukla P, Ahmad A. Lifitegrast: a novel drug for treatment of dry eye disease. J Pharmacol Pharmacother. 2016; 7: 194.
- Perez VL, Pflugfelder SC, Zhang S, Shojaei A, Haque R. Lifitegrast, a Novel Integrin Antagonist for Treatment of Dry Eye Disease. Ocul Surf. 2016; 14: 207-215.
- Murphy CJ, Bentley E, Miller PE, McIntyre K, Leatherberry G, Dubielzig R, et al. The pharmacologic assessment of a novel lymphocyte function-associated antigen-1 antagonist (SAR 1118) for the treatment of keratoconjunctivitis sicca in dogs. Ophthalmol Vis Sci. 2011; 52: 3174-3180.
- Rao VR, Prescott E, Shelke NB, Trivedi R, Thomas P, Struble C, et al. Delivery of SAR 1118 to the retina via ophthalmic drops and its effectiveness in a rat streptozotocin (STZ) model of diabetic retinopathy. Invest Ophthalmol Vis Sci. 2010; 51: 5198-5204.
- National Centre for Biotechnology Information.
- Chung JK, Spencer E, Hunt M, Mc Cauley T, Welty D. Ocular Distribution and Pharmacokinetics of Lifitegrast in Pigmented Rabbits and Mass Balance in Beagle Dogs. J Ocul Pharmacol Ther. 2018; 34: 224-232.
- Mikus P, Novotny L. Research & Reviews: Journal of Pharmaceutical Analysis. 2015; 4: 13-14.
- Shabir GA. Step-by-step analytical methods validation and protocol in the quality system compliance industry. J Valid Technol. 2005; 10: 14-325.
- Aboul-Enein Hassan Y, Ozkan SA. Electroanalytical Methods in Pharmaceutical Analysis and Their Validation. Chromatographia. 2012; 75: 811.
- Gumustas MA, Ozkan SA. The role of and the place of method validation in drug analysis using electroanalytical techniques. Open Anal Chem. 2011; 5.
- Gumustas M, Kurbanoglu S, Uslu B, Ozkan SA. UPLC versus HPLC on drug analysis: advantageous, applications and their validation parameters. Chromatographia. 2013; 76: 1365-1427.
- Ozkan SA, Kauffmann J-M, Zuman P. Electroanalysis in biomedical and pharmaceutical sciences: voltammetry, amperometry, biosensors, applications. 2015, Springer.
- Pharmacopoeia U.S. US Pharmacopoeia and National Formulary [USP39- NF34]. 2016. Rockville Md: United States Pharmacopeial Convention, Inc.
- Borman P, Elder D. Q2 (R1) validation of analytical procedures. 2017: 127- 166.
- Kumar DA, Rao GS, Rao J. Simultaneous determination of Lamivudine, zidovudine and abacavir in tablet dosage forms by RP HPLC method. E-J Chem. 2010; 7: 180-184.
- Kumar A, Kishore L, Kaur N, Nair AJ. Method development and validation: Skills and tricks. Chron Young Sci. 2012; 3.
- DHHS U. CFR Parts 210 and 211. Current good manufacturing practice of certain requirements for finished pharmaceuticals, proposed rule. 1996.
- FDA US. “Guidelines for submitting samples and analytical data for methods validation.” Center for Drugs and Biologies. Department of Health and Human Services, Rockville, MD. 1987.
- Guidance, Research W. Validation of chromatographic methods. 1994; 2.
- Pharmacopoeia U, XXII U. Validation of compendial methods. 2003: USP- 26-NF21.
- Sharma K, Bhatia R, Anghore D, Singh V, Khare R, Rawal RK. Development and validation of UV-spectrophotometric and RP-HPLC methods for simultaneous estimation of fexofenadine hydrochloride, montelukast sodium and ambroxol hydrochloride in tablet dosage form. Analytical Chemistry Letters. 2018; 8: 829-843.
- Rana R, Kumar A, Bhatia R. Estimation of Tartrazine and Brilliant Blue Supra in Marketed Formulation through HPLC and Photo Stability Studies. Analytical Chemistry Letters. 2020; 10: 507-516.