
Research Article
Austin J Anat. 2021; 8(1): 1095.
Calculation of Staheli's Planter Arch Index, Chippaux-Smirak Index, Clarke’s Angle Prevalence and Predictors of Flat Foot: a Cross Sectional Study
Koirala S¹*, Khanal GP², Shah S¹, Khanal L¹, Yadav P¹ and Baral P¹
¹Department of Human Anatomy, BP Koirala Institute of Health Sciences, Nepal
²Department of Orthopedics, BP Koirala Institute of Health Sciences, Nepal
*Corresponding author: Sarun Koirala, Department of Human Anatomy, BP Koirala Institute of Health Sciences, Nepal
Received: November 19, 2020; Accepted: January 05, 2021; Published: January 12, 2021
Abstract
Human foot is the region most affected by anatomical variations, which presents a highest level of variability and the medial longitudinal arch along with various index that provides a quantitative measurement of the plantar arch.
A non-interventional descriptive cross sectional study was conducted among 300 preclinical undergraduate students Staheli's planter arch index, Chippaux-Smirak index, Clarke’s angle and truncated foot length was calculated using Foot Impression gaining kit with Ink Pad. For inferential analysis, unpaired student t-test was applied and regression equations was derived along with ROC curve. Staheli's, Chippaux-Smirak planter index, Clarke’s angle on right side foot was found to be 60.98±23.24, 36.09±13.94, 32.74±7.8 and 63.85±24.63, 36.64±14.62, 36.45±8.51 on left foot respectively. Significant difference was present in between BMI, navicular height and truncated foot length (p< 0.05). A bivariate logistic regression model was created, which revealed BMI, mid foot length, truncated foot length a strong predictors (regression coefficient, R=0.94, 0.78, 0.81, p<0.01), which were independently associated with flat foot to be detected by CSI and SPI. Receiver Operating Curve (ROC) revealed SPI (AUC=0.942, SEE-0.018, p<0.01) was seen to be highly sensitive and specific. Most of student have medium to high medial longitudinal arch. To find whether the foot is flat or not, plantar arch index can be performed and categorize into unilateral flat foot and bilateral flat foot. Staheli’s planter index was sensitive for identification of flat foot.
Keywords: Staheli’s index; Chippaux-smirak index; Clarke’s angle
Introduction
The foot transfers the body weight to ground and these loads further up the kinetic chain, due to which its structure has often been studied in relation to overuse injuries of the lower extremity [1-2]. Height of the medial longitudinal arch of the foot is commonly thought to be a predisposing factor to injuries hence medial longitudinal arch is the most important arch of the foot from a clinical point of view [3-4]. In bipeds, the foot takes on the important responsibility of receiving the weight of the whole body and at the same time stabilizing individual in changing postural and environmental conditions [5-7]. Any deviation from the anatomical plantigrade foot is a deformed foot and one of the deformities of the foot is a Flat Foot, in which normal concavity due to the medial longitudinal arch is absent whereas in high arch foot medial longitudinal arch is higher and all the weight is concentrated in a smaller area on the feet leading to a lot more pain [8-11]. Human foot is the region most affected by anatomical variations in the entire human body and one of the most important characteristics presenting the highest level of variability is the medial longitudinal arch, and arch index provides a quantitative measurement of the plantar arch, which can be compared to other measurements [12-15]. Hence this study helps to evaluate Staheli’s plantar arch index, Chippaux-Smirak index, Clarkes’s angle, occurrence and predictors of flat feet that is relevant for clinical practitioner.
Aims and objectives: Aims and objectives was to calculate of Staheli's planter arch index, Chippaux-Smirak index, Clarke’s angle and find the predictors of flat foot among preclinical undergraduate students using foot print method
Materials and Methods
This was a non- interventional descriptive, cross- sectional study conducted among the 300 preclinical undergraduate students in BPKIHS, carried during the period of April 2017- December 2017. The Ethical Clearance was obtained from IRC, BPKIHS and Nepal [IRC-0992-017]. Students without any relevant orthopedic surgeries, fractures over foot region and congenital deformities were included in the study and any relevant clinical conditions such as orthopedic surgeries, fractures over foot region and congenital deformities were excluded from the study.
Sample size calculation
This study considered 95% of CI, and 80% power of study. To estimate sample size, Mean of Right side and left side arch index as 0.67, 0.61 respectively and common Standard Deviation (0.25) was considered [16].
Where,
n - Number of sample.
s - Common SD of the outcome variable.
d = (M¹ -M² ) = Differences of mean.
Z -Represent the desired power (typically 0.84 for 80 % power).
Z8 -Represent the desired power level of statistical significance (typically 1.96)-Confidential Interval.
Calculated sample size =273, 10 were added in calculated size to reduce the various sample bias, n=273+27=300.
The purpose of the study and procedure was explained and written consent was obtained before taking the feet print. The participant was informed that their participation was voluntary. They were assured that their responses would be confidence and anonymity by coding measures.
Calculation of the plantar arch index
Each participant was requested to sit and foot was brought in contact with the foot impression gaining kit, and impression was pressed in the white paper sheets in standing posture. Staheli's planter arch index, Chippaux-Smirak index, Clarke’s angle, and normalized truncated foot length was derived, after obtaining the written informed consent. Standard instrumentation was used for the validity and for the reliability of the study and data collection/measurement was done by Principal Investigator (intra-rater reliability).
Staheli Plantar arch index: The Staheli Plantar arch index (PI) was calculated as, Staheli arch Index (PI) = Support width of central region (B)/Support width of heel region (C) =B/C×100 % [5-9].
Chippaux-Smirak index: Chippaux-Smirak index is the ratio of the maximum support width of the metatarsals (A) to the minimum support width of center of the arch (B) [10]. Thus, Chippaux-Smirak index = B/A×100 %.
Clarke’s angle: Clarke’s angle is defined as the angle obtained by a tangent line joining the medial edges of the first metatarsal head and the heel, and the second line that connects the first metatarsal head and the acme of the medial longitudinal arch concavity [11].
Truncated navicular height: Truncated navicular height (H) Navicular height was measured using a metal scale placed perpendicular to the navicular tuberosity and the distance measured from the most medial prominence of the navicular tuberosity to the supporting surface [15-16].
Truncated foot length: Truncated foot length (L) is the perpendicular distance from the 1st metatarsophalangeal joint to the most posterior aspect of the heel.
Normalized navicular truncated height: Normalized navicular truncated height (NH) was calculated by dividing the height of the navicular tuberosity from the ground (H) by the truncated foot Length (L) [17]. i.e. NH= H/L
Collected data were entered in Microsoft Excel 2007 and converted into Statistical Package for Social Sciences- SPSS 11.5 version for analysis. Percentage, mean with Standard Deviation (SD) was calculated. For inferential statistics, unpaired student t- test was applied. Correlation coefficient was calculated using bivariate correlation analysis and finally, regression equations (y=mx+c) where, m= slope, c= interception on ‘y’ constant (B) was derived using regression analysis and the Receiver Operating Curve (ROC) was generated.
Results
Mean Clarke’s angle was 32.74±7.8, 32.02±7.66 in male and female respectively in right side (Table 1). The occurrence of flat foot by Clarke’s angle among the male in the right side flat foot occurrence was found to be 48 % (n=144) and high arch on right side foot was 7.3 % (n=22) (Table 1).
    Variables


      Mean

      Std. Deviation
    Std Error
      Mean
    p-value


    age
    male
    20.2562
    1.11731
    0.08833
    0


    female
    19.7857
    1.02337
    0.08649


    Staheli Planter index (Right)
    male
    60.98
    23.24
    1.837
    NS


    female
    62.15
    23.13
    1.955


    Chippaux-Smirak index (Right)
    male
    36.09
    13.94
    1.1
    NS


    female
    35.46
    12.79
    1.08


    Clarke’s angle Right
    male
    32.7438
    7.81488
    0.61782
    0


    female
    32.0286
    7.66281
    0.64763


    Normalizes truncated foot length (R)
    male
    0.25
    0.02
    0.0018
    NS


    female
    0.27
    0.19
    0.0163


    Significant at p<0.05.
Table 1: Showing mean, SD of variables and different indices used.
Occurrence of flat foot in left side by Chippaux-Smirak index, was to found 26.3 % (n=79), and high arch was 17.3% (n=52). The SPI index determined occurrence of flat foot among in left side by 6.3% (n=19) and high arch were 1% (n=3). Similarly in right side, flat foot was 3 % (n=9) and high arch was seen in 2% (n=3) (Table 2).
    Variables
    Sex
    Mean
    Std. Deviation
    Std Error Mean
    p-value


    Truncated foot length (left)
    male
    19.86
    0.9663
    0.07639
    0


    female
    18.3786
    0.97794
    0.08265


    Clarke’s angle Left
    male
    36.45
    8.51916
    0.6735
    0.864


    female
    36.6214
    8.77494
    0.74162


    female
    4.5714
    0.47639
    0.04026


    Staheli Planter index (left)
    male
    63.8503
    24.63853
    1.94785
    0.77


    female
    68.8126
    23.52456
    1.98819


    Chippaux-Smirak index (left)
    male
    36.6421
    14.62129
    1.15591
    0.52


    female
    39.4916
    14.20904
    1.20088


    Normalizes truncated foot length (L)
    male
    0.2487
    0.02355
    0.00186
    0.026


    female
    0.2548
    0.02312
    0.00195


    Significant at p<0.05
Table 2: Showing mean, SD of variables and different indices used.
BMI was significant with Staheli’s Planter index of right and left side foot (Pearson’s correlation p=0.002, 0.001), Chippaux-Smirak index on right and left side (Pearson’s correlation p=0.002, 0.008) (Table 3). Similarly BMI with respect to SPI was not significant to NTFL on right side and left side (p=0.523). BMI was significant with respect to Navicular height and truncated foot length in both side (p= 0.006, 0.000). Negative correlation was present between the truncated foot length on right and left side foot and navicular height (p=0.008) (Table 3).
    Body mass index (kg/m2)
    Staheli index (Right)
    Staheli index (left)
    Chippaux-Smirak index (Right)
    Chippaux-Smirak index (left)
    Normalizes truncated foot    length (R)
    Normalizes truncated
      foot length (L)


    body mass
    Pearson    Correlation


    index
    Sig    (2-tailed)


    Staheli
    Pearson    Correlation
    .174**


    index (Right)
    Sig    (2-tailed)
    0.002


    Staheli
    Pearson    Correlation
    .195**
    .775**


    index (left)
    Sig    (2-tailed)
    0.001
    0


    Chippaux Smirak
    Pearson    Correlation
    .178**
    .921**
    .750**


    index (Right)
    Sig    (2-tailed
    0.002
    0
    0


    Chippaux-Smirak index (left)
    Pearson    Correlation
    .152**
    .722**
    .950**
    .735**


    Sig    (2-tailed)
    0.008
    0
    0
    0


    Normalizes truncated foot length (R)
    Pearson    Correlation
    -.151**
    -0.088
    -0.084
    -0.105
    -0.081


    Sig    (2-tailed)
    0.009
    0.13
    0.144
    0.07
    0.162


    Normalizes truncated foot length (L)
    Pearson    Correlation
    0.037
    -0.019
    -0.049
    -0.054
    -0.059
    .152**


    Sig    (2-tailed)
    0.523
    0.737
    0.401
    0.354
    0.307
    0.008


    **Pearson’s    Correlation is significant at the 0.01 level (2-tailed).
Table 3: Correlations between different variables and index.
Significant difference was present between Clarke’s angle on left side foot with the navicular height (p=0.046). Whereas no–significant difference was seen in between Clarke’s angle on right side foot with respect to navicular height on right side and truncated foot length and negative correlation was present.(p=0.62) (Table 3). Linear Regression equations (y=mx+c) where, m= slope, c= interception on ‘y’ constant (B) was derived with relation to different variables and predictors (Figure 7-14). Receiver Operating Curve revealed, Staheli index (Right) was seen more reliable and sensitive (AUC= 0.942, SEE- 0.036, 0.906- 0.978 at 95 % CI) index for identification of flat foot and BMI was seen to be the good predictor (AUC=0.615, SEE- 0.034, 0.536-0.695 at 95 % CI) for flat foot (Figure 15).
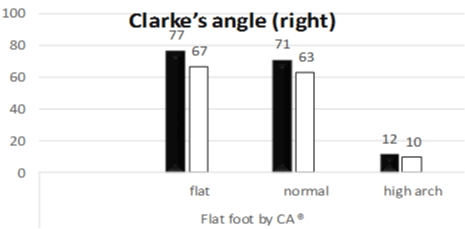
    Figure 1: Frequecy of flat foot, normal and high arch (right foot) determined
by Clarke’s angle.
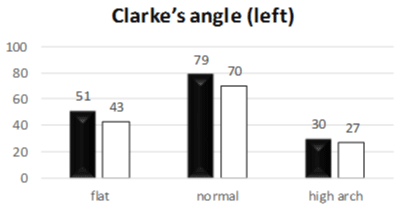
    Figure 2: Frequecy of flat foot, normal and high arch (left foot) determined
by Clarke’s angle.
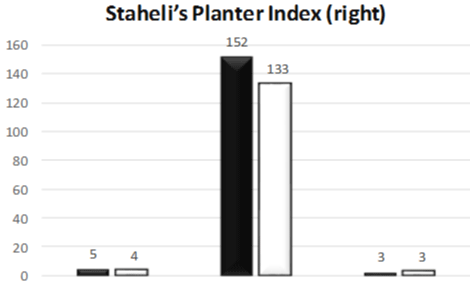
Figure 3: Frequecy of flat foot, normal and high arch (right foot) determined by Stahel’s Planter index, n=300, p<0.05.
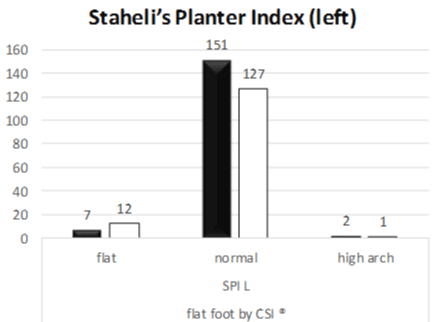
    Figure 4: Frequecy of flat foot, normal and high arch (right and left foot)
determined by Stahel’s Planter index, n=300, p<0.05.
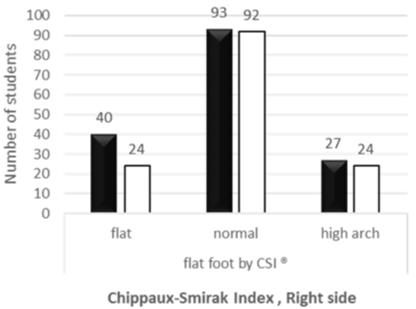
    Figure 5: Frequecy of flat foot, normal and high arch (right and left foot)
determined by Chippaus-Smirak Planter index, n=300, p>0.05.
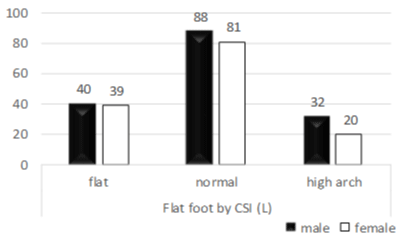
    Figure 6: Frequecy of flat foot, normal and high arch (right and left foot)
determined by Chippaus-Smirak Planter index, n=300, p>0.05.
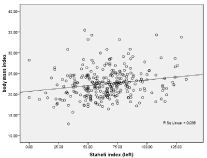
    Figure 7: Linear regression correlation line derived from equation: Staheli
index (left): y=mx+c: 1.375x(BMI) +35.247.
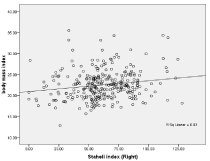
    Figure 8: Linear regression correlation line derived from equation: Staheli
index (R): y=mx+c: 1.176x (BMI) +35.085, R=0.03.
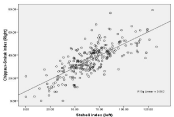
    Figure 9: Linear regression line derived from equation: Staheli index (L):
y=mx+c is 1.355xCSI (R)) +17.67, R=0.750, p=0.000.
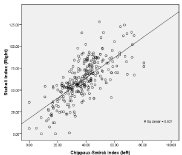
    Figure 10: Linear regression line derived from equation: CSI (L) = y=mx+c;
1.15xSPI (R) +17.68, R=0.722, p=0.000.
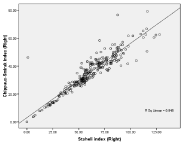
    Figure 11: Linear regression line derived from equation: SPI (R) = y=mx+c;
1.592xCSI (R) +4.553, R=0.921, p=0.003.
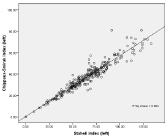
    Figure 12: Linear regression line derived from equation: SPI (L) = y=mx+c;
1.355xCSI (L) +17.67, R=0.902, p=0.000.
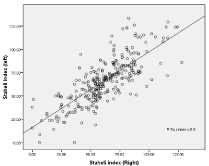
    Figure 13: Linear regression line derived from equation: SPI (R) = y=mx+c;
0.741xCSI (L) +12.482, R=0.775, p=0.000.
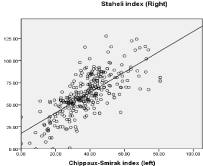
    Figure 14: Linear regression line derived from equation: CSI (L) = y= mx+c;
1.15xSPI (R) +17.68, R=0.722, p=0.000.
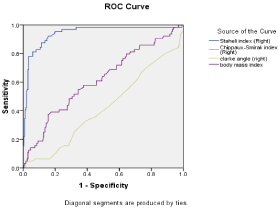
    Figure 15: The ROC curve with area under curve (Az) with 3 different planter
index and its relation to BMI.
Discussion
Study done by Hossain et al., [18] in adult Bangladeshi among the male undergraduate course, showed that the lower mean values (<30°) of Clarke’s angle and 50% flat foot tendency in standing position, who had lots physical activities during their courses. In our study, the Clarke’s angle indicated higher tendency towards flat left sided foot in male than girls. In right foot, more boys had tendency towards flat foot than the girls. By SPI method on left foot, flat foot tendency was seen more in female than boys. Similarly, the CSI index also indicated female more tendencies towards flat foot in left side foot than the boys. This may be because of using right foot more in boys and left foot in girls while walking long distance, use of more flat, sole less shoes for longer duration and dependent loading bearing foot. In study conducted by Mansur et al., [6,20] among, medical students showed that mean value of foot length was higher for male than for female. Strong positive correlation was found between arch height and foot length of people and flat foot. Our study revealed normal range of Clarke’s angle, SPI and CSI index. Higher value of Staheli index was present in female. Positive correlation was found BMI different 3 indices used.
The higher value of Staheli index and presence of less value of Clarke’s angle in female than male in our study, suggest tendency towards flat foot which may be due to more use of left foot as weight bearing by females and again the use of flat/sole less shoes for longer duration of walking activities. In a study conducted by Ravindra S et al., [19,21] showed the linear relationship between arch height, planter index and BMI with value of R (0.86). Our study suggested a negative correlation coefficient present with normalized truncated foot length. The linear regression equation was derived and the value of R was 0.75 with relation to Staheli index (L) and Chippaux- smirak index and BMI (0.944).
A bivariate logistic regression model was created, which revealed variables for CSI index as BMI (Correlation coefficient, R=0.944), age (R=0.530), mid foot length (R=0.781) and for SPI index, BMI (R=0.878), NTFL (R=0.810) and mid-foot length (R=0.936), p<0.01 independently associated with flat foot to be detected by CSI and SPI index. BMI might play a strong role as a predictors for the flat foot as students walk for going to classes and come back to hostel or play for longer duration in our setup.
Conclusion
BMI was seen as a strong predictor for identifying flat foot and meantime, Staheli’s Planter index was seen more sensitive for determining flatfoot. Hence, the students with less Clarke’s angle and high index value and students with more pain while walking were suggested to seek a orthopedics consultation to maintain the medial longitudinal arch of affected foot and to prevent for soft tissue and ankle injuries.
Acknowledgement
BPKIHS Students of MBBS, BDS 1st year and 2nd year students who voluntarily participated in this study. We are thankful Class Representative (CR) of MBBS and BDS batch; Manish Shrestha, Akash Neupane, Asish Shah, Shashank Bhattarai who helped us in coordinating the classes and Labex sessions.
References
- Pohl MB, Farr L. A Comparison of foot arch measurement reliability using both digital photography and calliper methods. Journal of Foot Ankle Research. 2010; 3: 14-17.
- Yalcin N, Esen E, Kanatli U, Yetkin H. Evaluation of the medial longitudinal arch: a comparison between the dynamic plantar pressure measurement system and radiographic analysis. Acta Orthopedica Traumatologica Turcica. 2010; 44: 241-245.
- Parash MH, Naushaba H, Rahman A, Shimmi SC. Photographic Estimation of Arch Height of Adult Bangladeshi Male. Bangladesh Journal of Anatomy. 2012; 10: 59-62.
- Richards C, Card K, Song J, Hillstrom H. A Novel Arch Height Index Assessment:Intra-Rater Reliability. Proceedings of American Society of Biomechanics Annual Meeting Toledo. 2003; 5: 1-2.
- Goonetilleke R. Foot anthropometry in Hong Kong. In Procdeding of the ASEAN 97 Conference. 1997; 81-88.
- Mansur DI, Haque MK, Karki RK, Khanal K, Karna R. Estimation of stature from foot length in adult Nepalese population and its clinical relevance. Kathmandu University Medical Journal. 2012; 10: 16-19.
- Williams DS, McClay IS. Measurements used to characterize the foot and the medial longitudinal arch: reliability and validity. Journal of Physcial Therapy. 2000; 80: 864-871.
- Cobb SC, James CR, Hjertstedt M, Kruk J. A digital photographic measurement method for quantifying foot posture: validity, reliability, and descriptive data. Journal of Athletic Training. 2011; 46: 20-30.
- Staheli LT, Chew DE, Corbett M. The longitudinal arch. Journal of Bone Joint Surgery. 1987; 69: 426-428.
- Stuart L, Weintein T. Orthopaedics-Principles and their applications. 6th ed. UK: Lippincott Williams and Wikins. 1984.
- Henry Gray. Gray’s Anatomy-The anatomical basis of clinical practice 40th ed. Edinburgh: Churchill Livingstone. 2008.
- Peter RC, Mary MR. The arch index-A usefull measure from foot prints. Journal of Biomechanics 1987; 22: 2-4.
- Gilmour JC, Burns Y. The measurement of the medial longitudinal arch in children. Foot Ankle International. 2001; 22: 493-498.
- Simon K. Children with Flat Feet Conditions-Types of Foot Problems Among kids. 2010.
- Cavanagh PR, Rodgers MM. The arch index: An useful measure from footprints. Journal of biomechanics. 1987; 20: 547-51.
- Hernandez AJ, Kimura K, Laraya F, Favaro E. Calculation of staheli’s plantar arch index and prevalence of flat feet a study with 100 children aged 5-9 years. Acta Ortopedica Brasileira. 2007; 15: 68-71.
- Chang HW, Lin CJ, Kuo LC, Tsai MJ, Chieh HF, Su FC. Three-dimensional measurement of foot arch in preschool children. Journal of Biomedical Engineering. 2012; 76: 15.
- Hossain TM, Parash M. Types of Foot Arch of Adult Bangladeshi Male. American Journal of Medical Sciences and Medicine. 2013; 6: 52-54.
- Xiong S, Ravindra SG, Witana CP, Weerasinghe TW, Au EYL. Foot arch characterization. A review a new metric and a comparison. Journal of American Podiatric medical Association. 2010; 100: 14-24.
- Engel K, Staheli LT. The natural history of torsion and other factors influencing gait in childhood. Clinical Orthopedics Related Research. 1974; 99: 12-17.
- Rose GK, Welton EA, Marshall T. The diagnosis of flat foot in the child. Journal of Bone Joint Surgery 1985; 61: 71-78.
- Rao UB, Joseph B. The influence of footwear in the prevalence of flat foot. J Bone Joint Surg Br. 1992; 74: 525-527.