
Research Article
Austin J Anesthesia and Analgesia. 2021; 9(1): 1098.
Observational Study of Dynamic Ventilation Parameters during Xenon Anesthesia
Bazin JE¹*, Majoral C², Daviet C², Katz I², Godet T¹, Futier E¹ and Caillibotte G²
¹Service d'Anesthesie-Reanimation, CHU de Clermont-Ferrand and University Clermont Auvergne, France
²Air Liquide Sante International, Innovation Center, France
*Corresponding author: Jean-Etienne Bazin, Service d'Anesthesie-Reanimation, CHU de Clermont-Ferrand and University Clermont Auvergne, 1 place Henri Dunant, 63003 Clermont-Ferrand, France
Received: February 17, 2021; Accepted: March 18, 2021; Published: March 25, 2021
Abstract
Background: The aim of this study was to observe dynamic pressure and flow measurements during the breathing cycle with different concentrations of xenon in patients without pulmonary disease to provide a better understanding of the mechanical-physiological effects of gas mixtures for anesthesia and other potential applications. Ventilation and respiratory data monitoring of flow rate, pressure at the Y-piece of the ventilator circuit, inhaled volume, and concentration of oxygen, xenon, and carbon dioxide for three concentrations of xenon (0, 30, and 60%) were recorded on the anesthetic ventilator station and downloaded to a portable computer.
Main Findings: The overall effects of gas concentration are compared in the superimposed flow and pressure curves recorded from the ventilator. Airway resistance increases with xenon concentration for both inspiration (p=0.0028) and expiration (p=0.0007) as expected. The compliance increased with increasing xenon concentration, but only to statistical significance between 100% oxygen and 60% xenon (p=0.0344). The percentage of pressure drop due to the breathing circuit were about 70% for all the groups (no differences statistically, p=0.8161).
Conclusions: The results show that the dominant source of the pressure loss is from the breathing circuit compared to the respiratory tract in patients without respiratory disease during inspiration.
Keywords: Xenon; Mechanical ventilation; Airway management; Airway resistance; Compliance; Pulmonary gas exchange
Introduction
Xenon is a noble gas with valuable anesthetic properties such as very fast recovery and cardiovascular stability. However, due to his low potency, xenon is usually administered at a concentration of 60% mixed with oxygen to insure sufficient hypnosis [1]; at this concentration, with the physical properties of relatively higher viscosity and density, the flow resistance will be elevated. Only a relatively few studies in animals [2-4] or in humans [5-7] present data on the respiratory effects of xenon that have recorded the increase in inspiratory airway pressure associated with the elevated resistance [5]. Knowledge of only an increase of insufflation pressures with xenon, without better knowledge of the relevant respiratory physiopathology, is the reason for the restriction of use in patients with bronchopulmonary pathologies. Because xenon anesthesia is administered via positive pressure mechanical ventilation, it is important to consider the possibility of ventilator induced lung injury [8] as well as normal ventilator operating modes that are not typically encountered using gas mixtures with the high density and viscosity of xenon. It was the aim of this study to observe dynamic pressure and flow measurements during the breathing cycle with different concentrations of xenon in patients without pulmonary disease in order to provide a better understanding of the mechanical-physiological effects of the gas for anesthesia and other potential applications [9]. An in silico study has shown that the increased pressure necessary for the flow largely occurs in the breathing circuit not in the airways [10]. Thus, a secondary aim of the study was to provide in vivo data to validate the in silico model [11].
Methods
This physiological-pharmacological, observational, prospective non-randomised study was approved by the ethics committee French CPP Sud-Est 6 (IRB N° IRB00008526). A total of 10 male (6) and female (4) patients aged between 50 and 83, ASA 1 or 2 without history of respiratory disease scheduled for an abdominal surgery under xenon anesthesia were enrolled in the study (see Table 1 for patient characteristics). The nature of the study was explained to the subjects and each one signed an informed consent form.
Measurements
Patients were installed in the supine position with the standard monitoring (electrocardioscope, non-invasive blood pressure, saturation of peripheral oxygen (SpO2), Bi-spectral Index (BIS)) put in place. Anesthesia was induced with propofol and remifentanil administered with a target controlled technique (Base Primea Fresenius, France). Each patient’s trachea was intubated with a size 7.5 or 8 mm Edgar type tube (Rusch, Ireland). For four patients (7-10) an Endotracheal Tube (ETT) tube with a lateral catheter with distal extremity under the balloon, intended for tracheal drug administration (e.g., epinephrine during cardiac arrests) was used during this study to monitor airway pressure at the tracheal extremity. The patients were ventilated using volume controlled mode with a tidal volume (VT) between 8 and 10 mL/kg of ideal body weight and a frequency of 10 breaths per minute using a FELIX DUAL anesthetic ventilator station (Air Liquide Medical Systems, France). This ventilator was designed and calibrated to administer xenon anesthesia economically [12]. If necessary, the VT was secondarily adapted in order to maintain end tidal partial Pressure Of Carbon Dioxide (PetCO2) between 35 and 40 mmHg, with an inspiratory/expiratory (I /E) ratio of 1/2. A Positive End Expiratory Pressure (PEEP) of nominally 5 to 10 cmH2O was applied during the entire anesthesia.
After endotracheal intubation and stabilization, 100% oxygen was delivered for 10 minutes (that also allowed for partial denitrogenation [13]. of the tissues) before a first set of measurements were recorded for approximately three breathing cycles (T1). Xenon (Air Liquide Santé International, France) was then introduced into the ventilatory circuit with an ultimate target of inhaled concentration of 60%. When the xenon concentration was between 28 and 32% a second recording of data was realized (T2a). After 5 minutes of stabilization at 60% xenon the third recording of data was performed (T2). During the progressive increase of xenon concentration, the target concentration of propofol was progressively decreased in order to maintain the bispectral index values between 40 and 50. In case of laparoscopic surgery (7 patients), a recording of data was realized 5 minutes after the inflation of pneumoperitoneum (T2b). At the end of surgical procedure, after deflation of pneumoperitoneum in case of laparoscopy, a last recording was realized with a xenon concentration of 60% just before the end of administration of the gas (T3). In general, the data from measuring points T1, T2a, T2 and T3 will be presented. However, for five of the patients who underwent laparoscopic surgery data was available before and after inflation (at T2a and T2b) and for these subjects compliance data are reported for these time points in comparison to the end of surgery (T3).
Ventilation and respiratory data monitoring of flow rate, pressure at the Y-piece of the ventilator circuit, inhaled and expired volume, and concentration of oxygen, xenon, and carbon dioxide were recorded on the anesthetic ventilator station and downloaded to a portable computer at a rate of 20 Hz (50 ms intervals). All these measurements were purely observational, realized without modification of the ventilation or any other intervention on the patients. The recorded resolution of the digital pressure measurement was 1 cm H2O, and for the flow measurement it was 1 L/min. The resolution of inhaled volume, based on the time integration of the flow signal, was 1 mL. The relevant variables for each patient at each measuring point (i.e., for each gas mixture) are; VT, Respiratory Rate (RR), PEEP, peak pressure during inspiration (pin-peak), plateau pressure (pplateau), oxygen concentration (FiO2), xenon concentration (FiXe), PetCO2, inspiratory flow rate (Qin), peak expiratory flow (Qpeak) and the pressure taken at Qpeak (pex@peak).
Three other measurements relevant to ventilation management were recorded. At peak pressure, the pressure at the exit of the ETT was obtained giving a measure, when subtracted from pin-peak, of the pressure drop due to the breathing circuit. The initial rise in pressure estimated from the pressure time series is a measure of the total pressure drop including the breathing circuit and the airways. The ventilator was run for a short time in pressure controlled mode using pin-peak as the target. The resulting tidal volume during operation in this mode was recorded.
The number of patients was arbitrarily fixed to 10. The statistical comparisons of quantitative variables between gas mixtures were performed using a within patient ANOVA parametric analysis with least squares mean Tukey adjustment in SAS v.9.1 (SAS Institute, USA). Thus, where the dataset was incomplete the patient was not included in the statistical analysis. The statistical comparisons of compliance measurements before, during, and after laparoscopy were performed using a paired Student-T test in a spreadsheet (Excel, Microsoft, USA). A p value below 0.05 was considered as a statistically significant difference.
Calculation
Three physiological parameters were calculated based on the flow, pressure, and volume measurements: inhaled airway resistance, Raw-in, exhaled airway resistance, Raw-ex, and lung compliance, C, using the formulas given in Equations 1.
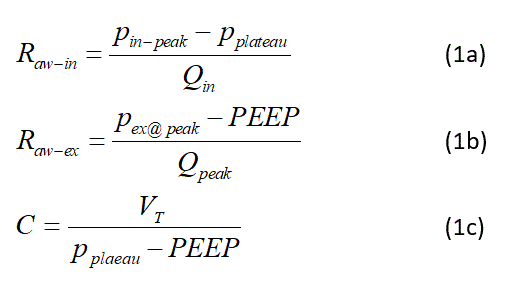
To estimate the pressure losses through the breathing filter (Hydro-Guard Mini; Intersurgical, UK) and the ETT the following formula was used.

where p is the gas density, k is the loss coefficient, and V is the velocity. Loss coefficients for the filter, 7.5 mm and 8 mm ETTs where determined by bench experiments [10] and fitted to formulas of the form

where the Reynolds number is Re=rVD/µ; D is the diameter (0.015 mm for the filter inlet) and µ is the gas viscosity. The fit coefficients are provided in Table 2. The gas properties used in the calculations are viscosity of 2.113x10⁻⁵, 2.339x10⁻⁵, 2.395x10⁻⁵ kg/s-m for Oxygen (O2 100%), Xenon (Xe/O2 30/70%) and Xenon (Xe/O2 60/40%), respectively; and similarly for density 1.257, 2.428, and 3.599 kg/m3, respectively for the three gases mixtures.
Results
The patient characteristics including the ETT size are given in Table 1. Figure 1 shows composite example time series plots of flow rate and pressure from patient 7. The overall effects of gas concentration can be compared in the superimposed flow and pressure curves recorded from the ventilator. In particular, not the increase peak pressure and decrease in peak flow at the start of expiration with xenon concentration.
The measured data for each patient at each time point is provided in Table 1. The related calculated data derived from the measured data are provided in Table 2. The averaged results of these data are shown for graphical comparison in Figure 2A-2C for Raw-in, Raw-ex, and C, respectively. Table 3 is a summary of the calculations for the estimated pressure losses through the breathing filter and ETT. These data averages are shown graphically in Figure 2D. The average PetCO2 results are shown in Figure 2E.
    P#
    Sex
    Age    (Y)
    BMI
    Laparoscopy
    ETT    size (mm)


    1
    F
    68
    27.7
    Yes
    7.5


    2
    M
    59
    24.2
    Yes
    8


    3
    M
    74
    34.9
    Yes
    7.5


    4
    M
    66
    24.7
    Yes
    7.5


    5
    F
    70
    23.9
    Yes
    7.5


    6
    F
    74
    25.5
    No
    7.5


    7
    F
    56
    30.5
    Yes
    7.5


    8
    M
    72
    27
    Yes
    8


    9
    M
    50
    25.4
    No
    8


    10
    M
    83
    26
    No
    8
Table 1: Patient characteristics. BMI is Body Mass Index, ETT is endotracheal tube.
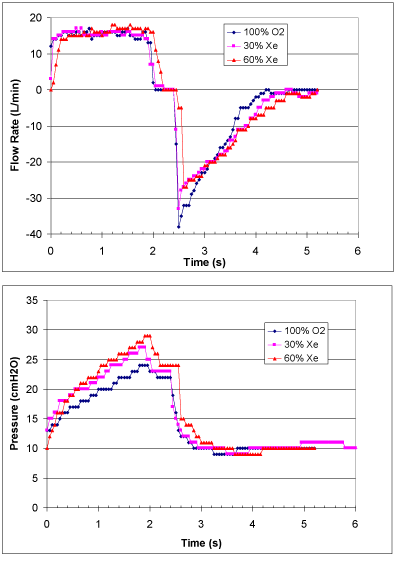
    Figure 1: Composite example time series plots of flow rate (Top), pressure
(Bottom) for Patient 3.
    A
    B
    C
    D
    E


    Filter
    1.531
    1046700
    34.0166
    -277.1
    572.953


    7.5    mm ETT
    0.365
    205
    -1.03
    13.37
    -41


    8    mm ETT
    0.3548
    56.2399
    2.0476
    -15.209
    28.3817
Table 2: Fitting coefficients used in Equation 3 to determine the loss coefficients for each breathing circuit component.
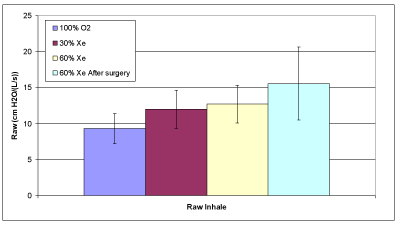
Figure 2A: Average inhaled airway resistance.
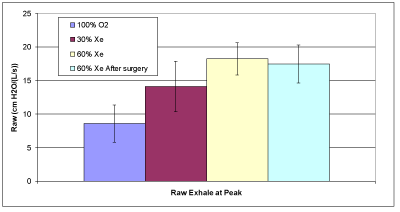
Figure 2B: Average exhaled airway resistance.
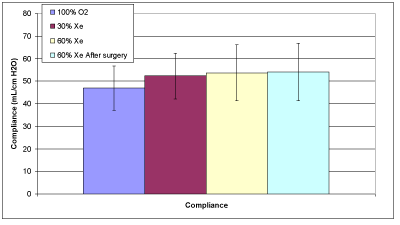
Figure 2C: Average compliance.
    T1 (100% O2    - DENITROGENATION)


    N° PATIENT
    VT
    RR
    PEEP
    Ppeak
    Pplateau
    FiO2
    FiXe
    PetCO2
    Pex@peak
    Qin
    Qex-max


    mL
    bpm
    cmH2O
    cmH2O
    cmH2O
    %
    %
    mmHg
    cmH2O
    L/min
    L/min


    1
    420
    16
    10
    25
    22
    97
    0
    34
    NA
    26.9
    NA


    2
    630
    10
    10
    23
    19
    94
    3
    34
    14
    25.2
    36


    3
    480
    8
    10
    23
    21
    96
    0
    36
    16
    15.4
    38


    4
    440
    8
    10
    23
    20
    97
    0
    33
    16
    14.1
    38


    5
    390
    14
    7
    19
    16
    95
    0
    32
    9
    21.8
    33


    6
    510
    8
    6
    21
    19
    96
    0
    33
    11
    16.3
    40


    7
    440
    11
    5
    18
    15
    95
    0
    42
    12
    19.4
    40


    8
    460
    8
    7
    20
    17
    97
    0
    32
    12
    14.7
    35


    9
    470
    12
    6
    19
    16
    95
    0
    35
    10
    22.6
    34


    10
    510
    8
    6
    18
    15
    98
    0
    30
    11
    16.3
    38


    T2A ( WASH-IN 30% Xe)


    N°    PATIENT
    VT
    RR
    PEEP
    Ppeak
    Pplateau
    FiO2
    FiXe
    PetCO2
    Pex@peak
    Qin
    Qex-max


    mL
    bpm
    cmH2O
    cmH2O
    cmH2O
    %
    %
    mmHg
    cmH2O
    L/min
    L/min


    1
    NA
    NA
    NA
    NA
    NA
    NA
    NA
    NA
    NA
    NA
    NA


    2
    620
    8
    10
    23
    19
    64
    32
    33
    13
    19.8
    26


    3
    500
    8
    10
    26
    23
    63
    25
    37
    15
    16
    33


    4
    480
    8
    10
    23
    20
    65
    31
    33
    13
    15.4
    26


    5
    400
    8
    7
    19
    15
    60
    32
    38
    10
    12.8
    25


    6
    520
    8
    6
    20
    17
    60
    35
    35
    9
    16.6
    26


    7
    480
    8
    6
    20
    17
    63
    31
    40
    14
    15.4
    28


    8
    540
    8
    8
    19
    16
    64
    32
    36
    10
    17.3
    20


    9
    550
    8
    6
    19
    16
    62
    32
    37
    9
    17.6
    26


    10
    520
    8
    6
    19
    16
    64
    31
    33
    11
    16.6
    26


    T2    (WASH-IN 30% O2 - 60% Xe)


    N°    PATIENT
    VT
    RR
    PEEP
    Ppeak
    Pplateau
    FiO2
    FiXe
    PetCO2
    Pex@peak
    Qin
    Qex-max


    mL
    bpm
    cmH2O
    cmH2O
    cmH2O
    %
    %
    mmHg
    cmH2O
    L/min
    L/min


    1
    570
    8
    9
    26
    22
    36
    56
    41
    14
    18.2
    28


    2
    640
    8
    10
    25
    19
    33
    61
    34
    12
    20.5
    23


    3
    500
    8
    10
    29
    25
    32
    58
    46
    NA
    16
    NA


    4
    500
    8
    10
    23
    19
    34
    58
    32
    14
    16
    19


    5
    420
    8
    7
    17
    15
    32
    61
    44
    9
    13.4
    22


    6
    520
    8
    6
    22
    19
    37
    58
    35
    9
    16.6
    26


    7
    500
    8
    6
    19
    16
    34
    58
    40
    9
    16
    21


    8
    540
    8
    8
    20
    16
    33
    61
    32
    10
    17.3
    18


    9
    500
    8
    6
    18
    15
    35
    57
    38
    9
    16
    23


    10
    540
    8
    6
    17
    14
    30
    64
    33
    8
    17.3
    20


    T3 (END OF SURGERY 30%    O2 - 60% Xe)


    N°    PATIENT
    VT
    RR
    PEEP
    Ppeak
    Pplateau
    FiO2
    FiXe
    PetCO2
    Pex@peak
    Qin
    Qex-max


    mL
    bpm
    cmH2O
    cmH2O
    cmH2O
    %
    %
    mmHg
    cmH2O
    L/min
    L/min


    1
    570
    8
    9
    26
    22
    35
    55
    43
    14
    18.2
    31


    2
    640
    8
    10
    28
    19
    30
    60
    43
    16
    20.5
    23


    3
    590
    8
    10
    28
    24
    33
    54
    42
    15
    18.9
    27


    4
    500
    8
    9
    24
    20
    34
    54
    44
    12
    16
    22


    5
    470
    8
    6
    25
    20
    39
    51
    47
    12
    15
    30


    6
    520
    8
    5
    18
    15
    27
    61
    37
    9
    16.6
    20


    7
    500
    8
    4
    17
    12
    35
    52
    51
    7
    16
    19


    8
    540
    8
    8
    19
    16
    35
    56
    42
    11
    17.3
    22


    9
    500
    8
    6
    18
    15
    28
    61
    40
    9
    16
    21


    10
    540
    8
    6
    19
    14
    36
    57
    34
    9
    17.3
    22
Table 3: Measured data, where Qin is VT/RR. NA is not available.
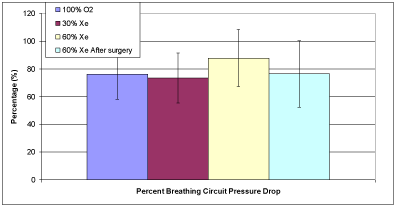
Figure 2D: Average estimated percentage of breathing circuit losses during inspiration.
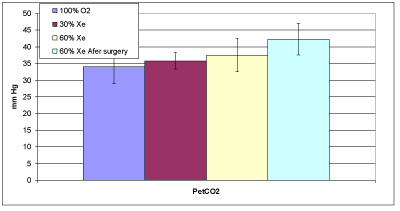
    Figure 2E: Average end-tidal partial pressure of carbon dioxide. Error bars
are based on the standard deviation.
Table 3 provides the measured data for the 10 patients. The averages of the calculated data provided in Table 4 are compared in Figures 2A and 2B. Raw increases with xenon concentration for both inspiration and expiration as expected. However, for inspiration these results were significant only for the comparisons between 100% oxygen and 60% xenon (p=0.0160); but not for 30% and 60% xenon (p=0.7823) nor for 100% oxygen and 30% xenon (p=0.0726). For expiration we found significant statistical results for the comparisons: between 100% oxygen and 30% xenon (p=0.0013), between 100% oxygen and 60% xenon (p=<0.0001), and between 30% and 60% xenon (p=0.0129). The average lung compliance data from Table 4 are shown in Figure 2C. The compliance increased with increasing xenon concentration, only to statistical significance between 100% oxygen and 60% xenon (p=0.0344).
A statistical comparison was made between the data obtained at the end of wash-in with 60% xenon and 60% after the surgery but before wash-out. For Raw on inspiration and expiration, and compliance there were no statistical differences. There was a small difference in PetCO2 between 100% oxygen and 60% xenon (p=0.0323).
For five of the subjects (2,4,5,7,8) who underwent laparoscopy, after wash-in of 60% xenon was completed data were measured after laparoscopic insufflation. The average compliance before and after were 59.3 (9.4) to 40.4 (10.6) mL/cm H2O, respectively; which is a statistically significant difference (p=0.0002). The compliance returned to 59.2 (15.6) mL/cm H2O at T3 after the laparoscopic procedure, which was the same as measured before the procedure at T2 (p=0.99). The standard deviation is in parenthesis after each compliance value.
Figure 3 shows comparisons of data related to ventilation management. Figure 3A is an identity plot of the measured Y-piece pressure minus the pressure at the exit of the ETT (i.e., the pressure drop due to the breathing circuit) compared to the calculated value for four patients. Figure 3B is an identity plot of the initial rise in pressure estimated from the pressure time series (i.e., a measure of the total pressure drop including the breathing circuit and the airways) compared to the (pin-peak-pplateau) measured pressure difference. Figure 3C is an identity plot of VT in volume control mode compared to pressure control mode.
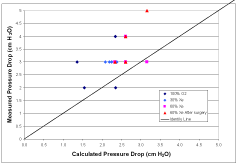
    Figure 3A: Identity plot of the measured Y-piece pressure minus the pressure
at the exit of the ETT (i.e., the pressure drop due to the breathing circuit)
compared to the calculated value for four patients.
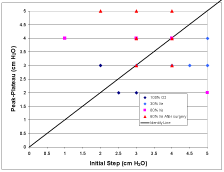
Figure 3B: Identity plot of the initial rise in pressure estimated from the pressure time series (i.e., a measure of the total pressure drop including the breathing circuit and the airways) compared to the (pin-peak-pplateau) measured pressure difference.
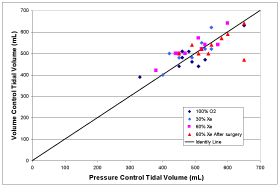
Figure 3C: Identity plot of VT in volume control mode compared to pressure control mode.
    T1 (100% O2    - DENITROGENATION)


    N°    PATIENT
    Raw-in
    Raw-ex-max
    Compliance


    cmH2O/(L/s)
    cmH2O/(L/s)
    mL/cmH2O


    1
    6.7
    NA
    35


    2
    9.5
    8.3
    70


    3
    7.8
    7.9
    43.6


    4
    12.8
    6.3
    44


    5
    8.2
    12.7
    43.3


    6
    7.4
    12
    39.2


    7
    9.3
    4.5
    44


    8
    12.2
    8.6
    46


    9
    8
    10.6
    47


    10
    11
    6.3
    56.7


    Avg
    9.3
    8.6
    46.9


    Std    Dev
    2.1
    2.7
    9.8


    T2A ( WASH-IN A 30%    Xe)


    N°    PATIENT
    Raw-in
    Raw-ex-max
    Compliance


    cmH2O/(L/s)
    cmH2O/(L/s)
    mL/cmH2O


    1
    NA
    NA
    NA


    2
    12.1
    13.8
    68.9


    3
    11.3
    14.5
    38.5


    4
    11.7
    16.2
    48


    5
    18.8
    12
    50


    6
    10.8
    18.5
    47.3


    7
    11.7
    6.4
    43.6


    8
    10.4
    18
    67.5


    9
    10.2
    16.2
    55


    10
    10.8
    11.5
    52


    Avg
    12
    14.1
    52.3


    Std    Dev
    2.6
    3.8
    10.2


    T2B (WASH-IN - 60% Xe)


    N°    PATIENT
    Raw-in
    Raw-ex-max
    Compliance


    cmH2O/(L/s)
    cmH2O/(L/s)
    mL/cmH2O


    1
    13.2
    17.1
    43.8


    2
    17.6
    18.3
    71.1


    3
    15
    NA
    33.3


    4
    15
    15.8
    55.6


    5
    8.9
    16.4
    52.5


    6
    10.8
    23.1
    40


    7
    11.3
    20
    50


    8
    13.9
    20
    67.5


    9
    11.3
    15.7
    55.6


    10
    10.4
    18
    67.5


    Avg
    12.7
    18.3
    53.7


    Std    Dev
    2.6
    2.4
    12.5


    T3 (END OF SURGERY 60%    Xe)


    N°    PATIENT
    Raw-in
    Raw-ex-max
    Compliance


    cmH2O/(L/s)
    cmH2O/(L/s)
    mL/cmH2O


    1
    13.2
    20.8
    43.8


    2
    26.4
    20
    71.1


    3
    12.7
    21.8
    42.1


    4
    15
    16
    45.5


    5
    19.9
    18
    33.6


    6
    10.8
    18
    52


    7
    18.8
    15.8
    62.5


    8
    10.4
    13.6
    67.5


    9
    11.3
    17.1
    55.6


    10
    17.4
    13.6
    67.5


    Avg
    15.6
    17.5
    54.1


    Std    Dev
    5.1
    2.8
    12.8
Table 4: Calculated data. NA is not available.
Discussion
The main results of this observational study of ventilator data during xenon anesthesia at three different levels of concentration (0, 30, and 60%) in patients without respiratory disease are: (1) dynamic airway pressure increases with xenon concentration, but (2) plateau pressure stays stable and (3) the dominant source of the pressure loss is due to the breathing circuit.
The composite time series plots shown in Figure 1 illustrate the recorded data obtained from the study. The inspiratory flow rate is controlled to be constant by the ventilator and is the same for each gas mixture to achieve a tidal volume that is also the same. Following a plateau period, the expiratory valve on the ventilator is opened to allow gas to leave the lungs, driven by the elastic properties of the tissues. The peak expiratory flow rate is reduced as both the density and viscosity increase with increased xenon concentration, resulting in longer expiration times. Because the respiratory rate was maintained at eight bpm for each gas mixture, thus the expiratory time was sufficient to allow complete expiration. Note that the low pressure for 60% xenon in Figure 1 is somewhat misleading because for this patient the PEEP level was lower than for the other gas mixtures.
The relatively low resolution of the reported data, especially for pressure, results in constant values over several time steps and the “stair step” distributions. This limitation is also a problem in passing errors to the calculated quantities and in knowing exactly when the breath was initiated which results in an offset of the inspiration Y-piece pressure curve in some cases needed to align the curves in Figure 1.
Airway resistance is greater for expiration than for inspiration [14]. This is understood to be the case because during expiration the pleural pressure is greater than the pressure in the airways, thus tending to collapse them. On the contrary, during inspiration, especially for the ventilator-assisted case during surgery, the pressure is greater in the airways tending to expand them.
The fact that average lung compliance tended to increase with increasing xenon concentration is perhaps indicative of increased alveolar recruitment though there is not enough evidence to make this claim conclusively [15]; but it is supported by the fact that oxygen saturation is maintained in spite of the decrease of FiO2 from 100% to about 40%.
    T1 (100% O2    - DENITROGENATION)


    N°    PATIENT
    Velocity-ETT    m/s
    Re-ETT
    Velocity-Filter    m/s
    Re-Filter
    Filter    pressure drop
    ETT    pressure drop
    Total    breathing circuit pressure drop
    Corrected    Raw-in
    Percentage    due to breathing circuit (%)


    cmH2O
    cmH2O
    cmH2O
    cmH2O/(L/s)


    1
    8.4
    3728
    2.5
    2121
    1.5
    1.7
    3.2
    -0.42
    106


    2
    5.8
    2758
    2.4
    1293
    2.1
    0.8
    2.9
    2.63
    72


    3
    5.3
    2370
    1.4
    1185
    0.9
    0.8
    1.6
    1.37
    82


    4
    8.2
    3676
    1.3
    1838
    0.5
    1.7
    2.1
    3.71
    71


    5
    6.2
    2747
    2.1
    1373
    1.5
    1
    2.5
    1.35
    84


    6
    6.2
    2747
    1.5
    1373
    0.8
    1
    1.9
    0.55
    93


    7
    7.3
    3259
    1.8
    1629
    1
    1.4
    2.3
    2.02
    78


    8
    4.9
    2323
    1.4
    1239
    0.7
    0.6
    1.4
    6.7
    45


    9
    7.5
    3560
    2.1
    1899
    1.2
    1.2
    2.3
    1.75
    78


    10
    5.4
    2575
    1.5
    1373
    0.8
    0.7
    1.5
    5.35
    51


    Avg
    2.5
    76.1


    Std    Dev
    2.2
    17.9


    T2A ( WASH-IN A 30%    Xe)


    N°    PATIENT
    Velocity-ETT    m/s
    Re-ETT
    Velocity-Filter    m/s
    Re-Filter
    Filter    pressure drop
    ETT    pressure drop
    Total    breathing circuit pressure drop
    Corrected    Raw-in
    Percentage    due to breathing circuit (%)


    cmH2O
    cmH2O
    cmH2O
    cmH2O/(L/s)


    1
    NA
    NA
    NA
    NA
    NA
    NA
    NA
    NA
    NA


    2
    6.6
    5463
    1.9
    2914
    1.1
    1.5
    2.6
    4.1
    66


    3
    6
    4699
    1.5
    2350
    0.9
    1.6
    2.5
    1.76
    84


    4
    5.8
    4511
    1.4
    2256
    0.9
    1.5
    2.4
    2.41
    79


    5
    4.8
    3759
    1.2
    1880
    0.7
    1.1
    1.8
    10.19
    46


    6
    6.3
    4887
    1.6
    2444
    1
    1.7
    2.7
    1.14
    89


    7
    5.8
    4511
    1.4
    2256
    0.9
    1.5
    2.4
    2.41
    79


    8
    5.7
    4758
    1.6
    2538
    1
    1.2
    2.2
    2.82
    73


    9
    5.8
    4846
    1.7
    2585
    1
    1.2
    2.2
    2.58
    75


    10
    5.5
    4582
    1.6
    2444
    1
    1.1
    2.1
    3.33
    69


    Avg
    3.4
    73.5


    Std    Dev
    2.7
    12.7


    T2B (WASH-IN 60% Xe)


    N°    PATIENT
    Velocity-ETT    m/s
    Re-ETT
    Velocity-Filter    m/s
    Re-Filter
    Filter    pressure drop
    ETT    pressure drop
    Total    breathing circuit pressure drop
    Corrected    Raw-in
    Percentage    due to breathing circuit (%)


    cmH2O
    cmH2O
    cmH2O
    cmH2O/(L/s)


    1
    6.9
    7755
    1.7
    3878
    1.1
    2.8
    3.9
    0.38
    97


    2
    6.8
    8163
    1.9
    4354
    1.2
    2.1
    3.4
    7.74
    56


    3
    6
    6803
    1.5
    3401
    0.9
    2.2
    3.2
    3.18
    79


    4
    6
    6803
    1.5
    3401
    0.9
    2.2
    3.2
    3.18
    79


    5
    5.1
    5714
    1.3
    2857
    0.8
    1.6
    2.4
    -1.8
    120


    6
    6.3
    7075
    1.6
    3538
    1
    2.4
    3.4
    -1.27
    112


    7
    6
    6803
    1.5
    3401
    0.9
    2.2
    3.2
    -0.57
    105


    8
    5.7
    6888
    1.6
    3674
    1
    1.6
    2.6
    4.85
    65


    9
    5.3
    6378
    1.5
    3401
    0.9
    1.4
    2.3
    2.52
    78


    10
    5.7
    6888
    1.6
    3674
    1
    1.6
    2.6
    1.38
    87


    Avg
    2
    87.7


    Std    Dev
    3
    20.6


    T3 (END OF SURGERY 60%    Xe)


    N°    PATIENT
    Velocity-ETT    m/s
    Re-ETT
    Velocity-Filter    m/s
    Re-Filter
    Filter    pressure drop
    ETT    pressure drop
    Total    breathing circuit pressure drop
    Corrected    Raw-in
    Percentage    due to breathing circuit (%)


    cmH2O
    cmH2O
    cmH2O
    cmH2O/(L/s)


    1
    6.9
    7755
    1.7
    3878
    1.1
    2.8
    3.9
    0.38
    97


    2
    6.8
    8163
    1.9
    4354
    1.2
    2.1
    3.4
    16.53
    37


    3
    7.1
    8027
    1.8
    4014
    1.1
    3
    4.1
    -0.34
    103


    4
    6
    6803
    1.5
    3401
    0.9
    2.2
    3.2
    3.18
    79


    5
    5.7
    6395
    1.4
    3197
    0.9
    2
    2.9
    8.54

    57


    6
    6.3
    7075
    1.6
    3538
    1
    2.4
    3.4
    -1.27
    112


    7
    6
    6803
    1.5
    3401
    0.9
    2.2
    3.2
    6.93
    63


    8
    5.7
    6888
    1.6
    3674
    1
    1.6
    2.6
    1.38
    87


    9
    5.3
    6378
    1.5
    3401
    0.9
    1.4
    2.3
    2.52
    78


    10
    5.7
    6888
    1.6
    3674
    1
    1.6
    2.3
    8.32
    52


    Avg
    4.6
    76.4


    Std    Dev
    5.5
    23.9
Table 5: Breathing circuit loss during inspiration calculation data. NA is not available.
The airway resistances given in Table 4 cannot be readily compared to typical resistance measurements because the pressure drop of the breathing circuit from the Y-piece through the filter and ETT is included in the measurement. To overcome this problem calculations based on Equations 2 and 3 for the pressure drop in the breathing circuit were performed and are summarized In Table 5. These results were then used to correct the previously calculated Raw-in by using Equation 4 that can more directly be compared to airway resistance measurements found in the literature.

Where pBC is the breathing circuit pressure drop. For example, Wong and Johnson [16] measured average mouth breathing respiratory resistance of young adult subjects as 2.96 cmH2O.s/L during a study of nasal dilator strips; and Johnson et al. [17] measured airway resistances of 2.63 cmH2O.s/L on 162 male adults and 3.24 cmH2O.s/L on 108 female adults aged 18 to 88. In comparison, Raw-in (corrected) = 2.5 cm H2O s/L was found while being ventilated with 100% oxygen appears realistic. However, it should be noted that a direct comparison is still compromised due to several differences of ventilated patients to normal breathing subjects; for example, positive pressure ventilation with PEEP should open airways, upper respiratory tract resistance is not included, and patients are supine or prone versus erect. The effect of xenon can be seen in the increased resistance for each patient, but due to relatively poor resolution of the pressure measurements, the corrected pressure drop does not show a consistent effect of xenon. Schaefer et al. measured lower values of Raw-in=0.94 cmH2O.s/L for the control gas and 1.42 cmH2O.s/L for the nominally 60% xenon mixture for a ratio of 1.52 [7]. Using Table 3 the equivalent values from this study are 2.5 and 4.6 cmH2O.s/L (using the value at T3) and a ratio of 1.84.
The issue of increased pressure needed for xenon anesthesia is a recognized concern, especially as measured by the ventilator and seen by the anesthesiologist. Therefore, was calculated to give the percentage of the pressure drop caused solely by the breathing circuit. These results are given in Table 3 and the averages are summarized in Figure 2D. It can be seen that that the averages are about 70-90 % for all the groups and after surgery (no differences statistically). This result is similar to previous numerical results [10] that showed that the breathing circuit is the dominant source of flow resistance.
Figure 2E summarizes the average PetCO2 values while breathing the three gases. At T3, for 60% xenon PetCO2 was significantly greater than 100% oxygen (p=0.0323). During administration of 60% xenon after the surgery, five of the eight patients had values outside the target range of 35-40 mm HG; thus there was a significant difference (p=0.0188). However, as these were patients who had received laparoscopic surgery, the hypercapnia was expected [18] and there were no other acute respiratory events observed and no interventions by the clinical team.
The comparison of calculated and measured breathing circuit pressure drop shown in Figure 3A shows a correlation, but the lack of resolution in the pressure measurements makes any conclusion unwarranted. This resolution problem is even more prevalent in regard to the comparison between the initial pressure rises to the (pin-peak-pplateau) pressure differences shown in Figure 3B where no trends are evident. More accurate pressure recordings must be taken to evaluate these two approaches to ventilation management. However, the results shown in Figure 3C regarding tidal volume do strongly suggest that pressure controlled mode can be used to obtain the same tidal volume as achieved in volume controlled mode during xenon anesthesia.
Conclusion
Observational measurements of dynamic ventilation parameters during xenon anesthesia in humans have been presented that can provide guidance for those practitioners inexperienced with ventilation of this heavy gas. The results confirm that the dominant source of the pressure is the loss due to the breathing circuit compared to the respiratory tract in patients without respiratory disease during inspiration. Resistance values during inspiration and expiration were elevated while ventilating with 30% and 60% xenon compared to 100% oxygen; but no adverse events requiring intervention by the clinical team regarding oxygenation occurred during the study.
Acknowledgement
We thank Benoit Piednoir for performing the statistics.
References
- Cullen S, Eger E, Cullen B, Gregory P. Observations on the Anesthetic Effect of the Combination of Xenon and Halothane. Anesthesiology. 1969; 31: 305-309.
- Calzia E, Stahl W, Handschuh T, Marx T, Froba G, Bader S, et al. Respiratory mechanics during xenon anesthesia in pigs: comparison with nitrous oxide. Anesthesiology. 1999; 91: 1378-1386.
- Zhang P, Ohara A, Mashimo T, Imanaka H, Uchiyama A, Yoshiya I. Pulmonary resistance in dogs: a comparison of xenon with nitrous oxide. Can J Anaesth. 1995; 42: 547-553.
- Baumert J-H, Reyle-Hahn M, Hecker K, Tenbrinck R, Kuhlen R, Rossiant R. Increased airway resistance during xenon anaesthesia in pigs is attributed to physical properties of the gas. BJA Br J Anaesth. 2002; 88: 540-545.
- Lachmann B, Armbruster S, Schairer W, Landstra M, Trouwborst A, Van Daal GJ, et al. Safety and efficacy of xenon in routine use as an inhalational anaesthetic. The Lancet. 1990; 335: 1413-1415.
- Rueckoldt H, Vangerow B, Marx G, Haubitz B, Meyer MC, Piepenbrock S, et al. Xenon inhalation increases airway pressure in ventilated patients. Acta Anaesthesiol Scand. 1999; 43: 1060-1064.
- Schaefer MS, Treschan TA, Gauch J, Gauch J, Neukirchen M, Kienbaum P. Influence of xenon on pulmonary mechanics and lung aeration in patients with healthy lungs. Br J Anaesth. 2018; 120: 1394-1400.
- Gattinoni L, Protti A, Caironi P, Carlesso E. Ventilator-induced lung injury: the anatomical and physiological framework. Crit Care Med. 2010; 38: S539-S548.
- Anna R, Rolf R, Mark C. Update of the organoprotective properties of xenon and argon: from bench to beside. Intensive Care Med Exp. 2020; 8: 11.
- Katz IM, Martin AR, Feng C-H, Majoral C, Caillibotte G, Marx T, et al. Airway pressure distribution during xenon anesthesia: the insufflation phase at constant flow (volume controlled mode). Appl Cardiopulm Pathophysiol. 2012; 16: 5-16.
- Katz IM, Majoral C, Daviet C, Bazin J-E, Caillibotte G. In silico Simulations Compared to in vivo Measurements of the Effects of Fluid Properties on Dynamic Ventilation Parameters during Xenon Anesthesia. Appl Cardiopulm Pathophysiol. 2017.
- Stoppe C, Rimek A, Rossaint R, Rex S, Stevanovic A, Schalte G, et al. Xenon consumption during general surgery: a retrospective observational study. Med Gas Res. 2013; 3: 12.
- Katz I, Murdock J, Palgen M, Farjot G. A physiologically based model for denitrogenation kinetics. Med Gas Res. 2018; 7: 256-259.
- Johnson AT. Biomechanics and exercise physiology: quantitative modeling. CRC Press. 2007.
- Jonson B, Richard J-C, Straus C, Mancebo J, Lemaire F, Brochard L. Pressure-volume curves and compliance in acute lung injury: evidence of recruitment above the lower inflection point. Am J Respir Crit Care Med. 1999; 159: 1172-1178.
- Wong LS, Johnson AT. Decrease of resistance to air flow with nasal strips as measured with the airflow perturbation device. Biomed Eng OnLine. 2004; 3: 38.
- Johnson A, Scott WH, Russek-Cohen E. Resistance values obtained with the airflow perturbation device. Int J Med Implants Devices. 2007; 2: 45-58.
- Neudecker J, Sauerland S, Neugebauer E, Bergamaschi R, Bonjer HJ, Cuschieri A, et al. The European Association for Endoscopic Surgery clinical practice guideline on the pneumoperitoneum for laparoscopic surgery. Surg Endosc. 2002; 16: 1121-1143.