Clinical Image
What does it mean when we integrate a typical clinical presentation with a specific ECG pattern?
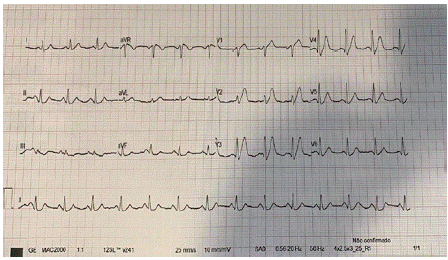
A 72-year-old male smoker with arterial hypertension and hypercholesterolemia went to the emergency department with intense chest pain with 2 hours of evolution. The initial electrocardiogram revealed sinus rhythm at 84 bpm and ST-segment depression with symmetrical T-wave elevation in leads V2-V6, consistent with a De Winter pattern (Figure 1).

    Figure 1: Initial electrocardiogram showing ST-segment depression in V2-V6

with marked symmetrical T-wave elevation.
Assuming an equivalent ST-segment elevation, the patient underwent emergent catheterization and we repeated a new electrocardiogram, which demonstrated ST-segment elevation in leads V1-V5.
Coronary angiography revealed sub occlusion of the proximal portion of the anterior descending coronary artery (AD), so we performed angioplasty with placement of 1 drug-eluting stent.
The De Winter pattern is characterized by ST-segment depression in precordial leads with symmetrical elevation of the T wave. This pattern usually means lesion on the proximal portion of the AD, so its early identification and treatment has an impact on the prognosis of these patients.
The Authors declare that there is no conflict of interest.
References
- Y Velibey, D Genc, D Inan, Tezen O. The de winter electrocardiographic pattern: What else do we need to learn? Int J Cardiovasc Acad. 2019; 5: 103-105.
- RJ de Winter, NJ Verouden, HJ Wellens, Wilde AAM, Interventional Cardiology Group of the Academic Medical Center. A new ECG sign of proximal LAD occlusion. N Engl J Med. 2008; 359: 2071-2073.
