
Research Article
Austin Public Health. 2016; 1(1): 1003.
Study of Typical Heavy Pollution Events of Atmospheric Mercury in the Yangtze Delta using HYSPLIT4 and PSCF Models
Jianfeng LI¹*, Zhang X¹ and Diao C²
¹Beijing Municipal Institute of Labor Protections, China
²Department of Chemistry and Environmental Science, Guizhou Minzu University, China
*Corresponding author: Jianfeng LI, Beijing Municipal Institute of Labor Protections, 55# Taoranting Road, Xicheng District, Beijing 100054, China
Received: April 22, 2016; Accepted: June 07, 2016; Published: June 10, 2016
Abstract
Mercury is a highly toxic heavy metal element that occurs widely in soil, water, and atmosphere. Based on observations of atmospheric mercury in Chongming Island, Shanghai, HYSPLIT4 and the Potential Source Contribution Function (PSCF) models were used to analyze typical pollution events and track the sources of the mercury. Pollution episodes of July 29 to August 1 and October 30 to November 2, 2010 were chosen for the study. Possible reasons for these events were proposed based on results from the HYSPLIT4 simulation, and analysis of the relationship between carbon monoxide and Total Gaseous Mercury (TGM). The PSCF model was used to analyze the long-term distribution and potential emission areas. Results indicate that the pollution event of July 29 to August 1 was influenced mainly by airflow from the southwest, and that the TGM came from urban districts of Shanghai and southern parts of Jiangsu, Zhejiang, Anhui, and Jiangxi. Furthermore, the PSCF simulation identifies the sources most likely contributing TGM to Chongming in different seasons. The objective is to provide an analytical basis for the investigation of periods of high pollution for Shanghai early warning mechanism, to reduce the negative impacts associated with unexpected air pollution events.
Keywords: Atmospheric mercury; Air pollution; Toxic metals; Long-range transport
Abbreviations
TGM: Total Gaseous Mercury; GEM: Gaseous Elemental Mercury; RGM: Reactive Gaseous Mercury; PHg: Particulate Mercury; TPM: Total Particulate Mercury; TSP: Total Suspended Particulate; CVAFS: Cold Vapor Atomic Fluorescence Spectrophotometry; HYSPLIT: Hybrid Single-Particle Lagrangian Integrated Trajectory; PSCF: Potential Source Contribution Function
Introduction
Background
Mercury is a highly toxic heavy metal element that occurs widely in soil, water, and the atmosphere [1]. In the 1980s, high contents of methyl mercury were discovered in fish in remote lakes of Northern Europe and North America. As there were no sources of mercury emission near these areas, it was realized that the atmosphere provided a long-range transport for mercury pollution [2,1]. This was supported subsequently by research using numerical models [3-6].
Atmospheric mercury can be divided into three categories according to its form: Gaseous Elemental Mercury (GEM), Reactive Gaseous Mercury (RGM), Particulate Mercury (PHg). Due to the stable properties, gaseous elemental mercury can remain in the atmosphere for up to six months to two years; moreover, it can be transported for long distances, and involved in the global mercury cycle. Reactive gaseous mercury accounts for about 3% of the total gaseous mercury, and it can be spread to dozens to hundreds of kilometers [7]. Emission sources of atmospheric mercury can be either natural or anthropogenic. Natural sources include topsoil, vegetation, ocean and other water bodies, rocks, volcanoes and geothermal activities, and forest fires [8]. It is complex and difficult to accurately estimate mercury emissions from natural sources. Anthropogenic sources of mercury include the burning of fossil fuels (mostly coal), indigenous methods of gold metallurgy, non-ferrous metallurgy, cement manufacturing, waste incineration, and chlor-alkali manufacturing. Emissions of mercury from anthropogenic sources in total are about 2,503 tons annually [9]. Streets et al., studied the method of mercury emission sources list establishment in China provinces and provided different kinds of emission source and mercury emissions in China provinces in 1999 [10]. Pacyna deemed that global anthropogenic activities emitted 2,190 tons of mercury into the atmosphere in 2000, two-thirds of which is attributed to the burning of fossil fuels [11]. Asian countries contribute 54% of mercury emissions, African countries 18%, and European countries 11%. China’s anthropogenic activities emitted 600 tons of mercury into the atmosphere in 2000, which accounted for 28% of global mercury emissions in 2000. Wu Ye established the list of atmospheric mercury emissions from China’s man-made sources of the years 1995-2003 [12]; during this period, the atmospheric mercury emissions increase at a rate of about 2.9% per year, and the mercury emissions of the year 2003 reached 696 tons; wherein the element mercury emissions are 395 tons, the bivalent mercury emissions are 230 tons, and the particle mercury emissions are 70 tons; the mercury emissions of coal burning and non-ferrous metallurgy account for 80% of total mercury emissions. At present, in addition to the study of atmospheric mercury, many scholars in China and other countries have reported a variety of research concerning the atmospheric pollutants transport. Among them backward trajectory and PSCF (Potential Source Contribution Function) results are the important bases of many researches to track atmospheric pollutants pathways and sources. Alexandru Lupu and Willy Maenhaut used PSCF code to identify several atmospheric aerosol source areas [13]. By studying the PSCF results, Ferhat Karaca, Ismail Anil and Omar Alagha worked out the conclusion that seasonal change of the source of atmospheric aerosol arrived in Istanbul, Turkey [14]. Xiao Hui used a backward trajectory model to study the influence of long distance transmission of continental material to chemical composition of tropical precipitation waters [15]. Zhao Heng used backward trajectory model to study the source of O3, SO2, CO during TRACE-P in Hong Kong [16]. Based on PSCF results, Liu Na revealed the transportation pathways and potential source regions of Lanzhou PM10 pollution in spring [17].
China has become the world’s biggest emitter of mercury. Coal and smelting non-ferrous metal are two main mercury emission sources. Shortcomings in the current literature in China can be summarized as lacking the observations of background levels of atmospheric mercury and the supporting information for unexpected air pollution events serving for local government. Shanghai Chongming Island is located in the Yangtze River Estuary, its atmospheric mercury variation can demonstrate the pattern of eastern coast of China; moreover, Chongming Island that has a clean environment is away from the urban area. So, Chongming Island then was selected for long-term continuous atmospheric mercury monitoring. This study aims (i) to provide observations of background levels of atmospheric mercury in the Yangtze River Delta region; (ii) to reveal potential sources of atmospheric mercury pollution in the Yangtze River Delta region.
Methods
Monitoring stations
The atmospheric mercury monitoring station here is located on the roof of the office building of the Chongming Dongtan Birds National Nature Reserve in Shanghai (31°31’20”N, 121°54’30”E; about 11 m height of roof above ground), which is about 5 km from the Dongtan Wetland. The monitoring station is about 50 km from the Shanghai downtown area (People’s Square) and about 30 km from Shanghai suburbs (outer ring expressway). There are no obvious sources of industrial pollution around the monitoring station, and just a small number of residents within a distance of about 5 km Figure 1.
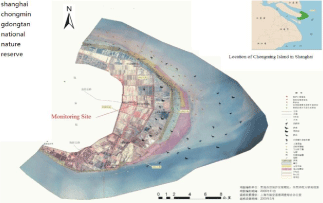
Figure 1: Location of Chongming Island in Shanghai.
Back-trajectory model
To carry out research on the source of atmospheric mercury in the Chongming Island, an analysis of a typical pollution process is performed using the HYSPLIT4 (see https://ready.arl.noaa. gov/HYSPLIT.php) back-trajectory model developed by the Air Resource Laboratory (ARL) of National Oceanic and Atmospheric Administration (NOAA). HYSPLIT is a complex and complete simulation system that can achieve the trajectory calculation, complex diffusion, and sedimentation simulation of a single air mass.
The back-trajectory simulation for a typical pollution process is performed by using meteorological data from the 1 × 1° grid of the Global Data Assimilation System. The simulation time is 48 h, which can cover China, Mongolia, and eastern Russia. Yang Yong-jie, et al., studied the mixed layer thickness in Shanghai from 1990 to 2004; data of thickness are shown in Table 1 and Table 2 [18]. From the table 1, we can conclude that the average thickness of atmospheric mixed layer in the range of 524 ~ 612 m in Shanghai during 1990 to 2004. From the table 2, we can conclude that the average thickness of atmospheric mixed layer of July, August, October and November in the range of 495~640 m in Shanghai during 1990 to 2004. Through the study of Zhao Heng, et al., [16,19] we learn about that the wind field of 500 m can reflect the average flow field characteristics of boundary layer. We can track the possible source of atmospheric mercury in Chongming Island region accurately by the description of the air mass moving path. So we set the height of the starting point as 500 m that means the height of boundary layer, it is commonly believed pollutants can be fully mixed within boundary layer.
    Year
    Thickness/m
    Year
    Thickness/m
    Year
    Thickness/m


    1990
    588
    1995
    533
    2000
    575


    1991
    571
    1996
    610
    2001
    561


    1992
    565
    1997
    612
    2002
    524


    1993
    553
    1998
    591
    2003
    570


    1994
    585
    1999
    572
    2004
    609
Table 1: The average thickness of mixed layer in Shanghai during 1990 to 2004.
    Month
    Thickness/m


    7
    640


    8
    645


    10
    565


    11
    495
Table 2: The average thickness of mixed layer in Shanghai during July, August,
October and November.
PSCF model
The PSCF is a very useful statistical model evolved from the HYSPLIT model (see https://users.ugent.be/~wmaenhau/AE22230/ node4.html), which can be used to identify the source area of atmospheric pollutants (e.g., GEM and CO) with long residence time. The PSCF value in the simulation grids can be calculated through counting the trajectory terminal points in the grids. If the number of trajectory terminal points falling in the grid with line i and column j is nij, and the number of trajectory terminal points corresponding to values of TGM higher than a certain concentration standard (this research adopts the annual average value of TGM) falling in the grid is mij, then the PSCF value (PSCFij) of the grid is defined as:
PSCFij = (mij/nij)W (1)
Wij is an empirical weighting coefficient used to reduce the effect on the simulation results of those grids with values of nij that are too small. Wij in this research is defined according to the following formula, where navg is the average value (nij >0) of the number of all trajectory terminal points in grids.
The PSCF value of the grids stands for the probability of the pollution passing through the grids, and the relative contribution rate of potential source areas can be determined according to the emissions data of atmospheric mercury.
The simulation scope in this research covers mainland China (73.5E–134.5E, 18.5N–53.5N), which is divided into 8,450 grids of 0.5 × 0.5°. The scope of the simulation time is from July 15, 2010 to February 8, 2011, and from March 1 to April 27, 2012. The model simulation adopts TrajStat software, which includes the HYSPLIT back-trajectory model and the module used for producing the statistics of trajectory data. The back-trajectory restarts once per hour and each time the run time is 72 hours. The PSCF results are displayed by using a map drawn with ARCGIS9.3.
Instruments used and its measuring methods
The Tekran Model 2537B Continuous Mercury Vapor Analyzer is used for TGM monitoring in ambient air. It performs continuous, unattended measurements of TGM with an update rate as low as 2.5 minutes and an air detection limit of 0.1 ng (Hg)/m³.
The sensors of the Tekran 2537B conform to, or are equal to, the specifications of EPA Method IO-5 “Sampling and Analysis of Vapor and Particulate Phase Mercury in Ambient Air Utilizing Cold Vapor Atomic Fluorescence Spectrometry”. This method is part of the Compendium of Methods for the Determination of Inorganic Compounds in Ambient Air (EPA/625/R-96/010a).
The entire process can be divided approximately into two: the sampling stage and the analysis stage, or more specifically, dualamalgamation CVAFS.
In the sampling stage, a Teflon® filter pack (outside diameter 1/4 inch) with a glass fiber filter (pore size 0.2 μm, diameter 47 mm) is placed in front of the traps to remove fine particulate material from the air sample. The air sample is pulled through the vapor-phase sampling system by using a mass-flow controlled vacuum pump at a minimal flow rate of 0.3 L min−1. Vapor-phase Hg is collected by using a pure gold cartridge capture without memory effect determined directly by CVAFS.
In the analysis stage, the gold cartridge (sample trap) is heated to release the collected mercury. The desorbed mercury is carried in an inert gas stream (Argon) to a second gold cartridge (analytical trap). The mercury collected on the analytical trap is then thermally desorbed and carried into the CVAFS analyzer (wavelength = 253.7 nm). The resulting voltage peak is integrated to produce a peak area for the sample.
An optical feedback loop for constant lamp intensity and an optical path Argon purge provide a stable and reliable detector. A dual-cartridge design allows for alternate sampling and analysis (desorption), resulting in continuous measurements of mercury in the air every 5 min. The minimum concentration detectable by the Tekran 2537B sensor is 0.1 ng m−3, which is much lower than the concentration of atmospheric TGM.
Here, the analyzer is programmed to sample air at a flow rate of 1.0 L min−1 for a 5-min sampling interval. The TGM observations discussed below are averaged over a one-hour interval to match the time scale of the meteorological parameters.
Data quality control
Two types of data quality control were performed, including self-calibration and manual injection calibration. Self-calibration is executed by the Tekran 2537B itself every 25 hours using an internal permeation mercury vapor source traceable to the National Institute of Standards and Technology standard. Manual injection calibration uses the Tekran 2505 standard mercury vapor source (generator). Standard mercury vapor with outside temperature is extracted and injected into the only-zero-air-passing-by Tekran 2537B. For this artificial measurement, the gold cartridge A and B will alternately output result independently. Errors between gold cartridge A and B must be less than 5%, and errors between three continuous calibrations must be less than 5%.
The sampling period ranged from September 2009 to April 2012. In all, 8,453 items of effective TGM data were obtained per hour with TGM concentrations ranging from 0.70 to 18.37 ng·m−3; the minimum concentration is far higher than the instrumental limit of detection (0.1 ng·m−3).
Because of the the local power failure and the instrument failure caused by lightning, the overall sampling period is divided into three stages.
On average, 2,111 items of TGM data per hour were obtained from September 15 to December 17, 2009 with an average TGM content of 2.50±1.50 ng·m−3.
On average, 3,676 items of TGM data per hour were obtained from July 14, 2010 to February 8, 2011 with an average TGM content of 2.87±1.91 ng·m−3.
On average, 2,666 items of TGM data per hour were obtained from November 28, 2011 to April 27, 2012 with an average TGM content of 1.99±0.95 ng·m−3.
Results
Back-trajectory analysis of two typical pollution events
The episodes from July 29 to August 1, 2010 and from October 30 to November 2, 2010 were chosen as two typical pollution events. On average, 3,676 items of TGM data per hour were obtained from July 14, 2010 to February 8, 2011 with an average TGM content of 2.87±1.91 ng·m−3. The elevated concentrations during the two selected episodes were 2 to 3 times greater than the average TGM concentrations.
HYSPLIT is a tool for identifying the long distance transmission of an air mass, which can be used to track the location of the emission source of atmospheric pollutants. This research performed an analysis on typical pollution events in Chongming Island, and tracked the source of the atmospheric mercury by using the HYSPLIT4 back-trajectory model. The back-trajectory simulation in this research restarted once every six hours, and the start-stop time of the back-trajectory simulation was 00:00 of the current day to 00:00 of the following day. The back-trajectory model adopted UTC time. Therefore, the UTC time used in the model corresponds to 16:00 Local of the previous day to 16:00 Local of the current day.
Figure 2 showed the concentration change in each form of atmospheric mercury and CO during July 29 to August 1, 2010. It could be seen that Chongming experienced a long-duration heavy pollution event during this period. TGM concentrations reached peaks of 7.38 and 9.87ng.m−3 at 10:00 of July 29 and 08:00 of August 1, respectively, and the average concentration was 4.79 ng.m−3. The maximum concentration of RGM and PHg reached 59.5 and 146.9 pg.m−3, respectively, and their average concentrations were 23.5 and 55.2 pg.m−3, respectively. The sources and transport of CO and TGM were similar to each other and thus, the concentration change trends of CO and TGM were almost identical.
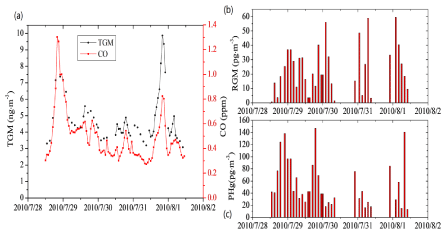
Figure 2: Speciated Atmospheric Mercury and CO Concentration from July 29, 2010 to August 1, 2010.
Figure 3 showed the results of the back-trajectory simulation for July 29 to August 1, 2010. It could be seen that the airflow of Chongming was mainly from the southwest during this period, but that the airflow backed gradually from July 29 to 31, becoming due south. The airflow on July 29 was mainly from the west-southwest, crossing Shanghai, southern parts of Jiangsu, northern parts of Zhejiang, and Anhui. The altitude of the air mass movement showed that its locus during this period maintained a low altitude, and that mercury discharged from various regions along its path resulted in high concentrations of TGM and PHg in Chongming. The air mass arriving at Chongming on July 30 was mainly from the southwest, crossing Zhejiang, Anhui, and Jiangxi. The altitude of the air mass movement was mainly between 500m and 1,000 m, so that the air mass was influenced little by emission sources along its path, although it dropped to about 500 m near Chongming. Because the air mass bypassed the urban district of Shanghai, or passed across the border of southeastern Shanghai, concentrations of TGM and PHg were detected to be lower compared with July 29. At 06:00 on July 30, the air mass arriving at Chongming had passed across central Shanghai at a height of about 500 m.
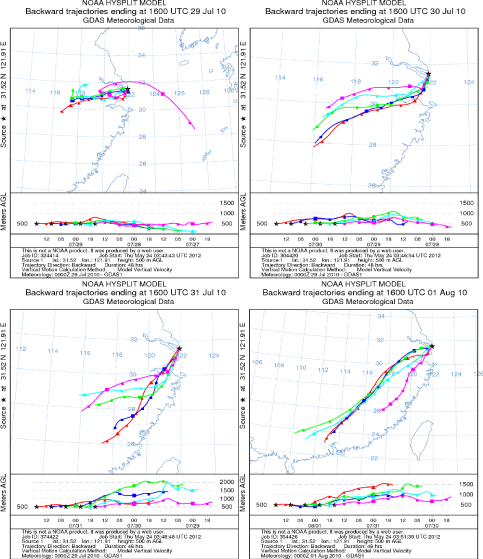
Figure 3: Backward Trajectory Simulation Results from July 29, 2010 to August 1, 2010.
Figure 2 showed that the concentration of PHg reached a peak at 07:00 on that day, which indicated that this concentration peak resulted from the emission sources of central Shanghai. The air mass on July 31 was mainly from the west-southwest, crossing Zhejiang, Fujian, and Jiangxi. However, the TGM concentration was similar to that of July 30, because the air mass movement locus during this period was centered mainly on the upper atmosphere with little pollution. The peak TGM concentration occurred again on August 1, and the average concentration was much higher than that of the previous two days. The movement locus of the air mass deflected to the west, and the air mass was more from the southwest compared with July 31, crossing Guangdong, Jiangxi, Anhui, Zhejiang, Jiangsu, and Shanghai urban district. The altitude change of air mass movement showed that the altitude was reduced to about 500 m after it arrived at the Shanghai urban district, and that prior to this, the air mass had moved mainly in the upper atmosphere. Thus, the TGM concentration on August 1 was influenced mainly by emissions from the Shanghai urban district.
In conclusion, according to the movement locus and altitude change of the air mass, the heavy pollution event at Chongming from July 29 to August 1, 2010, was influenced mainly by airflow from the southwest. The TGM concentration on July 29 was influenced mainly by emissions from Shanghai, southern parts of Jiangsu, northern parts of Zhejiang, and Anhui, whereas that on August 1 was influenced mainly by emissions from the Shanghai urban district.
Figure 4 showed the changes in concentration of the various forms of atmospheric mercury and CO from October 30 to November 2, 2010. Average TGM concentration was 7.00 ng m−3. TGM concentration started rising from October 30 and peaked at 18.11 ng.m−3 at 08:00 on November 1, but started dropping again on November 2. Average PHg concentration in this period was 50.3 pg.m−3 with a maximum concentration of 315.9 pg.m−3, which indicated that Chongming experienced a serious heavy pollution event during this period.
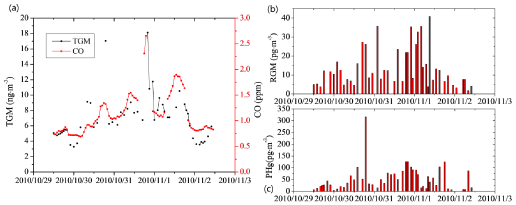
Figure 4: Speciated Atmospheric Mercury and CO Concentration from October 30, 2010 to November 2, 2010.
Figure 5 showed the results of the back-trajectory simulation of this heavy pollution event. It could be seen that the airflow in Chongming was mainly from the north and northwest; the airflow on October 30 was mainly from the north, deflecting to the northwest on October 31 and November 1. However, the airflow direction deflected to the north again on November 2. The change of direction of airflow source corresponded to the change of TGM concentration. The TGM concentration in Chongming rose as the direction of the air source deflected to the west, and then reduced as the direction deflects back north. The sources of TGM of Chongming were mainly Liaoning and Shandong on October 30, Shandong and Jiangsu on October 31, Shandong on November 1, and Liaoning and Inner Mongolia on November 2. The air mass was mainly from the upper atmosphere (>2000 m) after 12:00 of the current day; thus it carried little pollution and TGM concentrations dropped significantly during this period.
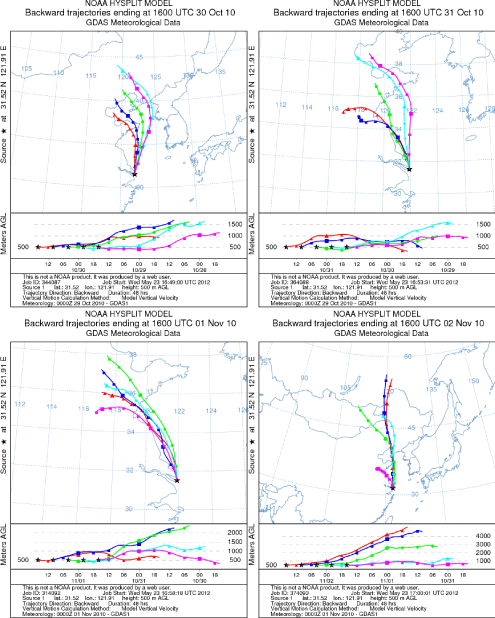
Figure 5: Backward Trajectory Simulation Results from October 30, 2010 to November 2, 2010.
Thus, the change of TGM concentration in this pollution event was influenced mainly by the direction of airflow source. The atmospheric mercury carried by the airflow from the northwest (Jiangsu and Shandong) was much greater than that carried by airflow from the north (Liaoning and Inner Mongolia). The first reason for this was that the emission intensity of anthropogenic mercury in Jiangsu and Shandong was larger than that in Liaoning and Inner Mongolia (Figure 7). The second reason was the greater distance of Liaoning and Inner Mongolia from Chongming.
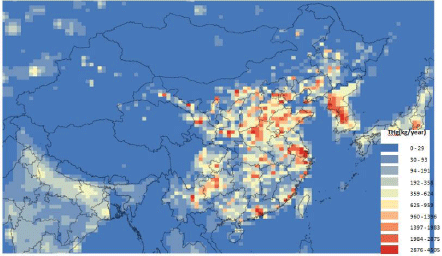
Figure 7: Anthropogenic Sources of Mercury Emissions in China 2007.
PSCF mode analysis
The back-trajectory was used mainly to analyze the movement locus of the air mass in typical pollution events, whereas the PSCF model was required to analyze the long-term distribution and potential emission areas. In this research, the simulated time ranges of the PSCF model were from July 15, 2010 to February 8, 2011 (summer, autumn, and winter), and from March 1 to April 27, 2012 (spring).
Figure 6(a–d) showed the simulated results of the spatial distribution of PSCF value for summer, autumn, winter, and spring, respectively. The PSCF value referred to the probability of airflow passing through the grid when the pollution process occurs, and the greater the PSCF value, the greater the possibility that this grid was the potential source of the atmospheric mercury at Chongming.
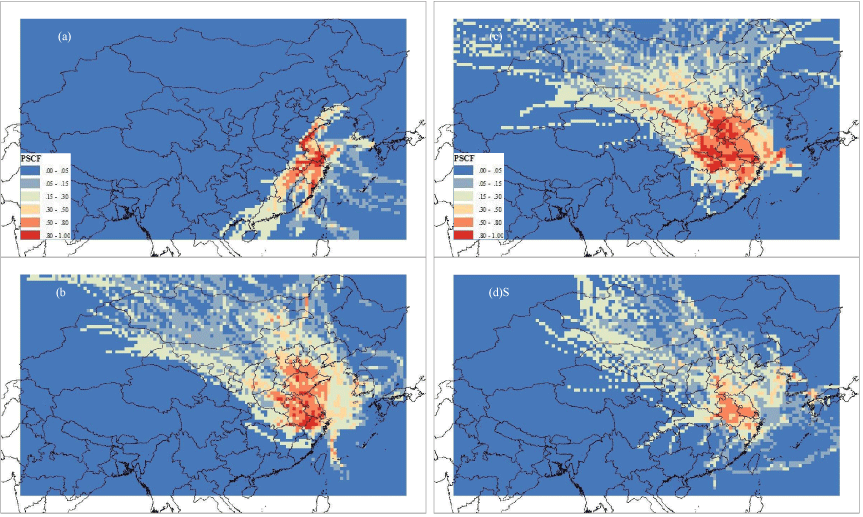
Figure 6: PSCF simulation results.
Figure 6(a) showed the distribution of TGM and PSCF values at Chongming in summer. The TGM at Chongming in summer was mainly from the southwest and northwest, including Shanghai urban area, Jiangsu, Zhejiang, Anhui, and Jiangxi, and sometimes Guangdong and Fujian.
Figure 6(b & c) showed the distributions of PSCF values in autumn and winter, respectively. It could be seen that the distributions of PSCF in autumn and winter were similar, and that the PSCF value in the northwest was higher. However, in general, the PSCF value in winter was higher than that in autumn, because the higher TGM concentrations in winter mean more frequent heavy pollution events. The areas with larger PSCF values in autumn and winter mainly included Shanghai urban district, Jiangsu, Anhui, Shandong, Zhejiang, Henan, and Hebei.
Figure 6(d) showed the distribution of PSCF value in the region surrounding Chongming in spring. Obviously, the PSCF value in this region in spring was lower than that in the other three seasons. The areas with higher PSCF values were mainly to the west and northwest, including Anhui, Jiangsu, and Shanghai urban district.
In general, the areas with higher PSCF values in summer included Shanghai urban district, Jiangsu, Zhejiang, Anhui, and Jiangxi. Those in autumn and winter were Shanghai urban district, Jiangsu, Anhui, Shandong, Zhejiang, Henan, and Hebei. Those in spring were Anhui, Jiangsu, and Shanghai urban district. According to the 2007 list of anthropogenic sources of mercury emission in China, Shandong, Henan, Hebei, Jiangsu, Zhejiang, and Anhui discharged the largest amounts of mercury.
According to the wind direction analysis and spatial attribution simulation using HYSPLIT model and PSCF model, the atmospheric mercury of Chongming Island mainly came from industrial area of east China, especially in the northwest and southwest wind direction, including Jiangsu, Shandong, Zhejiang Province and Shanghai city. So, if any pollution puffs carrying mercury across Chongming Island, the surge of concentration could report this. Also, this was the aim of establishment this monitoring station in Chongming Island. The location of Chongming station was between China mainland and the Pacific Ocean. The fluctuations of air mass concentration could directly demonstrate the behaviors of the air puff crossing this station. So, the Shanghai government and Shanghai Environment Monitoring Center formally requested the data support in EXPO 2012. The data from Chongming station was valuable for early warning of air pollution in Shanghai. Also, the “heavy” pollution events were defined by Shanghai Environment Monitoring Center.
Conclusion
The HYSPLIT4 and PSCF models were used to analyze heavy pollution events and tracked the sources of atmospheric mercury.
The back-trajectory model was used to analyze the two heavy pollution events in summer and autumn. The results indicated that heavy pollution events at Chongming from July 29 to August 1, 2010 were influenced mainly by airflow from the southwest. The TGM concentration peaked on July 29 and August 1, and the TGM was derived mainly from Shanghai urban district, southern parts of Jiangsu, Zhejiang, Anhui, and Jiangxi. The heavy pollution event from October 30 to November 2, 2010 was influenced mainly by airflow coming from the northwest. The Jiangsu and Shandong areas provided the greatest contribution to TGM concentration during this period.
Simulated results of the PSCF model showed that the greatest contribution to TGM at Chongming in summer was provided by Shanghai urban district, Jiangsu, Zhejiang, Anhui, and Jiangxi, located to the southwest and northwest. In autumn and winter, it was provided by Shanghai urban district, Jiangsu, Anhui, Shandong, Zhejiang, Henan, and Hebei, and in spring, it was provided by Anhui, Jiangsu, and the Shanghai urban district. Jiangsu and Shandong to the northwest provided the greatest contribution to atmospheric mercury at Chongming throughout the year, followed by the Shanghai urban district and Zhejiang to the southwest. Applications of this study serve for the analysis of atmospheric mercury characteristics in the longrange transport along the east coast of China. Also, the atmospheric mercury concentration across the sea land demarcation line can be estimated. Further, in Okinawa Japan, there is an atmospheric mercury monitoring station. If the atmospheric mercury concentration can be known in both sides, we can estimate the attenuation rate when the puffs move from China’s mainland to Okinawa Island.
This paper provided an analytical basis for investigating periods of high pollution for the Shanghai early warning mechanism, so as to reduce the negative impacts associated with unexpected air pollution events.
Any measurement method has its drawbacks. The only reason for using the Tekran 2537B is the comparability of observations. The use of the Tekran 2537B sensor is required by the National Atmospheric Deposition Program (NADP; a consortium comprising NOAA, EPA, USGS, and academic institutions) for measurements of atmospheric mercury concentrations. The NADP program would reject data collected and submitted to the national archive if being obtained by any other sensors. This requirement is in place so that all the NADP sites (including NOAA’s three sites) are instrumented identically, and they follow identical procedures. Another limitation can be summarized as only one atmospheric mercury monitoring station lied in the trajectory. So, we lack the comparison of different observations.
Acknowledgment
The study is financially supported by financially supported by the BJAST for ROCS, National Natural Science Foundation for the youth (NO.41105099 & 41365009) and Guizhou Science and Technology Foundation (Guizhou Contract of J [2012] 2191).
References
- Lindqvist O, Jernlov A, Johansson K, Bringmark L, Timm B, Aastrup M, et al. Mercury in the Swedish environment-recent research on causes, consequences and corrective methods. Water Air Soil Pollut. 1991; 55: 1-261.
- Gochfeld M. Cases of mercury exposure, bioavailability, and absorption. Ecotox Environ Safe, 2003; 56: 174-179.
- Banic CM, Beauchamp ST, Tordon RJ, WH Schroeder, Steffen A, Anlauf KA, et al. Vertical distribution of gaseous elemental mercury in Canada. J Geophys Res-Atmos, 2003: 108.
- Dastoor AP, Larocque Y. Global circulation of atmospheric mercury: A modelling study. Atmos Environ, 2004; 38: 147-161.
- Seigneur C, Karamchandani P, Lohman K, Vijayaraghavan K. Multiscale modelling of the atmospheric fate and transport of mercury. J Geophys Res-Atmos, 2001; 106: 27795-27809.
- Travnikov O, Ryaboshapko A. Modeling of mercury hemispheric transport and depositions. MSC-E Technical Report. Meteorological Synthesizing Centre-East, Moscow, Russia. 2002.
- Slemr F, Schuster G, Seiler W. Distribution, speciation and budget of atmospheric mercury [J]. Journal of Atmospheric Chemistry.1985; 3: 407-434.
- Schroeder WH, Munthe J. Atmospheric mercury - An overview. Atmos Environ. 1998; 32: 809-822.
- Pirrone N, Mason R. Mercury Fate and Transport in the Global Atmosphere: Measurements, Models and Policy Implications. Interim Report of the UNEP Global Mercury Partnership Mercury Air Transport and Fate Research Partnership area. 2008.
- Streets DG, Hao JM, Wu Y, Feng X. Anthropogenic mercury emissions in China. Atmos Environ. 2005; 39: 7789-7806.
- Pacyna EG, Pacyna JM, Steenhuisen F, Wilson S. Global anthropogenic mercury emission inventory for 2000. Atmos Environ, 2006; 40: 4048-4063.
- Wu Ye, Wang S X, Streets DG, Hao J, Chan M, Jiang J. Trends in anthropogenic mercury emissions in China from 1995 to 2003. Environ Sci Technol. 2006; 40: 5312-5318.
- Lupu A, Maenhaut W. Application and comparison of two statistical trajectory techniques for identification of source regions of atmospheric aerosol species. Atmospheric Environment. 2002; 36: 5607-5618.
- Karaca F, Anil I, Alagha O. Long-range potential source contributions of episodic aerosol events to PM10 profile of a megacity. Atmospheric Environment. 2009; 43: 5713-5722.
- Hui X, Zhi-lai S, Mei-yuan H. Effects of long-rangatmospheric transport of terrestrial materials on the chemical composition of tropical west pacific precipitation. Acta Scientiae Circumstantiae [J]. 1995; 15: 17-22.
- Heng Z, Ti-jian W, Fei J, Min X. Investigation into the source of air pollutants to Hong Kong by using backward trajectory method during the TRACE-P Campaign. Journal of Tropical Meteorology [J]. 2009; 25: 181-186.
- Na L, Ye Y, Jin-bei C. A study on potential sources and transportation pathways of PM10 in spring in Lanzhou [J]. Trans Atmos Sci. 2012; 35: 477-486.
- Yong-jie Y, Jian-guo T, You-fei Z, Shun-hua C. Study on the atmospheric stabilities and the thickness of atmospheric mixed layer during recent 15 years in Shanghai. Scientia Meteorologica Sinica [J]. 2006; 26: 536-541.
- Qian-biao Z, Ming H, Yi-hua Z. Study of source distribution and transportation characteristics of PM2.5 in Shanghai using backward trajectory model. Shanghai Environmental Monitoring Center [J]. 2014; 26: 22-26.