
Research Article
Austin Biomark Diagn. 2023; 5(1): 1027.
Investigation of the Differential Expression and Diagnostic Value of Microrna-21-5p and Microrna-125b-5p in Patients with Type 2 Diabetes Mellitus and Mild Cognitive Impairment
Yang Mingyue1,2*; Wang Jue1,2; Liu Enlin1,3; Zhang Shuxin1,2; Wang Gaoyuan5; Yang Shufang1,3,4
1Taizhou People’s Hospital Affiliated to Nanjing Medical University, China
2Dalian Medical University, Dalian, China
3Taizhou People’s Hospital, the Fifth Affiliated Hospital of Nantong University, China
4School of Medicine of Southeast University, China
5Graduate School of Nanjing University of Chinese Medicine, China
*Corresponding author: Yang Mingyue Taizhou People’s Hospital Affiliated to Nanjing Medical University, Taizhou, Jiangsu 225300, China. Email: yangsufang@njmu.edu.cn
Received: April 04, 2023 Accepted: May 03, 2023 Published: May 10, 2023
Abstract
Objective: To investigate the differential expression of microRNA-21-5p (miR-21-5p) and microRNA-125b-5p (miR-125b-5p) in patients with Type 2 Diabetes Mellitus (T2DM) and Mild Cognitive Impairment (MCI), and to evaluate their potential value as biomarkers in patients with T2DM and MCI (T2DM+MCI).
Methods: In this study, the Montreal Cognitive Assessment (MoCA) was used to assess cognitive function. The differentially expressed miRNAs were screened by second-generation high-throughput sequencing of 8 human whole blood samples. The 60 patients were verified by Real-time fluorescence quantitative Polymerase Chain Reaction (qRT-PCR).
Results: The expressions of miR-21-5p and miR-125b-5p in whole blood in T2DM+MCI group were significantly higher than those in T2DM+nMCI group. Spearman correlation analysis suggested that the expression levels of miR-21-5p and miR-125b-5p were negatively correlated with MOCA scores. ROC curve showed that the area under the curve of miR-21-5p was 0.724, the sensitivity was 0.633, the specificity was 0.833, the 95% confidence interval was 0.5955-0.854, and the optimal cut-off value was 7.457. The area under the curve of miR-125b-5p was 0.686, the sensitivity was 0.6, and the specificity was 0.767. The 95% confidence interval is 0.549-0.822, and the optimal cut-off value is 4.523.
Conclusions: miR-21-5p and miR-125b-5p were up-regulated in T2DM+MCI patients, and their expression levels were negatively correlated with MOCA scores. miR-21-5p and miR-125b-5p may be biomarkers for the diagnosis of T2DM+MCI patients.
Introduction
T2DM has been a major health hazard worldwide, and its global incidence continues to rise. Alzheimer's Disease (AD) is the most common neurodegenerative disease at present, accounting for nearly 80% of the global dementia population [1]. Dementia caused by Diabetes Mellitus (DM) can be divided into the following two types: One is neurocognitive dementia (VaD), which is directly related to DM. The other is that DM causes serious endocrine neurodegeneration -- AD. MCI is the stage that occurs between normal neurodegenerative aging and AD [2]. Studies have reported that DM patients are at risk of developing cognitive impairment, which is also known as “DM-related cognitive dysfunction” [3-5]. Severe cognitive impairment may be a new long-term complication of T2DM. Therefore, early identification of MCI can delay the onset of AD.
miRNAs are non-coding Rnas composed of 18-25 nucleotides [6], which have been reported as important targets for the diagnosis and treatment of AD [7,8]. Studies have shown that highly expressed or specifically expressed miRNAs found in brain tissues account for more than half of detectable miRNAs [9]. Studies have shown that cognitive impairment is related to hippocampus of rats [10]. Hippocampus tissue is the golden standard for cognitive impairment, but it is difficult to achieve clinically. Cerebrospinal fluid detection requires lumbar puncture, which is an invasive operation and cannot be obtained from a large number of patients. Since detecting blood samples is a relatively economical and minimally invasive method, the measurement of miRNAs expression patterns in blood has become an effective new diagnostic tool and a promising prognostic biomarker for the diagnosis of neurological diseases. The purpose of this study was to investigate the differential expression of miRNAs in T2DM+MCI patients and to evaluate their potential value as biomarkers.
Materials and Methods
Research Objects
This research plan was reviewed and approved by the Ethics Committee of Taizhou People's Hospital. Subjects who met the standards and gave informed consent to join the study were informed of the purpose of the study and signed informed consent. The study subjects were hospitalized patients in Taizhou People's Hospital from March 2022 to August 2022, including 4 patients in T2DM+MCI group and 4 patients in T2DM+nMCI group, Second-generation high-throughput sequencing was performed. There were 30 patients in T2DM+MCI group, and 30 patients in T2DM+nMCI group were verified by qRT-PCR.
Inclusion Criteria and Exclusion Criteria
The inclusion criteria of T2DM group were:: (1) Typical symptoms of DM + random blood glucose ≥11.1mmoL/L; (2) Oral Glucose Tolerance Test (OGTT) blood glucose ≥11.1mmoL/L for 2 hours; (3) Fasting blood glucose ≥7.0mmoL/L; (4) HbA1C≥6.5%. If one of the four criteria is met and the typical symptoms of DM (such as polydipsia, polyuria, hypereating, and weight loss) are present, T2DM is diagnosed. Patients with a clear history of T2DM were included in this study even if their blood glucose level failed to meet the diagnostic criteria for T2DM under the action of hypoglycemic drugs.
Excluded diagnostic criteria: (1) patients with acute complications such as diabetic ketoacidosis and acute infectious lesions; (2) Patients with severe hepatic and renal insufficiency; (3) Patients with other neuroendocrine diseases; (4) Patients with personal history of malignant tumor and mental illness; (5) Patients who have had weight-loss surgery in the past or are currently taking weight-loss medications; (6) Patients with chronic wasting diseases, anemia, and severe malnutrition; (7) Patients with cerebrovascular disease, brain trauma, stroke, intracranial tumor, history of craniocerebral surgery, toxic encephalopathy, Parkinson's disease, congenital mental impairment, epilepsy, major depression and other patients with serious impact on cognitive function evaluation; (8) Patients with hearing impairment and mental disorders; (9) Illiterate patients who refused to participate in the study.
MoCA Evaluation Basis and Grouping
MoCA scale is commonly used to assess cognitive function, mainly applicable to patients with high education level. Due to its high sensitivity, MoCA is widely used in clinical screening of cognitive function. MoCA involves eight test items including attention, memory, language expression ability and orientation, with a total score of 30 points. a score greater than 26 points is considered as normal cognitive function, and Less than 26 points is considered as cognitive impairment. When the age of education of the subject is less than 12 years, one point will be added. The following points should be noted in the scoring process: (1) Two professionally trained physicians from the research group should conduct the test. During the testing process, standardized language should be used to communicate with the tested subjects, and the MoCA score of the tested subjects should be the average of the two. (2) Select a quiet room, inform the patients of the purpose of the test, and obtain the understanding and support of the tested subjects; (3) If there are interference behaviors such as phone answering during the test, the test should be canceled and assessed at another time. According to MoCA scale, the patients were divided into two groups: T2DM+MCI group T2DM +nMCI group.
Experimental Reagents and Instruments (Table 1)
Instruments and reagents
Company name
Trizol reagent
chloroform
Isopropyl alcohol
Anhydrous ethanol
DEPC Water (DNase/RNase free)
U6/ target gene primer
Fluorescent quantitative PCR 8 tubes & lid
PCR kit
cDNA kit
BD PAXgene Blood RNA Tube Whole blood RNA tube
5ml EDTA-K3 vacuum sampling vessel
2ml frozen storage tube
Enzyme Free 1.5ml/0.2ml EP tube
Suction head (1000ul, 200ul, 20ul, 10ul)Invitrogen USA
Shanghai Sangong Biological Engineering Co., LTD
Shanghai Sangong Biological Engineering Co., LTD
Shanghai Sangong Biological Engineering Co., LTD
Nanjing Minghong Biotechnology Co. LTD
Nanjing Minghong Biotechnology Co. LTD
Nanjing Minghong Biotechnology Co. LTD
Nanjing Minghong Biotechnology Co. LTD
Nanjing Minghong Biotechnology Co. LTD
Hangzhou Xinran Biotechnology Co., LTD
Greiner VACUETTE, Germany
Haimen Jinyun Glass Instrument business Department
Nanjing Minghong Biotechnology Co. LTD
Nanjing Minghong Biotechnology Co. LTDMedical ultra-clean workbench
Centrifuge
Oscillator
NanoDrop ND-2000 spectrophotometer
PCR Amplification Instrument (PCR system9700)
-200 refrigerator
-800 ultra-low temperature refrigeratorSuzhou purification equipment factory
Haimenqi Limber Instrument Manufacturing Co. LTD
Haimenqi Limber Instrument Manufacturing Co. LTD
Thermo Fisher Technology Co., LTD
Applied Biological Systems (ABI) Inc
Haier Co. LTD
Sanyo Corporation of Japan
Table 1: Main instruments and reagents.
Methods
Clinical Data Collection
Gender, age, years of education, BMI, waist circumference, hip circumference and biochemical indexes of the enrolled patients were collected.
Sample Collection and Pretreatment
Whole blood from 4 patients with T2DM+MCI and 4 patients with T2DM+nMCI were collected and placed in collection vessels for second-generation high-throughput sequencing. Sixty 2ml whole blood samples were taken and placed in sterile, vacuum-free 2ml cryopreservation tubes, and then labeled and frozen at -80oC for later use.
Second-Generation High-Throughput Sequencing
Peripheral blood samples from 4 hospitalized T2DM+MCI patients and another 4 hospitalized T2DM+nMCI patients were included for second-generation high-throughput sequencing, respectively, to obtain the differential expression of miRNAs in peripheral blood of T2DM+MCI patients and T2DM+nMCI patients. The second-generation high-throughput sequencing of miRNA was performed using Illumina's Hiseq Single-End mode, and the comparison between Unique Reads and reference genome sequences was performed using miRDeep2 (Mackowiak SD, 2011) software. The expression of miRNAs in according to the sample data, USES the DESeq method (version 1.18.0, Anders and Huber SW, 2010) of the sample to analyze differentially expressed miRNAs, and in strict accordance with the express quantity ratio difference (| log2FoldChange |>1) and P<0.05 to screen out different conserved miRNAs.
Bioinformatics Analysis
In this study, GO enrichment analysis and KEGG pathway analysis were performed for target genes of differentially expressed miRNAs that have been screened and detected.
1) Extraction of Total RNFrozen peripheral blood was taken out in the refrigerator at -80oC. After thawing, 600ul whole blood sample was taken out and added into 2.0ml enzyme-free EP tube containing 1ml Trizol-LS reagent, and blown repeatedly;
2) Add 0.2ml chloroform solution (do not put it into the EP tube), vortex shake until 15s, incubate on ice for 10 minutes, centrifuge immediately after the first stratification. Centrifuge speed 12000rpm, 15 minutes, 4oC;
3) Absorb about 600ul of the supernatant into a new EP tube, add the same volume of isopropyl alcohol, reverse the upper and lower directions, incubate at -20oC for 10 minutes, centrifuge at 12000rpm for 10 minutes, 4oC;
4) Discard the supernatant, use the gun to suck it away, add 1ml75% ethanol, vortex shake well, 7500rpm, 10 minutes, 4oC;
5) Discard the supernatant, suck it away with a gun, add 1ml anhydrous ethanol and shake it well in a vortex at 7500rpm for 10 minutes at 4oC;
6) Discard the supernatant, suck it away with a gun, dry and precipitate at room temperature;
7) Precipitation dissolved in 20ulDEPC water, blow.
RNA Concentration and Purity Detection
1) Absorb 0.1μl Rnase Free H2O on Nano Drop ND-2000 spectrophotometer measuring base for correction and zeroing.
2) Inject about 0.1μl RNA stock solution into the very fine hole in the middle of the measuring base, and use NanoDrop ND-2000 spectrophotometer to determine the concentration of RNA and detect the absorbance (OD) ratio of A260/A280. When OD ratio ranges from 1.8 to 2.0, RNA purity is considered to be generally acceptable. The closer OD ratio is to 2.0, the higher purity level is. When the ratio & lt; 1.8~2.2, indicating that there is potential contamination of proteins or phenols in RNA.
3) Repeat the above steps clean the measuring base three times before each test, measure the purity and concentration of all samples successively, and conduct reverse transcription.
Reverse Transcription of total RNA into cDNA (Table 2)
    Component

    Volume


    2X miRNA cDNA Snthesis SuperMix

    10ul


    RNA template

    Variable(200ng small RNA or 2ug total RNA)


    Enzyme Mix

    2ul


    Nuclease-free H2O

    Up to 20ul
Table 2: Configuration of retrotranscriptional response system.
1) Thaw each component thoroughly, and add each component according to the figure below, the whole process on the ice;
2) Gently mix the reaction, and then centrifuge briefly;
3) The mixture is incubated at 37oC for about 30 minutes, then at 50oC for about 15 minutes, and finally heated at 85oC for 5 minutes to immediately stop the reaction; Store at -20oC in the freezer.
Real-Time Fluorescence Quantitative PCR Verification
1) Configure the reaction system according to Table 3 and 4, and conduct the whole process on the ice;
    Component

    Volume


    MegaFiTM Fidelity 2X PCR MM

    12.5ul


    Forward Primer(10uM)

    1ul


    Reverse Primer(10uM)

    1ul


    Template DNA

    Variable(100ng genomic DNA)


    Nuclease-free H2O

    up to 25ul
Table 3: Configuration of qRT-PCR reaction system.
Step
Temperature
Time
Initial Denaturation
980
30 sec
25-35C cles
980
50-720
7205-10 sec
10-30 sec
20-30 sec/kb2Final Extension
720
2 min
Table 4:
2) The total reaction system volume was 25μl, and each sample was set with two multiple pores (average value was taken for statistical calculation).
3) Finally, 8 tubes in the pre-configured qPCR reaction system were put into the real-time fluorescence quantitative PCR instrument that had been set up in advance to start the qPCR reaction program;
4) CT values of all holes were recorded, and the mean value of multi-hole Ct values of each group of samples was taken for statistical analysis. Take U6 as the internal parameter; The relative expression levels of miR-21-5p and miR-125b-5p were calculated by 2-△△ CT.
Statistical Methods
SPSS 27.0 software was used for statistical analysis of this study. Chi-square test was used to compare counting data. Mean±Standard Deviation was used for measurement data. The comparison between the two groups of data was performed by T-test. Spearman statistical method was used for correlation analysis. The diagnostic value was evaluated by comparing ROC curve and Area Under Curve (AUC). The relative quantitative analysis of qRT-PCR data was performed by 2-△△CT method. P<0.05 was statistically significant. Drawing method using Graphpad and Prism 8.0 drawing software.
Results
Comparison of General Data Between the two Groups
Comparison of general data between the two groups of second-generation high-throughput sequencing population: In this study, a total of 8 patients underwent second-generation high-throughput sequencing, There were 4 cases in T2DM+MCI (2 males and 2 females) group and T2DM+nMCI (2 males and 2 females) group seperately. There were no significant differences between the two groups in age, years of education, course of disease, BMI, HbA1c and other indicators (P>0.05) For details, Table 5.
Variable
T2DM+MCI (n=4)
T2DM (n=4)
P
Age (years)
Years of education (years)55.75±6.85
9.5±3.3261.50±5.07
10.75±5.060.226
0.694Course of disease (years)
8.00±2.94
7.25±5.12
0.808
BMI (kg/m2)
25.22±2.85
26.71±4.67
0.605
Waist circumference (cm)
94.00±14.17
95.75±19.96
0.891
Hip circumference (cm)
95.25±6.70
102.25±21.39
0.555
HbA1c (%)
8.80±0.77
7.45±1.15
0.099
FPG (mmol/L)
7.42±1.22
7.19±1.33
0.809
TC (mmol/L)
3.50±0.89
5.06±1.33
0.097
TG (mmol/L)
1.63±0.47
2.27±0.82
0.228
HDL-C (mmol/L)
ALT (U/L)
AST(U/L)
BUN (mmol/L)
CR (umol/L)
UA (umol/L)1.05±0.38
25.75±9.64
22.50±5.57
5.71±1.71
51.96±21.83
276.25±87.720.98±0.10
45.50±10.78
35.50±17.75
6.41±2.18
78.10±18.51
331.00±94.390.708
0.145
0.212
0.629
0.118
0.428
Table 5: General data of 8 patients with second-generation high-throughput sequencing.
Comparison of General Data of the two Groups Cerified by qRT-PCR
A total of 60 patients were enrolled in this study, including 30 patients in T2DM+MCI group and 30 patients in T2DM+nMCI group. Age, years of education, course of disease and HbA1c were statistically significant between the two groups (P<0.05), but there were no significant differences in BMI, FPG, HDL-C, ALT, AST and other indexes. Details of the above characteristics are shown in Table 6.
Variable
T2DM+MC(n=30)
T2DM+nMCI(n=30)
P
Age (years)
Gender (male/female)58.17±5.75
17/1351.87±8.06
20/10<0.001
0.426Years of education (years)
8.87±2.34
11.20±4.28
0.010
Course of disease (years)
10.03±3.76
6.37±3.63
<0.001
BMI (kg/m2)
23.97±2.81
23.92±3.31
0.950
Waist circumference (cm)
90.67±9.17
90.52±10.12
0.956
Hip circumference (cm)
96.33±7.23
95.92±6.63
0.831
HbA1c (%)
10.96±2.38
9.13±2.60
0.006
FPG (mmol/L)
6.85±2.50
8.21±3.53
0.105
TC (mmol/L)
4.76±1.85
4.12±0.93
0.100
TG (mmol/L)
2.27±2.89
1.81±1.08
0.423
HDL-C (mmol/L)
ALT (U/L)
AST (U/L)
BUN (mmol/L)
CR (umol/L)
UA (umol/L)1.09±0.26
20.31±13.87
20.90±7.83
6.11±1.35
64.04±22.25
309.75±98.850.97±0.23
26.03±18.22
24.45±17.02
7.08±6.27
80.87±118.38
310.86±95.770.078
0.184
0.312
0.424
0.488
0.966
Table 6: Comparison of general data between the two groups verified by qRT-PCR.
Results of Second-Generation High-Throughput Sequencing
The differential expression of miRNAs in whole blood samples of the two groups was obtained by second-generation high-throughput sequencing technology. Compared with T2DM+nMCI group, to | log2 Fold Change | 1, P<0.05 as the standard, 39 differentially expressed miRNAs were obtained, among which 28 were up-regulated and 11 were down-regulated. The overall distribution of differentially expressed miRNAs could be more directly observed by drawing the volcano map (Figure. 1).
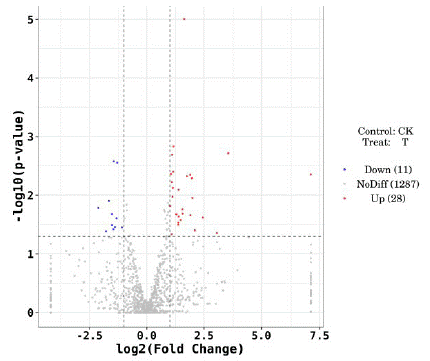
    Figure 1: Volcanic map showing differentially expressed miRNAs.

Note: The x-coordinate is log2 (fold Change), the y-coordinate is -log10 (p value), the T group represents T2DM+MCI group, and the CK group represents T2DM+nMCI group)
GO Enrichment Analysis
GO enrichment analysis was performed on the target genes of differentially expressed miRNAs, including the following 3 levels: Biological Process (BP), Cellular Component (CC), and Molecular Function (MF). GO enrichment analysis showed that, at the BP level, differentially expressed miRNAs were mainly related to promoting nervous system development, regulating cell metabolism, cell surface receptor signaling pathways, and regulating primary metabolic processes. At the CC level, differentially expressed miRNAs were mainly related to neuronal projection, postsynaptic and cell binding. At MF level, differentially expressed miRNAs are mainly related to sequence specificity of transcription regulatory region, nucleic acid binding of regulatory region, and activity of binding transcription factors (Figure 2).
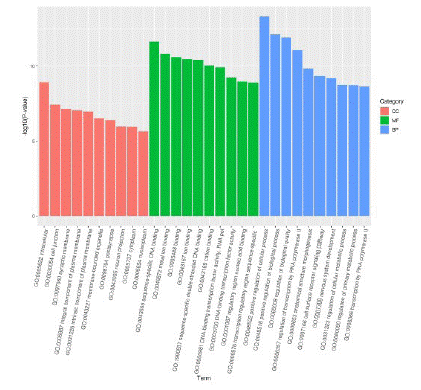
    Figure 2: Volcanic map showing differentially expressed miRNAs.

Note: The x-coordinate is log2 (fold Change), the y-coordinate is -log10 (pvalue), the T group represents T2DM+MCI group, and the CK group represents T2DM+nMCI group)
According to the GO enrichment results, the top 20 items with the most obvious enrichment were selected for bubble map display, which were mainly related to the regulation of nervous system development, neuronal projection, cell metabolic process and cell surface receptor signaling pathways (Figure 3).
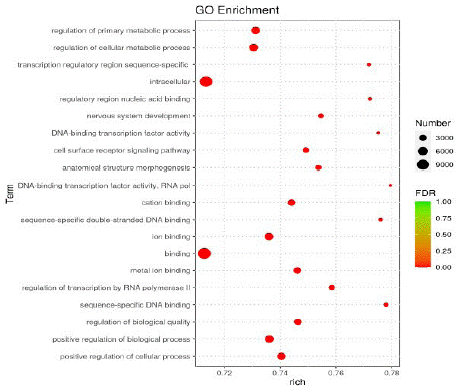
    Figure 3: Bubble diagram of GO enrichment analysis.

Note: The horizontal axis represents the degree of enrichment, the vertical axis represents the items of enrichment, the circle represents the number of miRNAs, and the color represents the significance of enrichment.
KEGG Pathway Analysis
KEGG pathway analysis showed that some enrichment pathways related to differentially expressed miRNAs include type II diabetes mellitus, phosphoinositol metabolism, tumor necrosis factor signaling pathway, growth factor signaling pathway, phosphatidyl inositol signaling system, MAPK signaling pathway, and AMPK signaling pathway (Figure 4).
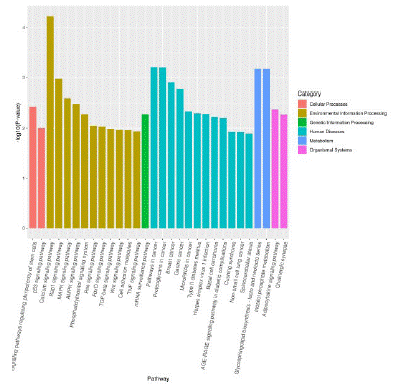
    Figure 4: Histogram of enrichment results of KEGG Pathway.

Note: The abscissa represents the path name and the ordinate represents the enrichment significance.
According to the KEGG enrichment results, the top 20 channels with the most obvious enrichment were displayed in bubble map. As shown in Figure 5, it is mainly related to type II diabetes, cancer pathway and MAPK signaling pathway.
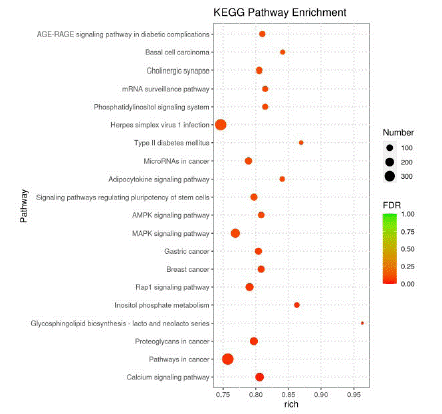
    Figure 5: Bubble diagram of KEGG enrichment analysis.

Note: The horizontal axis represents the degree of enrichment, the vertical axis represents the name of the pathway with significant enrichment, the circle represents the number of miRNAs, and the color represents the significance of enrichment.
Real-Time Fluorescence Quantitative PCR Results
In order to verify the results of second-generation high-throughput sequencing, we further expanded the sample size, consulted relevant literature, and selected two miRNAs, miR-21-5p and miR-125b-5p, respectively. Their expression levels were determined by qRT-PCR in peripheral blood samples of the two groups, and 2-△△CT was calculated according to CT values, which were displayed after statistical analysis, qRT-PCR verification results of the two miRNAs were consistent with the second-generation high-throughput sequencing results, and had statistical significance (P<0.05) as shown in Figure 6.
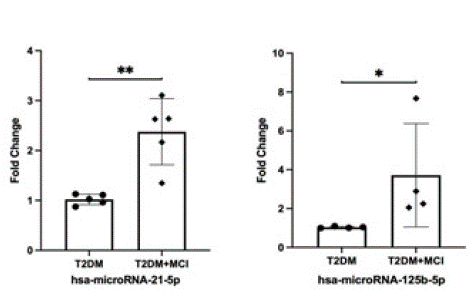
Figure 6: Relative expression levels of miR-21-5p and miR-125b-5p in whole blood of the two groups.
Correlation Analysis between miR-21-5p and miR-125b-5p and MOCA Score was shown in Figure 7
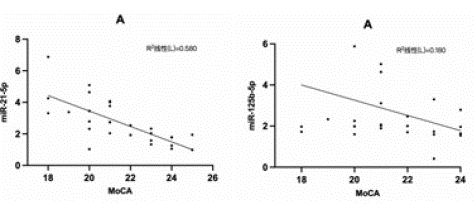
Figure 7: Correlation analysis of miR-21-5p and miR-125b-5p with MoCA.
Spearman correlation analysis showed that the relative expression level of miR-21-5p was negatively correlated with MoCA (r=-0.762, P<0.001). The relative expression level of miR-125b-5p was negatively correlated with MoCA (r=-0.424, P<0.05).
Evaluation of the Efficacy of miR-21-5p and miR-125b-5p as Biomarkers of T2DM+MCI (Figure 8).
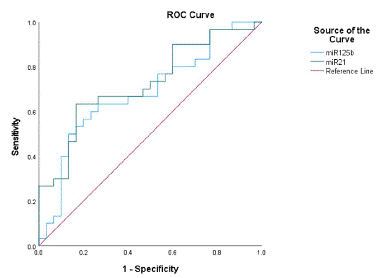
Figure 8: Diagnostic value of miR-21-5p and miR-125b-5p in T2DM+MCI.
ROC curve analysis suggested that the area under the curve of miR-21-5p was 0.724, the sensitivity was 0.633, the specificity was 0.833, the 95% confidence interval was 0.5955-0.854, and the optimal cut-off value was 7.457. The area under the curve of miR-125b-5p was 0.686, the sensitivity was 0.6, and the specificity was 0.767. The 95% confidence interval is 0.549-0.822, and the optimal cut-off value is 4.523.
Discussion
With the constant change of people's lifestyle, the incidence of T2DM continues to rise. According to the prediction of the International Diabetes Federation, the number of DM patients in the world will increase to nearly 600 million from 2013 to the next 20 years [11]. The number of DM in China accounts for 1/3 of the total number of DM patients in the world, and 95% of them are T2DM [12]. T2DM is a metabolic disorder characterized by hyperglycemia and insulin resistance. DM patients have a higher risk of dementia, AD and vascular dementia than patients with normal glucose tolerance, and scientific management of DM is helpful to prevent dementia [13,14]. MCI is a major risk factor for AD. After decades of development, MCI patients will develop into AD, which provides a good time period for us to prevent the occurrence and development of AD. Therefore, it is very important to study T2DM with MCI.
Some scholars [15] indicated that compared with healthy people, the expression level of miR-21-5p in the brain tissue of AD patients was increased, and the expression level of miR-21-5p was negatively correlated with the cognitive function of patients. A foreign study [16] found that miR-125b-5p was increased in cerebrospinal fluid derived exosomes of AD patients, and ROC curve suggested that miR-125b-5p could be used as a predictor of AD. In this study, we performed genomic analysis between T2DM+MCI (n=4) and T2DM+nMCI (n=4) patients by second-generation high-throughput sequencing. A total of 39 miRNAs with significant differences were identified, of which 28 were up-regulated and 11 were down-regulated. The distribution of differentially expressed genes was roughly inferred by volcano map, and then differentially expressed miRNAs were screened out. GO enrichment analysis and KEGG pathway analysis were performed on the target genes of differentially expressed miRNAs. GO enrichment analysis showed that, from the BP level, differentially expressed miRNAs were mainly related to the regulation of nervous system functional development and cell metabolism, the regulation of primary metabolic processes, and cell surface receptor signaling pathways. At the CC level, differentially expressed miRNAs were mainly related to neuronal projection, synapses and metal ion binding. At MF level, differentially expressed miRNAs are mainly related to nucleic acid binding and binding transcription factor activities in regulatory regions. KEGG signaling pathway analysis showed that some signaling pathways related to differentially expressed miRNAs include: AGE-RAGE signaling pathway, tumor necrosis factor signaling pathway, cholinergic synapses, spinocerebellar ataxia, herpes simplex virus type 1 infection, MAPK signaling pathway, and Ras signaling pathway in type 2 diabetes mellitus and diabetes complications. According to previous studies [15,16] and combined with the second-generation high-throughput sequencing results, miR-21-5p and miR-125b-5p were selected for qRT-PCR verification. In the results of second-generation high-throughput sequencing, miR-21-5p and mi125b-5p were significantly expressed in T2DM+MCI patients compared with T2DM+nMCI patients, and the difference was statistically significant. We further expanded the sample size by qRT-PCR. Compared with T2DM+nMCI group, miR-21-5p and mi125b-5p were up-regulated in T2DM+MCI group, with a trend consistent with the results of second-generation high-throughput sequencing, and the difference was statistically significant. Further analysis of ROC curve showed that the area under the curve of miR-21-5p was 0.724, the sensitivity was 0.633, the specificity was 0.833, the 95% confidence interval was 0.5955-0.854, and the optimal cut-off value was 7.457. The area under the curve of miR-125b-5p was 0.686, the sensitivity was 0.6, and the specificity was 0.767. The 95% confidence interval is 0.549-0.822, and the optimal cut-off value is 4.523. Spearman analyzed the correlation between their expression level and MoCA score and found that their expression level was negatively correlated with MoCA score, that is, the lower the score of MoCA, the higher their expression level.
In conclusion, in the results of this experiment, miR-21-5p and miR-125b-5p were up-regulated in patients with T2DM+MCI. As a common scale used to assess cognitive impairment, their expression levels were negatively correlated with MoCA score. The lower the MoCA score was, the higher the relative expression levels of miR-21-5p and mi125b-5p indicate that they may be biomarkers of T2DM+MCI, providing references for the early prevention, diagnosis and treatment of AD. Meanwhile, it is expected to find more biomarkers to provide theoretical basis for the pathogenesis of T2DM+MCI.
Conclusion
In summary, our results suggest that miR-21-5p and miR-125b-5p are up-regulated in T2DM+MCI and may be biomarkers for T2DM+MCI patients in the future. And the lower the MOCA score, the higher the expression of miR-21-5p and miR-125b-5p.
References
- Mecca AP, van Dyck CH. Alzheimer’s & Dementia: The Journal of the Alzheimer’s Association. Alzheimers Dement. 2021; 17: 316-317.
- Petersen RC, Lopez O, Armstrong MJ, Getchius TSD, Ganguli M, et al. Practice guideline update summary: Mild cognitive impairment: Report of the Guideline Development, Dissemination, and Implementation Subcommittee of the American Academy of Neurology. Neurology. 2018; 90: 126-135.
- Umegaki H. Diabetes-related cognitive dysfunction: Hyperglycemia in the early stage might be a key?. J Diabetes Investig. 2018; 9: 1019-1021.
- Liu T, Lee J E, Wang J, Ge S, Li C, et al. Cognitive Dysfunction in Persons with Type 2 Diabetes Mellitus: A Concept Analysis. Clin Nurs Res. 2020; 29: 339-351.
- van Sloten TT, Sedaghat S, Carnethon MR, Launer LJ, Stehouwer CDA. Cerebral microvascular complications of type 2 diabetes: stroke, cognitive dysfunction, and depression. Lancet Diabetes Endocrinol. 2020; 8: 325-336.
- Liang Y, Ridzon D, Wong L, Chen C. Characterization of microRNA expression profiles in normal human tissues. BMC Genomics. 2007; 8: 166.
- Gupta P, Bhattacharjee S, Sharma AR, Sharma G, Lee SS, et al. miRNAs in Alzheimer Disease - A Therapeutic Perspective. Curr Alzheimer Res. 2017; 14: 1198-1206.
- Martinez B, Peplow PV. MicroRNAs as diagnostic and therapeutic tools for Alzheimer’s disease: advances and limitations. Neural Regen Res. 2019; 14: 242-255.
- Reddy PH, Tonk S, Kumar S, Vijayan M, Kandimalla R, et al. A critical evaluation of neuroprotective and neurodegenerative MicroRNAs in Alzheimer’s disease. Biochem Biophys Res Commun. 2017; 483: 1156-1165.
- Han X. Expression of microRNA in hippocampal tissue and cells of diabetic encephalopathy rats. Hebei Medical University. 2018.
- Guariguata L, Whiting DR, Hambleton I, Beagley J, Linnenkamp U, et al. Global estimates of diabetes prevalence for 2013 and projections for 2035. Diabetes Res Clin Pract. 2014; 103: 137-149.
- Xu Y, Wang L, He J, Bi Y, Li M, et al. Prevalence and control of diabetes in Chinese adults. JAMA, 2013; 310: 948-959.
- Gao Y, Xiao Y, Miao R, Zhao J, Zhang W, et al. The characteristic of cognitive function in Type 2 diabetes mellitus. Diabetes Res Clin Pract. 2015; 109: 299-305.
- Yu J T, Xu W, Tan CC, Andrieu S, Suckling J, et al. Evidence-based prevention of Alzheimer’s disease: systematic review and meta-analysis of 243 observational prospective studies and 153 randomised controlled trials. J Neurol Neurosurg Psychiatry. 2020; 91: 1201-1209.
- Giuliani A, Gaetani S, Sorgentoni G, Agarbati S, Laggetta M, et al. Circulating Inflamma-miRs as Potential Biomarkers of Cognitive Impairment in Patients Affected by Alzheimer’s Disease. Front Aging Neurosci. 2021; 13: 647015.
- McKeever PM, Schneider R, Taghdiri F, Weichert A, Multani N, et al. MicroRNA Expression Levels Are Altered in the Cerebrospinal Fluid of Patients with Young-Onset Alzheimer’s Disease. Mol Neurobiol. 2018; 55: 8826-8841.