1Weldon School of Biomedical Engineering, Purdue University, West Lafayette, Indiana, US
2School of Mechanical Engineering, Purdue University, West Lafayette, Indiana, USA
3Department of Surgery, Indiana University School of Medicine, Indianapolis, Indiana, USA
*Corresponding author: Craig J. Goergen, Weldon School of Biomedical Engineering, Purdue University, 206 S. Martin Jischke Dr., West Lafayette, Indiana 47906, USA.
Received: August 16, 2014; Accepted: November 13, 2014; Published: November 18, 2014
Citation: Iliff BP, Kerlo AEM, Chen J, Rodefeld MD and Goergen CJ. In Vitro Ultrasound Measurements of Powered and Unpowered Total Cavopulmonary Connection. Austin J Biomed Eng. 2014;1(5): 1026. ISSN: 2381-9081.
Three-staged Fontan palliation is performed on children suffering from single ventricle congenital heart disease. The series of surgical procedures reroutes blood from the vena cavae (plural) directly to the pulmonary arteries, creating a total cavopulmonary connection (TCPC). A viscous impeller pump (VIP) is currently being developed as a cavopulmonary assist device that can modestly augment cavopulmonary flow, reduce systemic venous pressure, and improve ventricular preload. This study used ultrasound to visualize complex flow patterns in powered and unpowered in vitro mock Fontan circulations. The idealized TCPC was modeled with a silicone mold and blood analog made of water and glycerol that was seeded with 10-μm glass beads. B-mode, color Doppler, and pulsed-wave Doppler images were used to visualize complex flow patterns in the idealized TCPC with (1) no VIP, (2) static VIP, and powered VIP rotation rates of (3) 500 and (4) 2,000 rotations per minute (RPM). Pulsed-wave Doppler data showed higher mean velocities and greater variance in the outlets relative to the larger inlets. The maximum inlet velocity ± SD increased from 10.9 ± 3.53 cm/s with no VIP to 15.9 ± 1.03 when the VIP was rotating at 2,000 RPM. Likewise, the maximum outlet velocity increased from 14.9 ± 11.2 cm/s to 18.9 ± 7.25 cm/s at 2,000 RPM. The faster mean velocities with the VIP rotating suggest that the pump augments cavopulmonary flow. The results of this study suggest that measuring complex flow patterns with ultrasound in vivo could be used clinically to optimize VIP positioning and rotation rate during and after implantation.
Keywords: Fontan; Ultrasound; Doppler; Hemodynamics; Total cavopulmonary connection
B-mode: Brightness Mode; CD: Color Doppler; CFD: Computational Fluid Dynamics; fps: Frames Per Second; PRF: Pulse Repetition Frequency; PWD : Pulsed-wave Doppler; RPM: Rotations Per Minute; SPIV: Stereoscopic Particle Image Velocimetry; TCPC: Total Cavopulmonary Connection; VIP: Viscous Impeller Pump
Staged surgical repair culminating in Fontan circulation is the standard treatment for children with single ventricle heart disease. This includes patients with tricuspid or pulmonary atresia, hypoplastic left or right heart syndrome, double inlet or outlet left or right ventricle, and many heterotaxy defects [1]. Repair of these defects currently requires a series of complex procedures within the first 2-4 years of life collectively referred to as staged Fontan palliation [2]. The end goal of these procedures is to reroute systemic venous blood directly to the lungs without returning to the heart. The first stage is the Norwood procedure performed shortly after birth, followed a few months later by the Glenn or hemi-Fontan procedure. The final stage, the Fontan procedure, bypasses the right ventricle to create a direct connection between the vena cavae and the pulmonary arteries. This construct is known as a total cavopulmonary connection (TCPC) [3]. After Fontan completion, the ventricle is committed to pump blood to the body and then the lungs in series, doubling the workload imposed on the single ventricle. The lungs are perfused passively by venous pressure alone, creating inefficiencies that lead to a characteristic constellation of complications including low cardiac output, progressive ventricular failure, protein-losing enteropathy, plastic bronchitis, and activity intolerance [4]. Combined, these lead to morbidities that reduce the quality and length of life.
We have postulated that a means to provide a power source at the level of the TCPC would restore the inefficient Fontan circulation to one which more closely mimics a biventricular circulation [5]. We are currently developing a viscous impeller pump (VIP) that can serve as a temporary or permanent implantable cavopulmonary assist device. It is based on the von Kármán viscous pump and features a bi-conical impeller designed to provide multidirectional flow augmentation in the TCPC [6-9]. A relatively small pressure step-up at this level would improve the overall efficiency of the Fontan circulation while reducing the workload on the single ventricle [4,7,8,10]. Previous studies have used computational fluid dynamics (CFD) and stereoscopic particle image velocimetry (SPIV) to analyze the hemodynamic properties of the VIP in a mock Fontan circulation with an idealized TCPC [6,8,9]. CFD and SPIV methods require substantial time and expertise to construct, run, and analyze, limiting their current use in clinical practice to quantify hemodynamics or optimize device settings. In this study, we used ultrasound imaging in vitro to visualize complex flow patterns within idealized Fontan powered and unpowered circulations. The ultrasound analysis aims to explore the feasibility of using ultrasound imaging to measure velocities and analyze complex flow patterns within and near the TCPC.
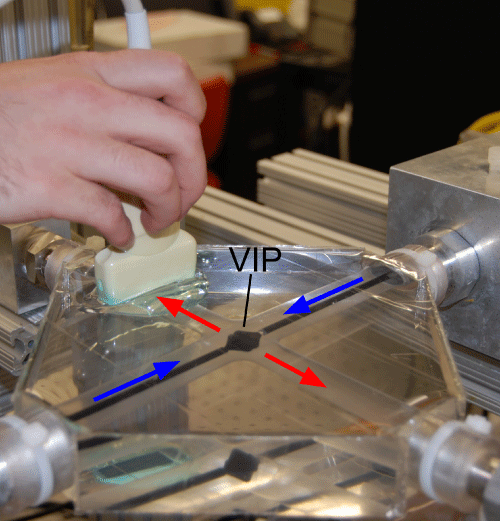
An idealized, silicone TCPC was used to model Fontan circulation with adult physiology. The 22 mm diameter inlets represent the superior and inferior vena cavae, while the 18 mm outlets model the left and right pulmonary arteries. We pumped a glycerol solution through the idealized TCPC at a steady flow rate of 4.4 L/min. The glycerol solution was seeded with hollow glass beads of 10 μm diameter to mimic red blood cells and increase the PWD velocity signal. While the detailed methods and materials for the silicone mold, glycerol solution, and pump setup can be found in previous reports [6,8], the experimental setup we used is shown in (Figure 1).
Ultrasound data were collected using a 128-element liner array transducer (12L5V, 5-12 MHz) and a Terason T3000 ultrasound system (Terason Division; Teratech Corporation; Burlington, MA). We analyzed brightness mode (B-mode) images for geometry and general motion, pulsed-wave Doppler (PWD) images for fluid velocity measurements, and color Doppler (CD) images for visualization of complex flow patterns. Ultrasound transmission gel (Aquasonic 100; Parker Laboratories; Fairfield, NJ) was applied to the interface between the transducer and the mock TCPC. The transducer was held by hand perpendicular to the plane of flow. Images had a penetration depth of 4 to 5 cm from the upper surface of the silicone mold. We confirmed our results by imaging from the bottom surface of the TCPC to verify that the location of the transducer did not affect our measurements (data not shown).
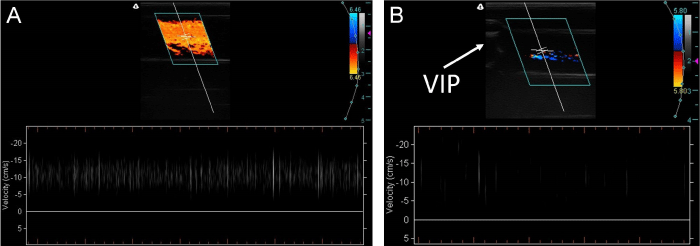
The inlet diameter, outlet diameter, and pump dimensions were measured from B-mode images using a linear measurement tool in the Terason T3000 software or with Image J [11]. We also used CD cine loops (15 fps) to visualize complex flow patterns. CD imaging is colored according to a velocity gradient scale in which red represents flow towards the transducer and blue away from the transducer. PWD images were used to quantify velocity (Figure 2). We did not quantify velocity from the CD images due to the complexity of the flow. Longitudinal imaging required a steering angle of 20° in order for the direction of flow to be oriented correctly in relation to the transducer. The maximum PWD adjustment angle was aligned within 70° of the direction of flow to maintain reliability and improve accuracy of the velocity measurements. The pulse repetition frequency (PRF) was adjusted between 800 and 4500 Hz depending on the flow velocity. To study the effects of imperfect pump alignment, velocity patterns were imaged with the VIP off-center from the outlet axis at 0 and 500 RPM. We acquired longitudinal CD images of the velocity patterns along the outlet axis as the VIP was gradually adjusted to off-center positions. The adjustment of the VIP was limited by the sleeve to ± 6.5 mm along the pump axle.
PWD velocity data were collected near the midpoint of the inlet and outlet diameters where the maximum velocities were observed. For PWD studies of the inlets with the VIP present, the sample volume was centered between the axle and the wall of the inlet at approximately one quarter of the diameter of the inlet from the wall to account for zero flow velocities at both the axle and wall. The transducer was held with the sample volume located 2 to 4 cm upstream or downstream from the VIP. Data points were recorded from the midpoint of the velocity streaks (Figure 2). Measurements were recorded over the course of four 2-3 hour imaging sessions. Sample size for each setting correlated to the number of data points in the images collected during these sessions. PWD data for variable VIP settings including no VIP, static VIP, powered VIP at 500 RPM, and powered VIP at 2,000 RPM were statistically compared with a one-way ANOVA (p=0.05, JMP v10.0.0) for the inlets and outlets separately. The inlet and outlet data for each VIP setting were then also individually compared. The one-way ANOVA comparisons that showed a significant difference were followed by a Tukey-Kramer post-hoc test.
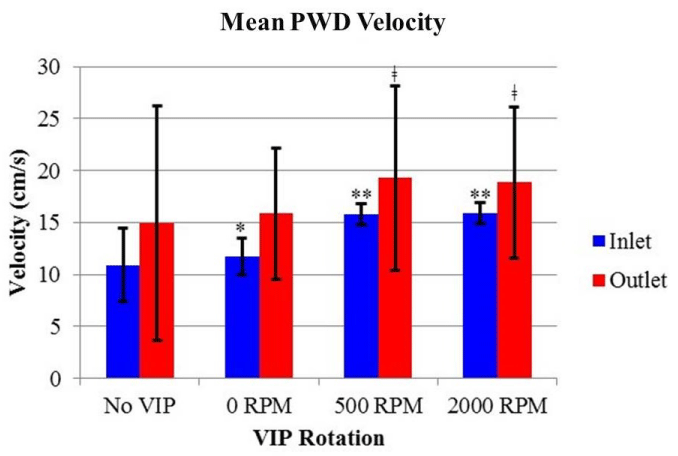
The means, standard deviations, and number of measurements for the maximum velocities of the inlets and outlets for each VIP setting are presented in Table 1 and Figure 3. Data were collected from the images similar to (Figure 2) and many other PWD images at various VIP settings. The inlet velocities were significantly slower than the outlet velocities for all settings (p<0.05). Inlet velocities significantly increased from no VIP to static VIP (p<0.005) to powered VIP (p<0.001), with no significant difference between the 500 RPM and 2,000 RPM VIP settings (p=0.86). The powered VIP settings yielded significantly higher outlet velocities compared to the absent or static VIP velocity measurements (p<0.001). Calculating the ratio of outlet to inlet mean velocities for each setting revealed increases of 36%, 35%, 22% and 18% across the TCPC for no VIP, static VIP, 500 RPM VIP, and 2,000 RPM VIP, respectively.
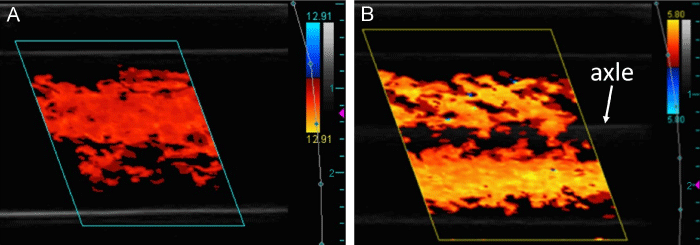
The CD images presented in this section are representative of the cine loops obtained to characterize the complex flow patterns within the inlets and outlets. Steady, unidirectional flow was observed in the inlets with an absent or static VIP (Figure 4). Images of the inlets with a rotating VIP contained artifacts caused by the vibration of the VIP axle and are not shown. Vortices that oscillated in position, rotational direction, and quantity between two, three, and four were observed in the CD cine loops of the outlets with no VIP. The complex flow pattern in the outlet with no VIP near the center of the TCPC was captured in a cross-sectional view (Figure 5A) and compared to the stable flow observed in the outlets with static and powered VIP (Figures 5B and 5C). Longitudinal CD cine loops of the outlets with no VIP again showed chaotically oscillating vortices (Figure 6A). The longitudinal CD cine loops of the outlets for static VIP studies showed relatively stable flow (Figure 6B) with less vorticity than with no VIP. For the powered TCPC studies with the VIP rotating at 500 and 2,000 RPM, arching vortices were observed in both the left and right outlets (Figure 6C).
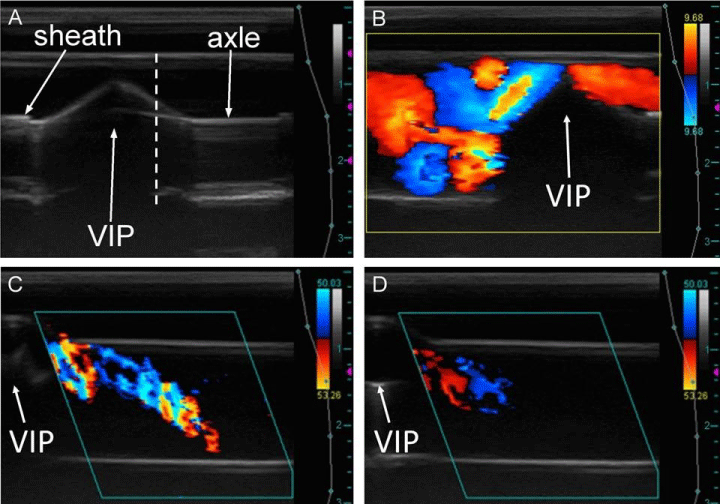
The effects of imperfect pump alignment on the flow patterns were studied as the pump was moved along its axle. Figure 7A shows a typical image of a misaligned VIP that was moved into one of the inlets such that the center of the pump was no longer aligned with the center of the TCPC. Stable flow was observed in cross-sectional cine loops of an outlet near the TCPC with a centered, static VIP. As the VIP was gradually moved off-center along its axle, the flow appeared to degrade into unsteady, oscillating vortices (Figure 7B) similar to those observed in the studies with no VIP. With a rotating VIP at 500 RPM, an arching flow pattern (Figure 7C) characteristic of powered VIP CD studies was observed to decrease in signal strength and velocity as the VIP was gradually moved off-center relative to the outlet axis (Figure 7D).
The increasing flow velocity with the progression from no VIP to static VIP to powered VIP suggests a possible improvement in TCPC hemodynamics. The CD studies with no VIP showed unstable vortices in the outlets. A pattern of chaotically oscillating vortices has also been observed in previous CFD and SPIV studies of an idealized TCPC with no VIP [6,8,9]. These vortices arise from the collision of inlet flow that results in an energy loss at the TCPC [12]. This energy loss in vivo leads to inefficient flow, increased systemic venous pressure, and reduced ventricular filling [13]. The ratios of outlet to inlet velocities calculated from the PWD measurements decreased progressively from 1.37 with no VIP to 1.18 with a VIP rotating at 2,000 RPM. This trend suggests a reduction in energy loss with a powered TCPC compared to an unpowered TCPC. The static VIP CD cine loops appeared to show more stable flow in the outlets compared to the circulation with no VIP. Our observation of stable flow is supported by the higher variability and larger standard deviations in velocity measurements with no VIP compared to stationary VIP. These data, along with the increased velocity measurements compared to no VIP, suggest that even when not rotating, the static VIP does not obstruct flow. The static VIP may even improve outlet flow from the TCPC by avoiding direct collision of opposing flow from the inlets and stabilizing outlet flow patterns [6-10]. Finally we observed higher variability for outlet compared to inlet velocity measurements under all conditions. This is likely due to the complexity of flow in the outlets after the Fontan connection when compared to the unidirectional flow of the inlets.
The vortices observed in the CD images and cine loops in outlets of the powered TCPC studies were very stable, suggesting that the PWD velocity is a useful metric when characterizing flow both instantaneously and over time. The velocities indicated by the color scale bar of CD images were lower than corresponding PWD measurements. Previous studies comparing velocities recorded from PWD and CD methods have shown that CD velocities tend to be lower than corresponding PWD velocities and that the two methods should not be used interchangeably [14]. The significant difference between the inlet velocities of the TCPC in both powered (500 and 2,000 RPM) and unpowered (no VIP and static VIP) states indicate that the rotating VIP is pulling the glycerol mixture from the inlets and pushing it into the outlets, as has been suggested in previous CFD and SPIV studies [6,8,9]. This boost could help alleviate systemic venous pressure in vivo, thereby improving overall efficiency of the Fontan circulation. The decrease in velocity data variability from 500 RPM to 2,000 RPM suggests an improvement in hemodynamic stability at higher rotational speeds. Images and cine loops were also collected with the VIP rotating at faster rates with minimal changes in flow patterns observed compared to 2,000 RPM. However, further studies and analysis will be necessary to determine an optimal rotation rate.
Positioning of the VIP affected flow patterns in both the powered and unpowered TCPC. When a static VIP was misaligned to one side relative to the outlet axis, hemodynamics on that same side remained steady. Unfortunately, flow patterns on the opposite side of the VIP reverted to unsteady and potentially less efficient outlet flow, similar to flow patterns observed in the studies with no VIP. In the case of a powered TCPC, misalignment of the VIP appeared to weaken the outlet flow without affecting stability. CD signal and velocity of the arching vortex decreased as the VIP was shifted away from the center of the TCPC. The use of ultrasound imaging to characterize hemodynamic effects of imperfect pump alignment demonstrates that the modality can be used to position the VIP for optimal flow.
Limitations inherent to the ultrasound system and experimental setup described here could be addressed in future studies. Aliasing of PWD studies can be overcome with higher frame rate data collection. Filtering of the glass beads in the glycerol pump system prevents an accurate determination of seeding concentration and gradually reduces the signal strength. The idealized setup with adult physiological dimensions could be replaced with a more anatomical mold of pediatric vessels or even patient-specific molds constructed from computed tomography or magnetic resonance data to make the study more clinically relevant. Future studies will be needed to directly compare CFD and SPIV data to ultrasound PWD velocity measurements and pressure calculations in order to translate in vitro imaging of idealized mock circulations to in vivo imaging of actual patients.
Ultrasound can be used in vitro to visualize and quantify complex flow patterns of mock circulations. This study suggests that ultrasound could be useful clinically in determining optimal placement and rotation of a VIP for individual Fontan patients. PWD velocity measurements of blood flow within vasculature, including vena cavae and pulmonary arteries [15,16], are commonly used in clinical echocardiography to calculate pressure gradients [17,18,19]. Translating the concept of this study to clinical applications could provide valuable information on pressure gradients across the TCPC. Given that higher velocity is directly correlated with lower pressure, the higher velocities measured in the powered TCPC studies may suggest that implantation of the VIP yields a reduction in the workload on the single ventricle and more efficient flow to the lungs. If VIP studies continue to exhibit improved hemodynamics, a TCPC powered with a cavopulmonary assist device could improve outcomes for patients suffering from single ventricle congenital heart disease.
PWD velocity measurements for VIP settings of no VIP, static VIP, and powered VIP at 500 and 2,000 RPM.
No VIP |
Static VIP |
500 RPM VIP |
2,000 RPM VIP |
Inlets 10.9 ± 3.53 (184) |
11.7* ± 1.77 (154) |
15.8** ± 0.993 (294) |
15.9** ± 1.03 (220) |
Outlets 14.9 ± 11.2 (110) |
15.8 ± 6.28 (971) |
19.3ǂ ± 8.90 (311) |
18.9ǂ ± 7.25 (589) |
Values expressed as means ± SD (n) in cm/s. *p-value<0.005, **p-value <0.001, ǂp-value <0.001 compared to the circulation with no VIP.
Photograph of the mock Fontan circulation setup with ultrasound transducer. The VIP is located in the center of the silicone mold with the ultrasound transducer and transmission gel above and to the left. Blue arrows indicate inlet flow, red arrows indicate outlet flow.
Typical PWD images of an inlet with no VIP (A) and an outlet with stationary VIP (B). The CD images are shown at the top of the figures with a velocity scale bar to the right. The crosshairs in the center of the CD images represent the sample volume and indicate that the directional velocity measurements are oriented parallel to the vessel. The PWD sections below show individual glass beads traveling at velocities of roughly 11 cm/s in (A) and 7 to 19 cm/s in (B). The number of vertical streaks per image is dependent on the concentration of glass beads.
Mean PWD velocity for settings of no VIP, static VIP, and powered VIP at 500 and 2,000 RPM. Within the inlets, the velocity increased significantly when the VIP was stationary (*p<0.005) and when rotating at 500 RPM and 2,000 RPM (**p<0.001). For the outlets, there is a significant increase when comparing the powered TCPC (500 and 2,000 RPM) to the unpowered conditions of no VIP and static VIP (ǂp<0.001). The velocity of the outlets was also significantly higher than the inlets for each condition (p<0.05). Bars indicate means ± SD.
Longitudinal CD images of inlets with no VIP (A) and static VIP (B), both with characteristic steady, unidirectional flow. The gray line between the high-intensity signals in (B) is the VIP axle. The larger hash marks on the far right of the images measure signal depth in centimeters from the transducer.
Cross-sectional CD images of outlets showing typical flow patterns. With no VIP, 4 distinct dynamic vortices were clearly observed (A). Crosssectional CD image of an outlet with static VIP showing stable, unidirectional flow (B). Cross-sectional CD image of an outlet with VIP rotating at 500 RPM showing a slice through a typical arching vortex (C).

Longitudinal CD images of outlets under multiple conditions. With no VIP, multiple dynamic vortices were visualized (A). Longitudinal CD image of an outlet with static VIP shows low-signal but stable, unidirectional flow with no vortex structures (B). Longitudinal CD image of an outlet with rotating VIP at 500 RPM (C). The characteristic arching vortex can be seen to the right of the VIP. Arrow indicates the center of the VIP.

Longitudinal B-mode images of off-center VIP along inlet axis showing the sheath that covers the axle on either side of the VIP (A). Reflection artifacts are seen below the VIP and axle. The vertical dashed line demarcates the center of the TCPC. Longitudinal CD image of off-center static VIP adjusted to the right showing unsteady vortices to the left of the VIP, where the environment resembles a TCPC with no VIP. We observed more stable flow to the right of the image where the VIP had more of an effect on flow patterns (B). Flow in (B) is directed out of the plane of the image into an outlet. Longitudinal CD images of an outlet with VIP rotating at 500 RPM both centered (C) and off-centered (D) showing a diminished vortex when the VIP is incorrectly placed.
