
Review Article
Austin J Biomed Eng. 2021; 6(1): 1043.
The Tactile Sensing with Light Propagation in a Four-Layer Slab Waveguide for Breast Tumor Detection
Lee J-H*
University of Keimyung, School of Medicine, South Korea
*Corresponding author: Jong-Ha Lee, University of Keimyung, School of Medicine, South Korea
Received: April 06, 2021; Accepted: May 19, 2021; Published: May 26, 2021
Abstract
Light propagation in a 4 layer slab waveguide is considered. The supported modes are of higher orders than zero, with a larger node concentration toward the layers with larger refractive index. Additionally, we consider the geometric optics approximation to describe very thick waveguides. Light can be coupled from LED by direct focusing with a lens, and coupling can be optimized by introducing a transverse displacement in order to focus it on the layers with larger refractive index. Further optimization can be done by tilting the lens and bringing in some degree of coma aberrations.
Keywords: Refractive index; Geometric optics; Optical waveguide
Introduction
Optical waveguide is the fundamental element that interconnects various devices of an optical integrated circuit, just as a metallic strip does it in an electrical integrated circuit. Light travels in optical waveguides in form of the guided modes, which are the only form, allowed propagating in waveguides according to electromagnetic laws [1,2]. The modes represent stable distribution of electromagnetic field inside the waveguide. Each mode has a different field profile depending on the geometry and properties of the waveguide [3,4].
Normally used in optics are the dielectric waveguides, which are made of a number of optical layers usually a few wavelengths thick and having different refractive indexes [5]. Having the refractive index larger than that of the surrounding medium allows for light to be trapped inside the waveguide due to total internal reflection. The layers can be made of glass, liquid crystals, organic polymer, and could even have an externally controlled refractive index [6].
Light is directed into the waveguide using an optical coupler. A number of solutions are used for that purpose, such as direct coupling, prism coupling, grating coupling, and tapered coupling. The simplest possible is direct focusing with a lens, in which light is focused onto the waveguide edge with an optical lens [7]. In order to couple light into the waveguide one needs to excite its modes, which usually means only exciting the basic one. Coupling efficiency will be determined by how well the input wave’s profile matches that of the mode. If the profiles are matched and there is no discontinuity, light from the source will just continue propagating into the waveguide. However, if there is a discontinuity, only some portion of light would be coupled, while the rest would be diffracted away [8,9].
In this paper we consider light propagation in a four-layer planar dielectric slab waveguide. The problem is formulated analytically and develops into a complete set of equations in Section 3. A specific case of a waveguide is considered as a demonstration of general properties of the structure in Section 4. The geometric optics approximation describing very thick waveguides is given in Section 5. Optical coupling and optimization is considered in Section 6. Section 7 concludes the results of the paper.
The Waveguide
As shown in Figure 1, the 4-layer waveguide is made of glass, on top of which three Polydimethylsiloxane (PDMS) have been formed. The waveguide is illuminated through its edges by LED light sources.
Layer 1: PDMS, refractive index n1 and height h1
Layer 2: PDMS, refractive index n2 and height h2
Layer 3: PDMS, refractive index n3 and height h3
Layer 4: Borosilicate glass plate, refractive index n4 and height h4
The layers are positioned in the order of increasing refractive index, so n1 > n2 > n3 > n4. Since the waveguide is surrounded by air, having a lower refractive index than any of the layers of the waveguide, the incident light directed into the waveguide remains contained within it [10].
Light propagates in the direction z, and the layers are positioned in the direction x. The layer boundaries have coordinates [11].
x = 0,
x = a1 = h1,
x = a2 = h1 + h2,
x = a3 = h1 + h2 + h3,
x = a4 = h1 + h2 + h3 + h4.
Size of the waveguide is 3 cm, which is much larger than the typical layer thickness. We therefore are going to assume an infinite dimension in planar direction y.
Analytic Formulation
Light propagation in a dielectric waveguide is described by the wave equation.
Here E(x, y, z, t) is the electric field, n is the refractive index, and c is the speed of light in vacuum. A similar equation is valid for the magnetic field H(x, y, z, t):
For monochromatic waves with frequency ω the solution of Eq. (1) has the form
Given that form, the spatial distribution of electric field E(x, y, z) follows this equation.
where k0 is the wave vector in vacuum: k0 = ω / c. Since the waveguide is uniform in z-direction, we can look only for planar wave solutions:
where β is the propagation constant. This is analogous to free wave propagation in a form of a plane wave in bulk medium [12]. The propagation constant β has the dimensions and the physical meaning of wave vector k in a medium with effective refractive index neff:
k=k0neff,
Considering that the problem is independent of direction y, the field varies only across dimension x.
E(x, y) = E(x).
Further, let us first consider the solution for the transverse y-component of the electric field, representing the TE mode. For that purpose, let us assume:
E(x) = e(x) j,
where j is the unit vector along the direction y. By substituting that into Eq. (3) we can reduce it to the following ordinary differential equation:
d2e/dx2 + [k02n2 − β2] e = 0 Eq. (5)
This equation has to hold throughout all regions including the slabs and the air
Region 0: x < 0 d2e/dx2 + [k02n02 − β2] e = 0
Region 1: 0 < x < a1 d2e/dx2 + [k02n12 − β2] e = 0
Region 2: a1< x < a2 d2e/dx2 + [k02n22 − β2] e = 0
Region 3: a2< x < a3 d2e/dx2 + [k02n32 − β2] e = 0
Region 4: a3< x < a4 d2e/dx2 + [k02n42 − β2] e = 0
Region 5: x > a4 d2e/dx2 + [k02n02 − β2] e = 0 Eq. (6)
The refractive index n0 is the refractive index of the medium surrounding the waveguide, in this case air n0=1, and the remaining indexes follow the inequality n1 > n2 > n3 > n4 > n0.
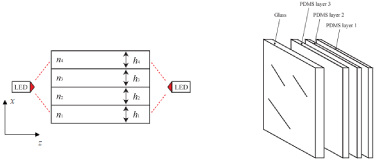
Figure 1: Structure of the 4-layer waveguide.
Since we are interested in solutions that are guided in all four layers and are evanescent outside of the waveguide, let us look for the solution in the following form:
Region 0: x < 0 e = e0 exp[κ0x] (evanescent)
Region 1: 0 < x < a1 e = e1 cos[κ1x + φ1] (oscillating)
Region 2: a1 < x < a2 e = e2 cos[κ2x + φ2] (oscillating)
Region 3: a2 < x < a3 e = e3 cos[κ3x + φ3] (oscillating)
Region 4: a3 < x < a4 e = e4 cos[κ4x + φ4] (oscillating)
Region 5: x > a4 e = e5 exp[κ5(h1 + h2 + h3 + h4 – x)] (evanescent)
Here regions 0 and 5 are outside the waveguide, and regions 1-4 are inside each respective layer. Each of the written pieces of the field, is a solution to Eq. (6), if the parameters are chosen appropriately. Since no field propagates outside the waveguide, the assumed solution in regions 0 and 5 must decay exponentially with the distance from surface. In the meantime, the propagating modes have sinusoidal form, and they have to be chosen in the most general form with unknown amplitudes ei, transverse wavevectors κi, and phases φi, i = 1-4. These parameters will have to be determined from the boundary conditions, matching the fields in different regions.
Substituting these pieces of the solution into their respective equation in system Eq. (6), we obtain the following dispersion relations:
Region 0: x < 0 –κ02 + β2 = k02
Region 1: 0 < x < a1 κ12 + β2 = k02 n12
Region 2: a1 < x < a2 κ22 + β2 = k02 n22
Region 3: a2 < x < a3 κ32 + β2 = k02 n32
Region 4: a3 < x < a4 κ42 + β2 = k02 n42
Region 5: x > a4 –κ52 + β2 = k02
For example, for Region 0, we substitute the piece e = e0 exp[κ0x] into the corresponding equation in region 0: d2e/dx2 + [k02n02 − β2] e = 0. That will produce equation –κ02 + β2 = k02. Similarly, for Region 1, one needs to substitute e = e1 cos[κ1x + φ1] into d2e/dx2 + [k02n02 − β2] e = 0. The result is κ12 + β2 = k02 n12.
Theoretically, β can range from k0n0 to k0n1. However, values equal to k0n2, k0n3, and k0n4 have special meaning from the guiding perspective. Consider a case when k0n4 < β < k0n3. Then all transverse wavevectors κ1-3 are real as it should be for the propagating modes. However, the wavevector κ4 = (k02 n42 − β2)½ becomes imaginary and attenuates, thus, transforming the 4-layer waveguide into a 3-layer. Such cases are simpler than the one considered here, and can be resolved in a similar way.
Further, we need to apply the boundary conditions and match the field components. For that purpose, we need to first determine the magnetic field from Maxwell equation for curl E, remembering that it has a similar form to the electric field, but now has only one nonzero component along the z-direction:
H(x, y, z, t) = k h(x) exp(–iβz + iωt)
where k is the unit vector along the z direction. Substituting this into the Maxwell equation
we obtain the following general solution for the magnetic field, expressed through the same parameters, as the electric field:
Region 0: x < 0 h = –(ic/ω) κ0e0 exp[κ0x]
Region 1: 0 < x < a1 h = (ic/ω) κ1e1 sin[κ1x + φ1]
Region 2: a1 < x < a2 h = (ic/ω) κ2e2 sin[κ2x + φ2]
Region 3: a2 < x < a3 h = (ic/ω) κ3e3 sin[κ3x + φ3]
Region 4: a3 < x < a4 h = (ic/ω) κ4e4 sin[κ4x + φ4]
Region 5: x > a4 h = (ic/ω) κ5e5 exp[κ5(a4 – x)]
Finally, the impedance h/e has to stay continuous on all boundaries (for x = 0, x = a1, x = a2, x = a3, x = a4):
Boundary 1: x = 0 κ0 = – κ1 tan(φ1)
Boundary 2: x = a1 κ1 tan(κ1a1 + φ1) = κ2 tan(κ2a1 + φ2)
Boundary 3: x = a2 κ2 tan(κ2a2 + φ2) = κ3 tan(κ3a2 + φ3) Eq. (7)
Boundary 4: x = a3 κ3 tan(κ3a3 + φ3) = κ4 tan(κ4a3 + φ4)
Boundary 5: x = a4 κ4 tan(κ4a4 + φ4) = κ5
These equations define the spectrum of the propagating modes in the structure. They can be combined together into one transcendental equation containing only one variable. That master equation reads as:
κ2 sin(κ2a2 + φ2) cos(κ3a2 + φ3) = κ3 sin(κ3a2 + φ3) cos(κ2a2 + φ2), Eq. (8)
where the following substitutions must be made:
φ1 = –arctan(κ0/κ1)
φ2= arctan[(κ1/κ2) tan(κ1a1 + φ1)] – κ2a1
φ3= arctan[(κ4/κ3) tan(κ4a3 + φ4)] – κ3a3
φ4 = arctan(κ5/κ4) – κ4a4
These equations are obtained by reverting the equations Eq. (7) and finding from them φi, and reverting the dispersion equations (pages 6 and 7), and finding κi.
After all substitutions into equation Eq. (8) the only remaining variable is the propagation constant β. Solution of this equation will provide the complete spectrum of the TE modes of the structure.
Field amplitudes e are also determined from the boundary conditions (for x = 0, x = a1, x = a2, x = a3, x = a4):
Boundary 1: x = 0 e1 = e0/cos(φ1)
Boundary 2: x = a1 e2 = e1 cos(κ1a1 + φ1) / cos(κ2a1 + φ2)
Boundary 3: x = a2 e3 = e2 cos(κ2a2 + φ2) / cos(κ3a2 + φ3)
Boundary 4: x = a3 e4 = e3 cos(κ3a3 + φ3) / cos(κ4a3 + φ4)
Boundary 5: x = a4 e5 = e4 cos(κ4a4 + φ4)
and the amplitude e0 is determined by the intensity of the coupled light. Without loss of generality we can use e0 = 1 for the purpose of this paper.
For TM modes only the Hy, Ex and Ez components of the field are present. The TM modes can be obtained in a similar way by matching the transverse component of the magnetic field Hy and the normal component of the dielectric vector n2Ez at the boundaries. Since refractive indexes rarely differ much (ni+1– ni)/ ni << 1, the TM modes number is usually very similar to the TE modes, have similar structure, and their propagation constants differ only slightly from those of the corresponding TE modes.
Numeric Simulations
As an example study, we solve the problem for a waveguide with following parameters:
wavelength λ = 0.628 μm,
layer thickness h1 = 1 μm, h2 = 1 μm, h3 = 1 μm, h4 = 1 μm
refractive indexes n1 = 1.5, n2 = 1.4, n3 = 1.3, n4 = 1.2,
The structure has 7 guided TE modes which propagate in all 4 layers of the structure (remember that it will also have other modes, propagating in only 3, 2, or 1 layer, and decaying in the others). The modes start with number 7 (intensity has 7 zeros) skipping the first seven modes including the zero mode. Their respective propagation constants β are given below:
TE7 β = 11.816 rad/μm
TE8 β = 11.583 rad/μm
TE9 β = 11.124 rad/μm
TE10 β = 10.723 rad/μm
TE11 β = 10.2 rad/μm
Intensity distribution in all modes is asymmetric and transversely skewed, and the layers with larger refractive indexes tend to contain more nodes Electric field distribution for each mode is shown in Figure 2-6.
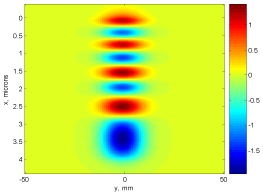
Figure 2: TE7 mode.
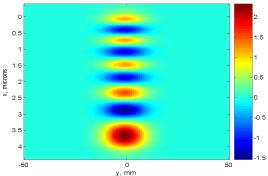
Figure 3: TE8 mode.
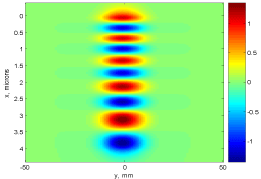
Figure 4: TE9 mode.
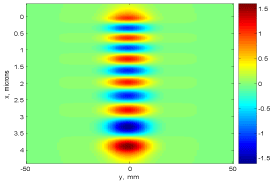
Figure 5: TE10 mode.
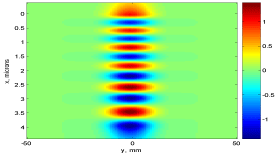
Figure 6: TE11 mode.
Geometric Optics Approximation
When dielectric layers are too thick, specifically, when thickness is much greater than the wavelength of propagating light, the number of allowed modes becomes very large. In such case, the geometric optics approximation is feasible. Under such approximation, waves are considered as rays, following the Snell’s law at refractive boundaries:
n1 sinα1 = n2 sinα2,
where α1 and α1 are the incidence and propagation angles.
Consider light trapped inside the waveguide in the geometry shown in Figure 7. Due to Snell’s law the propagation angles γi in each layer i, are bound by the following relations:
n1 sin γ1 = n0 sin 90º,
n2 sin γ2 = n1 sin γ1,
n3 sin γ3 = n2 sin γ2, Eq. (9)
n4 sin γ4 = n3 sin γ3,
n0 sin 90º = n4 sin γ4,
Here as before n0 is the refractive index of air n0 = 1, and the Total Internal Reflection condition (TIR) has been applied at the boundaries with air (sin 90º). Light propagating in the waveguide under any of angles γ1, γ2, γ3, or γ4 or higher in their respective layers will remain trapped inside the waveguide because of the TIR on both boundaries with air.
The acceptance angle is the maximum angle, under which light directed into the waveguide remains trapped inside is. Angles γ1, γ2, γ3, or γ4 are related to angle the acceptance angle θi in each layer i by the same Snell’s law (Figure 8):
sin θi = ni sin (90º− γi) = ni cos γi Eq. (10)
Further, transforming Eq. (10), we obtain
sin θi = ni cos γi = ni (1 − sin2 γi)½ = (ni2 − ni2sin2 γi)½
But as follows from Eq. (9), all (ni sin γi) are equal n0, which is equal to 1 for air. Therefore, we finally have:
θi = asin [(ni2−1)½] Eq. (11)
for each layer i. Light, incident on layer i under angle θi will be trapped inside the waveguide.
Eq. (11) shows, that it is easier to couple light into the waveguide through the layer with the largest refractive index, since its acceptance angle is the largest.
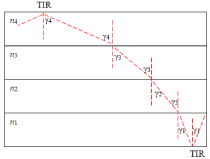
Figure 7: Ray propagation inside the waveguide under Total Internal Reflection (TIR).
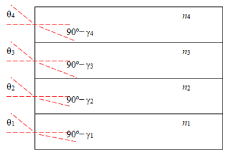
Figure 8: Relation of acceptance angles ?i to propagation angles γi.
Light Coupling
Coupling efficiency is determined by the coupling coefficient, measuring the degree of covariance between the two field distributions, the mode’s e(x), and the illuminating beam’s u(x):
In order to achieve maximum coupling, the overlap between the illuminating beam and the zero mode in the waveguide has to be maximum.
Consider a geometry, in which the light is being driven into the waveguide with the use of a lens (Figure 9). The lens forms a beam, which then excites one or more modes in the waveguide. The easiest to excite is the zero mode. However, the zero mode does not propagate in all 4 layers of this waveguide. It can only propagate in one of the layers, if the waveguide acts like a regular 1 layer guide. A likeness of the zero mode can be achieved by bringing the refractive indexes as closely together as possible while maintaining a nonzero difference between them. Then the field profile varies smoothly, which makes it easier to excite that particular mode.
Since the illuminating wave from an LED is highly incoherent, the focused light will therefore tend to excite a large number of modes. There are two reasons, why coupling is more efficient when light is focused closer toward the layers with larger index of refraction.
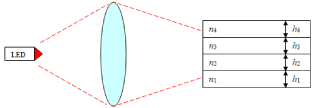
Figure 9: Coupling light into the 4-layer waveguide unoptimized scheme.
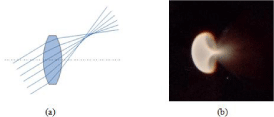
Figure 10: (a) Formation of the coma aberrated image from a tilted beam. (b) Typical light distribution produced by a tilted lens (coma).
First, the layers with larger index of refraction support more modes. It will be therefore easier to excite those with the LED’s incoherent light and without having to match the incident wave’s profile with the profiles of the modes. Second, because of the relation n1>n2>n3>n4 the intensity distribution in all modes is shifted toward the layer with larger refractive index. This is why introducing a transverse displacement into the incident beam will make coupling more efficient. These arguments are also supported in geometric optics approximation.
Another property of the modes that needs to be taken into account is their asymmetry. Intensity distribution has an essentially skewed shape and due to the n1>n2>n3>n4 arrangement, it is always skewed in the direction from the first layer toward the fourth.
This property can be utilized in coupling optimization if the incident light is also skewed in the manner similar to the mode. This could be done by introducing aberrations into the incident beam focused onto the structure’s edge with a lens. In geometric optics the skewed image produced by a tilted lens is known as coma. Coma is the asymmetry introduced into the image by a tilted lens, due to imperfections of spherical lens imaging properties. A typical image of a round object distorted by a tilted lens due to coma is shown in Figure 10.
Thus, if the focusing lens is tilted like shown in Figure 11, the resulting beam will be skewed and will couple more efficiently into the waveguide. It is important to observe the tilt direction in order to produce the skew in the right direction.
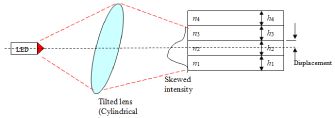
Figure 11: Optimized coupling into the 4-layer waveguide.
Conclusions
We have formulated the analytic solution to a four-layer planar optical waveguide. A numeric algorithm has been used to solve the propagation equations, find the electric field distribution for each mode, as well as the entire spectrum. A specific case is considered, demonstrating the optical properties of the structure. The supported modes are of higher orders, with a larger node concentration toward the layers with larger refractive index. Additionally, we consider the geometric optics approximation to describe very thick waveguides.
Lens focusing is best suited in order to couple light from an LED source into this waveguide. The coupling can be optimized by introducing a transverse displacement of the lens so that it focuses on the layers with larger refractive index. Furthermore, optimization can be done by tilting the lens and bringing in some degree of coma aberrations.
Acknowledgement
This work is supported by the Basic Science Research Program through the National Research Foundation of Korea (NRF) funded by the Ministry of Education (NRF 2017R1D1A1B04031182).
References
- F Kamangar, GM Dores and WF Anderson. “Patterns of cancer incidence, mortality, and prevalence across five continents: defining priorities to reduce cancer disparities in different geographic regions of the world”. J Clin Oncol. 2006; 24: 2137-2150.
- Jemal R Siegel, E Ward, Y Hao, J Xu, and MJ Thun. “Cancer statistics, 2009”. CA: A Cancer Journal for Clinicians. 2009; 59: 225-249.
- H Shojaku, H Seto, H Iwai, S Kitazawa, W Fukushima and K Saito. “Detection of incidental breast tumors by noncontrast spiral computed tomography of the chest”. Radiat Med. 2008; 26: 362-367.
- Fenster and DB Downey. “3-D ultrasound imaging: a review”. IEEE Eng. Med. Biol. Mag. 1996; 15: 41-51.
- H Degani, V Gusis, D Weinstein, S Fields and S Strano. “Mapping pathophysiological features of breast tumors by MRI at high spatial resolution”. Nat Med. 1997; 3: 780-782.
- CR Gentle. “Mammobarography: a possible method of mass breast screening”. J Biomed Eng. 1988; 10: 124-126.
- N Harberland, K Ebmeier, R Hliscs, J Grunewald and R Kalff. “Intraoperative CT in image-guided surgery of the spine”. Journal of Medicamundi. 1999; 43: 24-32.
- R Gwinn, K Cleary and M Medlock. “Use of portable CT scanner during resection of subcortical supratentorial astocytomas of childhood”. Journal of Pediatric Neurosurgery. 2000; 32: 37-43.
- CR Gentle. “Mammobarography: a possible method of mass breast screening”. Journal of Biomedical Engineering. 1988; 10: 124-126.
- M Schulder and P Carmel. “Intraoperative magnetic resonance imaging: impact on brain tumor surgery”. Journal of Cancer Control. 2003; 10: 115-125.
- M Wolverson, E Houttuin, E Heiberg, M Sundaram, and J Shields. “Comparison of computed tomography with high resolution real time ultrasound in the localization of the impalpable undescended Tests”. Journal of Radiology. 1983; 146: 133-136.
- C Kaufman, L Jacobson, B Bachman and L Kaufman. “Intraoperative ultrasound facilitates surgery for early breast cancer”. Journal of Annals of Surgical Oncology. 2007; 9: 988-993.