
Research Article
Austin J Biosens & Bioelectron. 2023; 8(1): 1042.
Utility of Chromogenic Properties of P-Dimethylaminobenzaldehyde for Determination of Certain Anti-Depressant Drug in Bulk, Pharmaceutical Preparation and Application to Tablets Uniformity Testing
Eltoukhi WE¹*, Saraya RE², Hassan YF¹ and Salman BI¹
1Department of Pharmaceutical Analytical Chemistry, Faculty of Pharmacy, Al-Azhar University, Assiut 71526, Egypt
2Department of Pharmaceutical Analytical Chemistry, Faculty of Pharmacy, Port Said University, Port Said 42511, Egypt
*Corresponding author: Walid E Eltoukhi Department of Pharmaceutical Analytical Chemistry, Faculty of Pharmacy, Al-Azhar University, Assiut 71526, Egypt
Received: November 16, 2022; Accepted: December 29, 2022; Published: January 05, 2023
Abstract
Simple, sensitive, accurate, and precise spectrophotometric assay has been developed and validated for the determination of selected anti-depressant drug namely; Milnacipran HCl (MCN) in pure form and pharmaceutical formulation. The method was based on the reaction of methanolic solution of selected anti-depressant drug with p-dimethylaminobenzaldehyde in acidic medium which give yellow product that can be determined at λex = 400 nm. The optimization of the reaction conditions such as the type of solvents, reagent concentration and reaction time were investigated. Under the optimum conditions, beer’s law is obeyed in the concentration range 60-300 μg mL-1, with good correlation coefficient (r² ≥ 0.998) and with a standard deviation (RSD% ≤ 0.0095). The limits of detection & the limits of quantification were found to be 13.1 and 40.0 μg mL-1, respectively. A Job’s plot of the absorbance versus the molar ratio of MCN to p-dimethylaminobenzaldehyde under consideration indicated (1:1) ratio. The method were successfully applied to the determination of MCN in its pharmaceutical formulation and the results obtained by the proposed method for the pure MCN and commercial tablets agreed well with those obtained by the reported method.
Keywords: Milnacipran hydrochloride; p-dimethylaminobenzaldehyde; Spectrophotometry; Dosage form; Content uniformity
Introduction
Depression is a mood disturbance that is significantly distinguishable from the usual mood fluctuations of everyday life. It may be accompanied by other mental or somatic symptoms representing several depressive syndromes [1]. Up to half of all patients with depression may attempt suicide during their lifetime [2]. Risk factors for developing depression include; female gender and a positive family history [3]. Milnacipran hydrochloride (MCN): chemically named as 1-phenyl-1- (diethylaminocarbonyl)-2-(aminomethyl)cyclopropane (Figure 1). MCN is a norepinephrine and serotonin reuptake inhibitor, for cure of depression and fibromyalgia [2]. Several analytical assays were described for the detection of selected drug such as spectrophotometric [4-8], Spectrofluorimetric [9,10], HPLC [11,12], HPTLC [15-17]. From the reported methods we found that there is a method has been described for determination of MCN which depends on measurement of the absorbance of cited drug solution at the cutoff point of many solvents 220 nm, which limits the methods selectivity [18]. MCN also determined by derivatization with ninhydrin to give a purple colour that could be measured at 570 nm after heating at elevated temperature (120°C) on a glycerol bath which increases the overall assay time [19]. Moreover, chromatographic methods required sophisticated instrumentation, consuming large volumes of organic solvents which elevate the cost and have bad impact on the environment. The described assay aims to develop accurate simple, sensitive procedure for the detection of MCN in bulk and dosage forms using spectrophotometric technique by utilizing readily available chemical coupling p-dimethylaminobenzal- dehyde, which has been successfully utilized for spectrophotometric detection of many raw materials [20-23]. The described assay depends on measuring the absorbance intensity of the resulting product at 400 nm, it was validated according to ICH recommendations [24], in addition, it has been used for content uniformity testing of the studied tablet preparations according to USP guidelines [25].
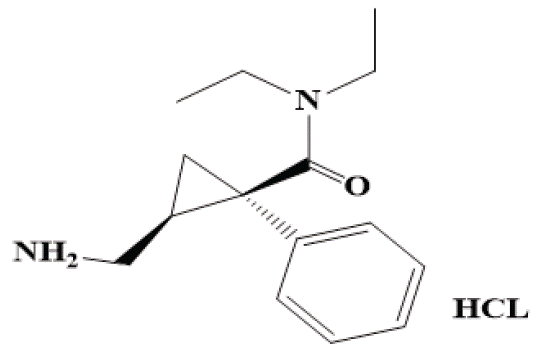
Figure 1: Chemical structure of the selected drug.
Material and Methods
Apparatus and Software
A Shimadzu UV–visible spectrophotometer equipped to PC (Tokyo, Japan) with 1 cm quartz cell, super vortex mixer (Gemmy industrial co. Taiwan, china), digital analytical balance (Meltter Toledo, Glattbrugg, Switzerland), ultrasonicator (Cole- Parmer, Chicago, USA), thermostatically controlled water bath (Germany). All calculations and statistics have been occurred by using GraphPad InStat version 3.05® software.
Pharmaceutical Compounds
Sample of investigated drugs were generously supplied by their respective manufacturers and were used without further purification.
Milnacipran hydrochloride (MCN, 99.80 %) was kindly supplied by Averroes pharma for Pharmaceutical Industries, 6th industrial zone, Sadat City, Menoufia, Egypt. Different dosage form available in Egyptian market was analyzed:
Averomilan® tablets; labeled to containing 50 mg of MCN (B.N.# 171100) provided by Averroes pharma for Pharmaceutical Industries, 6th industrial zone, Sadat City, Menoufia, Egypt.
Materials and Reagents
All reagents used were of analytical grade (El Nasr chemical co., Abu Zaabal, Cairo, Egypt).0.5 % w/v of p-dimethylaminobenzaldehyde was prepared in 0.5 M sulfuric acid [22].
Preparation of Standard Solution
An accurate weight equal to 100.0 mg of each the cited drug was carefully and separately transferred into 100-mL volumetric flask. The powder was dissolved in 25 mL methanol and diluted to the final mark with the same solvent to obtain a stock solution of 1.0 mg mL-1. Further dilutions were made with methanol to obtain working standard solution in the range of calibration curves.
General Procedure
Adjusted measured volumes from the cited drug, experimental standard drug solutions, equivalent to (300-1500 micrograms per milliliter) for MCN were transported to 5-mL volumetric flask, to each flask add 1 mL of (0.5%w/v) p-dimethylaminobenzaldehyde, the solutions were mixed well, then allowed to stand for 15 min at room temperature (20 ± 25°C) and diluted to the final mark with methanol. The absorbance was measured at 400 nm against reagent blank. The absorbance has been plotted against the final concentration of cited drug (μg mL-1), calibration curve was constructed and the regression equationwas derived using GraphPad In Stat version 3.05.
Applications of the Proposed Assay
Application to pharmaceutical formulations: Twenty tablets of cited dosage form containing MCN were weighted accurately, finely ground in a mortar and mixed well. An accurately weighed quantity of the ground tablets equivalent to 100.0 mg of studied drug was added into a 100- mL volumetric flask, about 80 mL of methanol were added and the flask was sonicated for 20 min [26], completed to the mark with the same solvent and then filtered. The first portion of filtrate was discarded. Aliquots of this solution were transferred into a series of 5- mL volumetric flasks to get sample solutions (60-300 μg mL-1) for MCN and analysis was completed as previously mentioned.
Result and Discussion
Absorption Spectrum
p-dimethylaminobenzaldehydeis an organic compound containing amine and aldehydemoieties which react by condensation with aromatic or aliphatic amino group to give a yellow color in acidic medium [21]. In the present investigation, we investigate the development of accurate, reproducible and adequately sensitive spectrophotometric methods for determination of MCN as antipsychotic drug in bulk powder and pharmaceutical formulations. The method is based on the reaction between the primary amino group of the cited drug and the aldehyde moiety of p-dimethylaminobenzaldehydein presence of 0.5M sulfuric acid which gives the yellow color, after removal of water, which can be measured at 400 nm. (Figure 2) and the new absorption band which is characteristic to the drug to assay of cited drug in bulk and pharmaceutical formulations, and testing of uniformity.
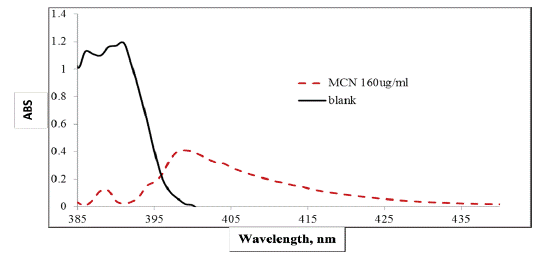
    Figure 2: Absorption spectra of MCN before and after reaction with

0.5% w/v p-dimethylaminobenzaldehyde.
Optimization of Reaction Variables
Factors affecting the reaction conditions (volume of p-dimethylaminobenzaldehyde, concentration of sulfuric acid, type of different acids, condensation time and the diluting solvent) at room temperature (25 ± 5oC) were investigated by altering each variable in turn while keeping the others constant and noting its effect on the absorbance intensity of the colored product which measured at 400 nm.
Volume of P-dimethylaminobenzaldehyde
Different volumes (ranging from 0.3 – 2.0 mL) of 0.5% w/v p-dimethylaminobenzaldehyde were used for the general assay procedure; It was found that the maximum absorbance intensity was obtained when the reagent volume was 1 mL (Figure 3)
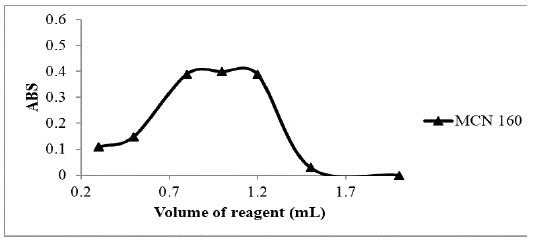
    Figure 3: Effect of volumes of p-dimethylaminobenzaldehyde (0.05

% w/v) on the absorption intensity of the studied drug (160 μg mL-1).
Concentration of Sulfuric Acid
Different concentrations (ranging from 0.4 – 1 M) of sulfuric acid were used for the general assay procedure; It was found that the maximum absorbance intensity was obtained when the concentration of acid was 0.5 M (Figure 4).
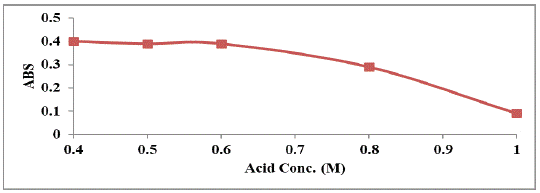
    Figure 4: Effect of molarity of sulphuric acid on the absorption intensity

of the studied drug (160 μg mL-1).
Type of Acids
The effect of different acids on the absorption intensity of cited drugs was studied using hydrochloric acid, nitric acid, sulfuric acid, and o- phosphoric acid (0.5 M). It was found that sulfuric acid was best acid, as it gave the highest absorption intensity (Figure 5).
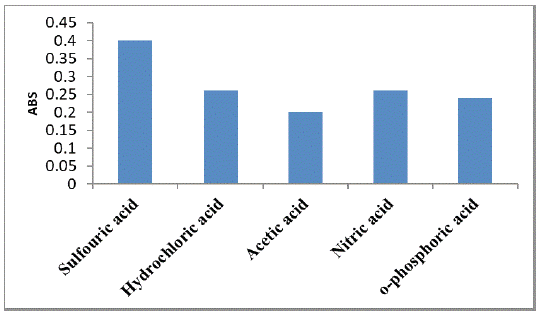
    Figure 5: Effect of different acids on the absorption intensity of the

studied drug (160 μg mL-1).
Reaction Time and Stability of Color
The effect of time on the formation of the yellow colored product between the cited drugs and p-dimethylaminobenzaldehyde has been examined. It has been found that the maximum absorption intensity was established within 15 minutes and remained stable for at least 30 minutes (Figure 6).
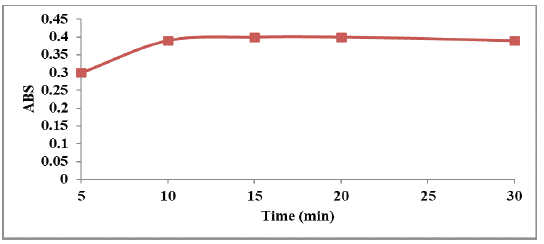
    Figure 6: Effect of time on the absorption intensity of the studied

drug (160 μg mL-1).
Effect of Diluting Solvents
For selection of the most suitable solvent for the suggested procedure, various diluting solvents were examined including dimethyl formamide, ethanol, methanol and water. Methanol was found to be an ideal diluting solvent as it afforded maximum sensitivity, and therefore, it was selected for further investigations, (Figure 7).
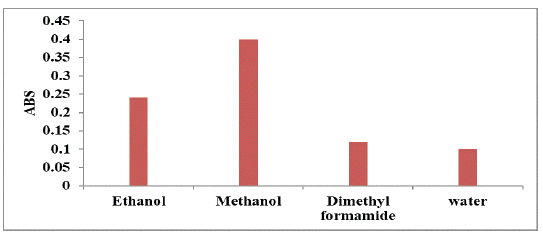
    Figure 7: Effect of different diluting solvents on the absorption intensity

of the studied drug (160 μg mL-1).
Investigation of the Molar Ratio between P-Dimethylaminobenzaldehydeand Studied Anti-Depressant Drug
The stoichiometry between MCN and p-dimethylaminobenzaldehyde was determined using Job’s method of continuous variation [27] using (3.3 ×10⁻² M) master equimolar solutions of both p-dimethylaminobenzaldehyde and the studied drug. The results revealed a 1:1 ratio between p-dimethylaminobenzaldehyde and MCN (Figure 8) and was in agreement with the suggested reaction mechanism [22]. This yellow colored product has been established from the reaction of primary amine group of MCN and the aldehyde moiety of p-dimethylaminobenzaldehydein acidic condition and removal of water, the suggested reaction mechanism is outlined in (Figure 9).
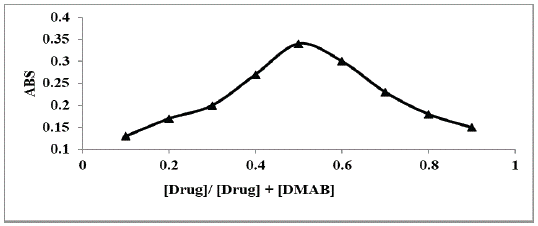
    Figure 8: Plot of Job’s method for the determination of molar ratio

of studied drugs and p-dimethylaminobenzaldehyde using 3.3×10⁻²

M equimolar solution.
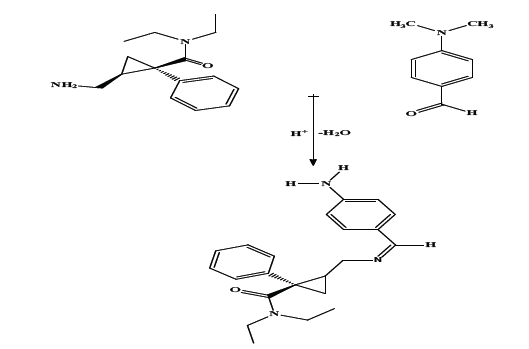
Figure 9: The suggested reaction mechanism between MCN & pdimethylaminobenzaldehyde.
Validation of the Proposed Method
The suggested assay was verified and validated according to ICH guidelines [28] in order to show that the developed procedures agree with the demands of the cited analytical performance. All validation procedures were checked through the defined calibration range scale of the developed assay to confirm the validation of the proposed method.
Linearity & Range
Under the optimized reaction conditions, standard calibration graphs for MCN have been constructed by analyzing a series of six concentrations of the cited drug, taking the mean of three determinations for each concentration to minimize the relative error. The absorbance versus concentrations within the specified range, were plotted and treated statistically by calculation of a regression equation by least squares method [28]. In this work, concentrations ranging from 60 – 300 μg mL-1 have been examined for MCN and the different analytical parameters such as correlation coefficient (0.9990), intercept 0.0217), slope (0.0024) and standard deviation of the intercept (0.0095) for MCN were presented in (Table 1). The Lower Limit Of Detection (LOD) was found to be 13.1 μg mL-1 and lower limit of quantitation was found to be 40.0 μg mL-1.
    Parameter

    Milnacipran (MCN)


    λmax (nm)

    400


    linear range (μg mL-1)

    60-300


    LOD (μg mL-1)

    13.1


    LOQ (μg mL-1)

    40.0


    Correlation coefficient (r)

    0.999


    Determination coefficient (r2)

    0.998


    Slope (b)

    0.0024


    Intercept (a)

    0.0217


    SD of the intercept (Sa)

    0.0095


    SD of slope (Sb)

    0.00005


    SD of residual ( Sy.x)

    0.01095


    *Average of 3    determinations.
Table 1: Analytical parameters for the analysis of the cited drug by

proposed assay.
Accuracy and Precision
The accuracy was examined by three times assays for six different concentrations of the pure drug. The values presented in (Table 2) showed the high acceptance between the correct estimations and the experimental estimations indicating a good accuracy for the represented assay. Repeatability and Intermediate precision have been determined using three different concentrations of MCN and three determinations of each concentration. The calculated (RSD) values were below 2%, indicating good repeatability and reliability for the suggested assay. The results and their statistical analysis were summarized in (Table 2).
    Parameter

    MCN (%found)*


    Taken (μg mL-1)

    120.0

    160.0

    200.0


      Repeatability

    1

    99±0.71

    100±0.91

    97.5±0.5


    2

    98.2±0.82

    98.4±1.1

    98.5±0.7


    3

    97.5±0.9

    99.6±0.7

    97.6±0.81


    Mean± SD

    98.2±0.75

    99.2±0.83

    97.8±0.6


      Intermediate precision

    1

    99.3±0.73

    97.7± 0.83

    98.8±0.75


    2

    98.2±0.6

    98.5±1.2

    98±0.56


    3

    97.9±0.76

    99.3±0.91

    97.7±0.0.6


    Mean±SD

    98.5±0.74

    98.5±0.8

    98.2±0.6


    *Average    of 3 determinations.
Table 2: Evaluation of accuracy and precision of the proposed assay.
Detection Limit (LOD) and Quantitation Limit (LOQ)
Detection and quantitation limits were calculated according to ICH Guidelines Q2 (R1) recommendation [24] through the equations:
LOD = 3.3* standard deviation of the response /slope
LOQ = 10* standard deviation of the response /slope
The detection limits was 13.1μgmL-1 while quantitation limits was 40.0 μg mL-1 for MCN. The results are summarized in (Table 1).
Robustness
Robustness was checked for little and fixed change in the variables of the developed assay as: volume of p-dimethylaminobenzaldehyde, concentration of sulfuric acid and the reaction time. During those assays, one parameter was varied whereas the other parameters remained constant and the recovery percentage was determined each time. The obtained recoveries and standard deviations indicate a little difference in each of the studied parameter had no significant effect on the absorption intensity of the resulting product (Table 3).
    Parameter

    Mean*±SD


    MCN(160μg mL-1)


    Optimum condition

    99.2±0.6


    1- Volume of PDMAB (mL)


    0.8

    96.8±0.3


    1.2

    98.3±0.7


    2- Molarity of selected acid (M)


    0.4

    97.5±0.9


    0.6

    98.7±0.9


    3- Reaction time (minutes)


    10

    98.2±0.7


    20

    97.6±0.8


    *Average    of 3 determinations.
Table 3: Robustness of the proposed assay for the analysis of selected

drug.
Application
Pharmaceutical application: The suggested assay was used for the detection of tablet formulation of the selected drugs; the results obtained were compared by those of reported methods [18] by applying student's t-test and the variance ratio F-testat 95% confidence level. No significant difference was noticed between the values of the suggested and reported methods. This indicates the high accuracy and precision in the assay of the investigated compound (Table 4).
    Pharmaceutical dosage forms

    Mean±SDa

    t-valueb


    Proposed method

    Reported method

    F-valueb


    Averomilan®(50 mg MCN/tablet)

    98.7±0.4

    98.9±0.4

    0.7

    1.1


    aAverage of 3 determinations.


      bTabulated    values at 95% confidence limit are t =2.306, F= 6.338
Table 4: Comparison between the proposed assay and the reported

method for the determination of the selected antipsychotic drug in its

tablet dosage form.
Content uniformity test: The method was applied to content uniformity test that is a time-consuming procedure when applying normal experiment techniques, owing to the great accuracy of the suggested assay and its capacity to quickly determine the content of the drugs in only one tablet obtained with adequate precision. Ten different tablets have been assayed by applying the same experiment which used to analyze MCN drug in tablets. The uniformity contents have been checked using the official United State Pharmacopeia guidelines [25] (Chapter 905: Uniformity of Dosage Units). The Acceptance Value (AV) was determined for all dosage forms and it was established to be very smaller than the maximum allowed acceptance value (L1). The results of content uniformity of commercial preparation are shown in (Table 5).
    Dosage form no.

    Averomilan® 50mg


    % labeled claim*


    1

    97.7±0.7


    2

    98.5±0.9


    3

    99.1±1.1


    4

    97.9±1.0


    5

    98.5±7


    6

    98.8±0.8


    7

    99.1±1.2


    8

    98.8±1.1


    9

    98.1±0.9


    10

    99.0±0.78


    Mean±SD

    98.5±0.5


    Acceptance value (AV)

    1.2


    Max. allowed AV(L1)

    15.0


    Acceptance    value =2.4 × SD.


      *Average of 3    determinations.
Table 5: Results of content uniformity testing of selected drug tablets

using the proposed method.
Conclusion
In the presented study, p-dimethylaminobenzaldehyde has been selected as coupling reagent to form a yellow colored product with Milnacipran HCl. The presented work possesses the advantages of being sensitive, simple, rapid, reliable, and accurate for the analysis of the antipsychotic drugs in its bulk and commercial tablets. In addition, it is a time-saving method and there is no need for pre-treatment or extraction of the samples. Moreover, the suggested assay is very suitable to be applied in tablet content uniformity test and for routine assay and quality control inspection of the studied antipsychotic drug.
References
- Harvey R, Clark M, Finkel R, Rey J, Whalen K. Lippincott’s illustrated reviews: pharmacology, philadelphia: wolters kluwer. 2012.
- Sweetman S, Martindale: The complete drug reference, royal pharmaceutical society of great britain, pharmaceutical press, London, 37th ed. 2011.
- Khandelwal S, Regmi S, Mendis N, Killirattanapaiboon P. Conquering depression. World Health Organization, Geneva, East Asia. 2001: 120.
- Parejiya P, Shelat P, Patel R, Barot B, Shukla A. Development and validation of UV spectrophotometric method for determination of milnacipran in bulk and pharmaceutical dosage form. Eurasian journal of analytical chemistry. 2011; 6: 53-58.
- Ramachandran. D, Visible spectrophotometric methods for the quantitative estimation of Milnacipran in their formulations, International journal of Pharm Tech Research. 2012; 4: 970-974.
- Mubarakunnisa M, Rani A, Harika S, Sekaran C, Quantitative determination of Milnacipran by simple colorimetric methods. Chemical engineering and science. 2013; 1: 1-6.
- Srinivas R, Yadagiriswamy P, Venkateshwalru G. Spectrophotometric determination of drugs in bulk and tablet form by using 2, 3-dichloro-5, 6-dicyano-1, 4-benzoquinone. International journal of ananlytical and bioanalytical chemistry. 2015; 5: 88- 93.
- Hussain H, Shahzad M, Hayat K, Hussain K, Bukhari N. Simple and sensitive colorimetric method for the determination of Milnacipran in bulk and swellable matrix tablets. journal of pharmaceutical chemistry. 2016; 50: 346-352.
- Atia NN, Marzouq MA, Hassan AI, Eltoukh WE. A new sensitive approach for spectrofluorimetric assay of Milnacipran and Amisulpride in real plasma and pharmaceutical preparations via complexation with Eosin Y dye. Spectrochimica Acta Part A: Molecular and Biomolecular Spectroscopy. 2019; 214: 399-406.
- Mostafa I, Omar M, Nagy D, Derayea S. Utility of the chromogenic and fluorogenic properties of benzofurazan for the assay of milnacipran in human urine and plasma. RSC Advances. 2018: 8; 22154-22160.
- Atia NN, Marzouq MA, Hassan AI, Eltoukh WE W. Development of two spectrophotometric methods for quantification of certain anti-depressant drug in pure, pharmaceutical formulation and application to content uniformity testing. Microchemical Journal. 2019; 147: 1048-1054.
- Khatri D, Mehta P. Isolation and chracterization of related impurity in Minacipran hydrochloride active pharmaceutical ingredient. Journal of liquid chromatography & related technologies. 2014: 37; 1133-1144.
- Parejiya P, Movaliya V, Barot B, Modi D, Shelat P, Shukla A. Quantitative determination of Milnacipran HCl in rabbit plasma by HPLC and its application to pharmacokinetica study. Journal of liquid chromatography & related technologies. 2014; 37: 99- 111.
- Sarvanan G, Yunoos M, Kumar P, Kumar A. Sstability indicating RP-HPLC method for the estimation of Milnacipran hydrochloride in bulk and its pharmaceutical dosage from. Asian journal of pharmaceutical reserchs. 2014: 7; 121-124.
- Khatri D, Mehta P. Stability-indicating HPTLC method for determination of milnacipran hydrochloride in pharmaceutical formulations. Journal of Planar Chromatography & Modern TLC. 2011; 24: 412-418.
- Abdel-Ghany A, Wafik E. Stability-indicating HPTLC methods for determination of milnacipran HCl, duloxetine HCl, and pregabalin in bulk drug and pharmaceutical formulations. Journal of analytical chemistry. 2017; 7: 117-142.
- Singhvi G, Shukla V, Ukawala R, Gampa G, Saha R. Development of a new, rapid and sensitive HPTLC method for estimation of Milnacipran in bulk, formulation and compatibility study. Arabian Journal of Chemistry. 2017; 10: 2417-2423.
- Parejiya P, Shelat P, Patel R, Barot B, Shukla A. Development and validation of UV spectrophotometric method for determination of milnacipran in bulk and pharmaceutical dosage form. Eurasian Journal of Analytical Chemistry. 2011; 6: 53-58.
- Hussain T, Shahzad M, Hayat. HK, Bukhari N. Simple and sensitive colorimetric method for the determination of Milnacipran in bulk and swellable matrix tablets. Pharmaceutical Chemistry Journal. 2016; 50: 346-352.
- Adegoke O, Nwoke C. Spectrophotometric determination of hydralazine using p-dimethylaminobenzaldehyde. Journal of Iranian Chemical Society. 2008; 5: 316-323.
- Adegoke O, Thomas O, Makanjuola D, Adewole O. Spectrophotometric determination of olanzapine after condensation with p-dimethylaminobenzaldehyde. Journal of Taibah University for Science. 2014; 8: 248-257.
- Gurupadayya B, Vishwajith V, Srujana N. Spectrophotometric methods for the estimation of pramipexole dihydrochloride in pharmaceutical formulations. World journal of chemistry. 2009; 4: 157-160.
- Atia NN, Marzouq MA, Hassan AI, Eltoukh WE. Development of two spectrophotometric methods for quantification of certain anti-depressant drug in pure, pharmaceutical formulation and application to content uniformity testing. Microchemical Journal. 2019; 147: 1048-1054.
- I.C.H. Guideline, Validation of analytical procedures: text and Methodology. (available at http://www.ich.org): Incorporated in November 2005., Q2 (R1), 1 (2005).
- Zhang G, Terry A, Bartlett M. Sensitive liquid chromatography/ tandem mass spectrometry method for the simultaneous determination of olanzapine, risperidone, 9-hydroxyrisperidone, clozapine, haloperidol and ziprasidone in rat brain tissue. Journal of Chromatography B. 2007; 858: 276-281.
- Hammad MM, Omar. MA, Eltoukhi WE. Validation of Rapid and Sensitive Spectrofluorimetric Assay for Determination of Four Triptans in Pure and Dosage Forms; Application to Human Plasma and Content Uniformity Testing. Pharm Anal Acta. 2016; 7: 2-8.
- Harvey D. Modern analytical chemistry, McGraw-Hill New York, 2000.
- Miller JN, JC. Statistics and chemometrics for analytical chemistry, Harlow, England: Pearson Education, 2005.
Citation: Eltoukhi WE, Saraya RE, Hassan YF, Salman BI. Utility of Chromogenic Properties of P-Dimethylaminobenzaldehyde for Determination of Certain Anti-Depressant Drug In Bulk, Pharmaceutical Preparation and Application to Tablets Uniformity Testing. Austin J Biosens & Bioelectron. 2023; 8(1): 1042.