
Research Article
Austin J Biotechnol Bioeng. 2025; 12(1): 1139.
Is Anaerobic Digestion Energy Viable?
Nait Hmad L1,4, Colin A2, Terekhova A2, Boissonnade M2, Diop S3, Boussaada I3,4 and Taidi B1*
1University of Paris Saclay, CentraleSupelec, Laboratoire de Génie de Procédés et Matériaux (LGPM), 3 rue Joliot Curie, 91190 Gif Sur Yvette, France
2University of Paris Saclay, CentraleSupelec, 3 rue Joliot Curie, 91190 Gif Sur Yvette, France
3University of Paris-Saclay, CentraleSupelec, CNRS, Inria, Laboratoires des Signaux et Systèmes (L2S), 5 rue Joliot Curie, 91190 Gif Sur Yvette, France
4IPSA, 63 Bd de Brandebourg Bis, 94200 Ivry-sur-Seine, France
*Corresponding author: Behnam TAIDI, University of Paris Saclay, CentraleSupelec, Laboratoire de Génie de Procédés et Matériaux (LGPM), 3 rue Joliot Curie, 91190 Gif Sur Yvette, France Email: behnam.taidi@centralesupelec.fr
Received: January 02, 2025; Accepted: January 22, 2025 Published: February 03, 2025
Abstract
Anaerobic digestion (AD) is a biological process carried out by microorganisms that convert organic matter into microbial biomass and biogas, primarily composed of methane and carbon dioxide. AD is increasingly being implemented on farms for renewable energy production. For AD to be energetically viable, the energy generated from the biologically produced methane must exceed the energy spent for its production. The energy spent for the production of methane is related to the transport of biomass to the anaerobic digester, together with stirring and heating the bioreactor. The latter are influenced by the size and volume of the reactor.
To facilitate the energetic assessment of various AD operations, publicly available data was utilized to develop an ExcelTM model. This model takes into account associated operations, such as biomass collection and transportation to the AD reactor. The model was used to determine the energetic break-even point for bio-methane generation. A feed mixture of 60% energy crops and 40% cow dung, with energy crops represented by sugarcane, was used for all simulations at different tonnages of feed per year.
Across eighteen simulations, the model demonstrated an average annual energy productivity of 2.42 × 10⁶ Wh/ton of volatile solids (VS). Notably, for all digester volumes exceeding 75 m³, the AD process was energetically efficient, producing more energy than required for its operation. The overall economic viability of an AD operation is highly dependent on local and national financial incentives and was not modelled.
This tool enables the identification of optimal conditions concerning size and location for any AD operation, thereby enhancing its efficiency and profitability.
Keywords: Energetic balance; Anaerobic Digestion; Biogas; Energetic viability; Circular economy; Renewable energy; Sustainability
Graphical Abstract
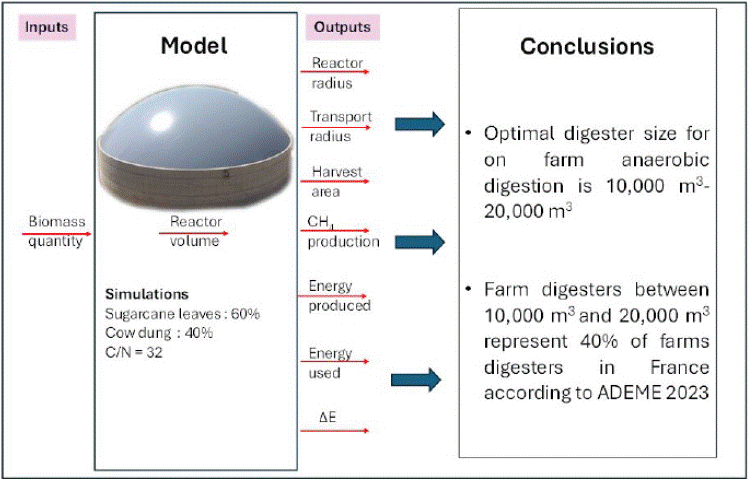
Legend: A ratio of 1.5 exists between reactor volume and biomass quantity (reactor volume = 1.5 biomass quantity). Digester image is from: https://www.bioenergie-promotion.fr/59547/membrane-systems-propose-la-protection-en-tissu-boucle-pour-beton-de-digesteur/.
Abbreviations
AD: Anaerobic Digestion; VS: Volatile Solids; VFA: Volatile Fatty Acids; CH4: Methane; CO2: Carbon Dioxide; H2: Hydrogen; H2S: Hydrogen Sulfide; CSTR: Continuous Stirred Tank Reactor; IEA: International Energy Agency; ADEME: French Agency for the Environment and Energy Management; TS: Total Solids; Wh: Watthour; TVS: Total Volatile Solids; OLR: Organic Loading Rate; CM: Cow Manure; SL: Sugarcane Leaves; SS: Sewage Sludge
Introduction
Due to the oxidizing conditions on Earth, all organic matter on this planet is ultimately converted to biomass, CO2 and water. AD produces microbial biomass, a nutrient-rich solid residue that can be used as a fertilizer, a liquid digestate and biogas, rich in methane. AD provides a shunt through which energy can be obtained from part of the organic matter on its way to being oxidized completely to CO2 and water. The methane can be used for combustion locally or injected into the national gas grid. AD produces bioenergy, which is energy derived from any fuel that originated from biomass and not from fossil sources. This contrasts with fossil energy which is a generic term for non-renewable energy sources such as coal, natural and derived gas, crude oil, petroleum products and non-renewable wastes. The problem with using fossil fuels is that their use effectively puts fossilised CO2 into the atmosphere exacerbating the greenhouse effect and global warming. The French Agency for the Environment and Energy Management (ADEME) has listed more than 1175 anaerobic digestion units in France in 2022 [1] and approximatively 3385 in 2023 [2]. Four scenarios have been established to reduce energy consumption as well as CO2 emissions (decarbonation) by 2030 and 2050. The first scenario is the one generating the lowest energy demand of 1.39×1015 Wh by 2030 [3] for France. A Wh is the amount of electricity produced at a certain voltage (V) with a certain current (A) per hour (V*A*h). According to the International Energy Agency (IEA), fossil fuels (natural gas, oil, and coal) accounted for up to 68% of the world's primary energy supply in 2020 [4]. Renewable energy sources only contributed a mere 31%, therefore, a large fraction of the global energy demand is still satisfied with fossil fuels. Comparatively, fossil fuels accounted for up to 79% of the world's energy supply while renewable energy sources represented 21% in 2007. The change towards using renewable energy is slow but in the right direction.
On a world basis, the IEA estimated that between 2007 and 2030, fossil fuels will remain the most dominant energy source worldwide, representing less than 77% of the total energy needs. In 2020, fossil fuels signified 78% of total energy production. This slight decrease in fossil fuels’ share between 2020 and the estimated one in 2023 is compensated by the increase in the renewable energy share. In conclusion, renewable energy is becoming increasingly important among energy sources. The total energy needs are estimated at 1.09×10¹⁷ Wh and 9.55×10¹⁶ Wh for 2030 and 2050 respectively [5]. The IEA targets total energy productions of 1.51×10¹⁷ Wh and 1.50×10¹⁷ Wh for 2030 and 2050 respectively. The energy requirement must be met by renewables energies. In short, the global contribution of renewable is set to increase in the coming years.
AD is a widely used renewable energy source (Figure 1). In 2020, Europe relied heavily on AD with a total reported methane production of 2.09×10¹⁴ Wh, as opposed to 1.62×10¹⁴ Wh for the rest of the world [6]. Energy consumption increases yearly as does biogas production and new anaerobic digestion units are built with a significant financial investment [7]. There are not enough energy and economic studies related to the process although the economics of methane production depend heavily on local taxation and incentives. This brings us to an essential question: is anaerobic digestion energy -efficient and -economical? To illustrate the energetic potential of anaerobic digestion, various simulations were compared at different scales.
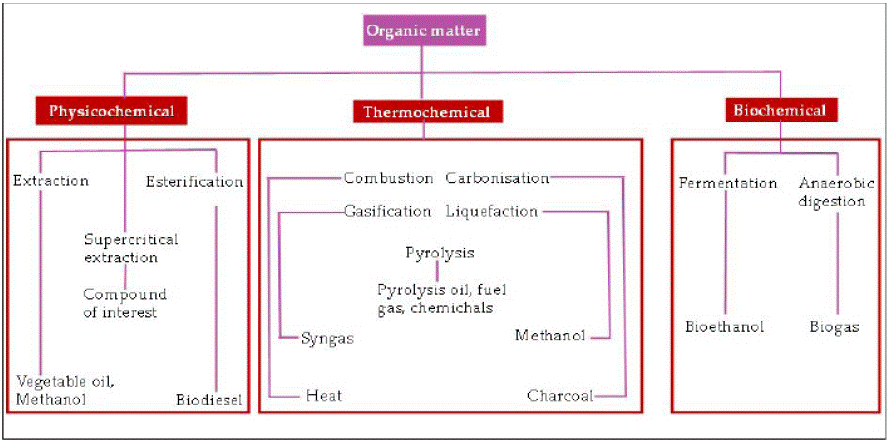
Figure 1: Biologically Sourced Biomass conversion processes.
An overview of the processing efficiency of various quantities of biomasses (cow dung and energy crops) is provided. The study presented here addresses the energetic viability of AD in general considering different operational models (Figure 2)
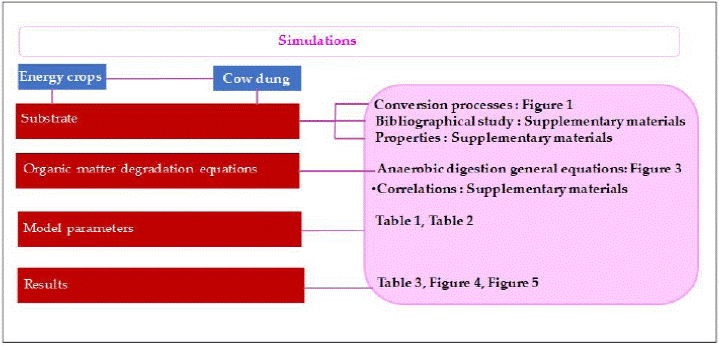
Figure 2: Summary of article’s content.
AD (Figure 3) is a complex process with four major biochemical decomposition steps: hydrolysis, acidogenesis, acetogenesis and methanogenesis. Each step is performed by specific microbial consortia going from fermentative bacteria to strict anaerobic archaea. During hydrolysis, a microbial biomass is formed, and fermentative bacteria catalyse the degradation of complex organic matter including carbohydrates, proteins, and lipids into soluble and biodegradable organic monomers such as amino acids, long chain fatty acids, and alcohols. The polymers are converted to separate easily digestible monomers. Hydrolysis is highly dependent on the nature of the biomass and all the macromolecules within the biomass may not be hydrolysed at the same rate resulting in the gradual release of certain monomers before others.
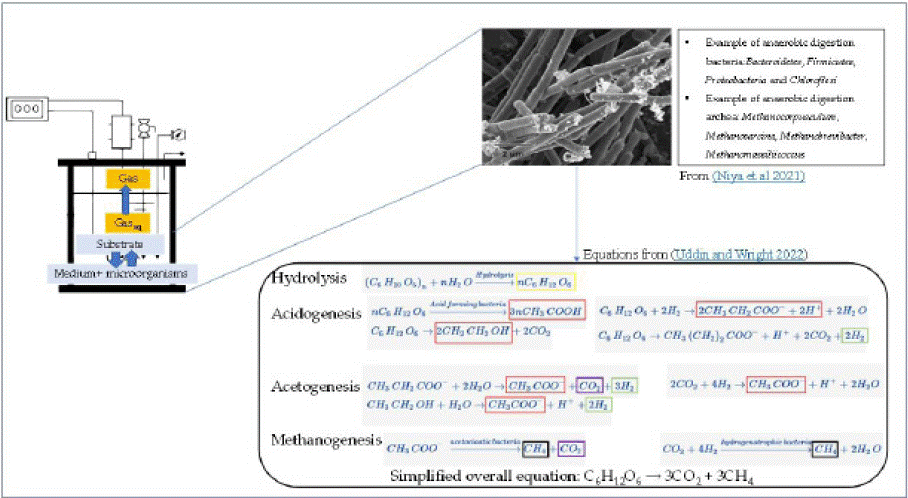
Figure 3: Anaerobic digestion process.
Acidogenic bacteria convert monomers into volatile organic acids (VFA), CO2 and H2 and then the VFAs are further converted into acetic acid by acetogenic bacteria. Finally, during methanogenesis organic compounds are broken down by anaerobic archaea to a gaseous mixture (CH4, CO2, H2S) called biogas with CH4 and CO2 as principal components.
The process is polyphasic with solid substrate and microorganisms, liquid digestate and a gaseous phase composed of biogas (Figure 3).

(Equation 1)
The Buswell [8] equation (Equation 1) describes the overall equation for Anaerobic digestion. The variables are defined as follows:
• n: number of carbon (C) atoms
• a: number of hydrogen (H) atoms
• b: number of oxygen (O) atoms
• x: number of nitrogen (N) atoms
• y: number of sulfur (S) atoms
Materials and Methods
Model Parameters
General considerations: The main parameters considered when designing the energetic viability of AD operation are:
• Energetic viability was defined as a positive energy balance where the energy produced is higher than the energy used to produce it.
• The main input into the model was the amount of biomass treated per year.
• Operational costs of AD, including the energy used to transport the substrate to the AD. This is referred to as the substrate capture area. As the scale of AD increases, its efficiency increases but also more biomass is required to feed the digestor. This incurs an energy transport cost
• The energy used for the operation of the AD such as pumping and mixing and notably heating the bioreactor. Additionally, regulatory restriction requires the disinfection of certain substrates of animal origin. Heating costs decrease relatively as the reactor volume increases due to favourable surface to volume, reducing heat losses.
• The following assumptions were made:
• Cow dung contains the right microbial mix to function as a base (inoculum) for AD.
• Highly lignified substrates are not easily digested and lignin itself cannot be digested anaerobically [9].
• Biogas consists of all the gases produced by AD; mainly CO2 and CH4.
• The land productivity for energy crops was fixed at 1.6 ton.ha-1. year-1.
• The height of the digestor was kept constant at 8 m and any increases in the volume of the digestor was achieved by an increase in the radius.
• The operational temperature was 40 °C in a CSTR.
• Organic loading rate was constant at 2 kgVS.m-3.day-1.
• Methane productivity was calculated using the Buswell model [8].
• Biogas was assumed to contain 60% CH4 (v/v)
• Electrical (38%) and thermal (52%) efficiency for combusting methane. The losses were always kept constant at 10%.
• The calorific value of methane was 9.94 kW.h.m-3.
• The substrate was composed of sugar cane and cow manure at similar ratios for each simulation.
• Methane yields for the substrate were specified (Table 1).
    Substrate (s)
    Methane yield (m3/ton VS/day)
    Reference


    Cow manure
    6.60
    Shen    et al. [10]


    Sugarcane leaves
    1.38

      Sinbuathong et al. [11]


    Sugarcane leaves and cow manure    (0.80: 0.20)
    2.37


    Sugarcane leaves and cow manure    (0.65: 0.35)
    3.89


    Sugarcane leaves and cow manure    (0.50: 0.50)
    4.31


    Sugarcane leaves and cow manure    (0.35: 0.65)
    3.76
Table 1: Reported methane yields for sugarcane leaves and cow manure.
SL and CM both contain high contents of total solids, therefore, their co-digestion with a high carbon substrate is an attractive way to produce biogas. Previous studies focused on methane production from SL and CM using AD systems [10-12]. So far, studies evaluation of methane production models from SL and CM at various digester’s volumes are rare.
Simulated operating mode: The impact of model parameters on the simulations was considered (Table 2).
Model parameter
Range
Impact on the model
Substrate
Cow manure
Sugarcane biomass
- Cow manure is highly digestible and available on farms, but it is high in N.
- Sugarcane leaves have a high volatile solids content and biomethane potential being high in C.
Operating Temperature
Psychrophilic (10-30 °C)
Mesophilic (30-50 °C)
Thermophilic (50-80 °C)
- High impact on the operating costs and productivity
- High temperature may be required by legislation.
Substrate harvest radius
(307 – 11,197 m)
- High impact on the energy consumed for substrates harvesting.
Operating volume
(75 – 10,0000 m3)
- Changed in accordance with the substrate volume to consider the increased volume of biomass to be treated.
Table 2: Impact of chosen substrates on the model.
Results and Discussion
Using the developed model, eighteen scenarios with differing bioreactor volumes were simulated (Table 3). The aim was to see whether more energy was produced through methane production than it was used for the AD process.
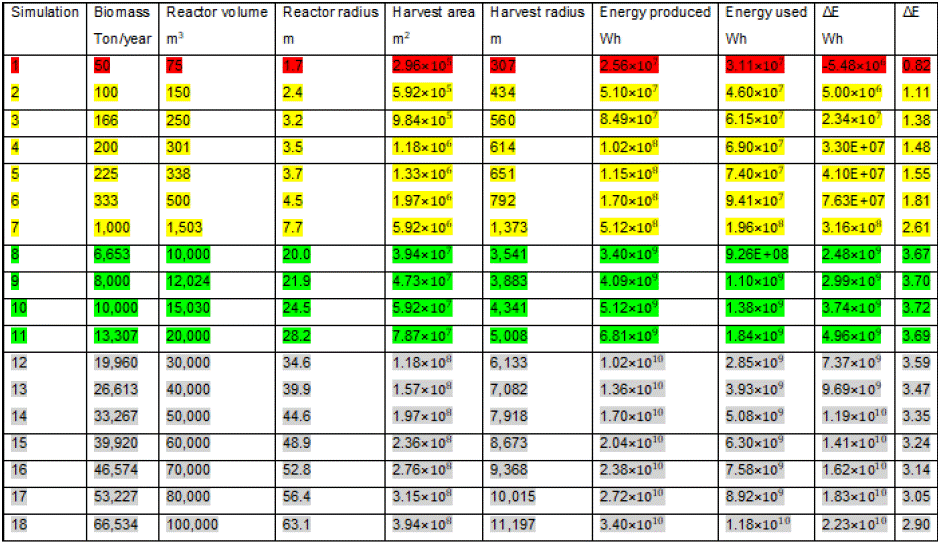
Table 3: The input and output parameters for each scenario.
Legend: The biomass composed of CM/SL used in this study was assumed to contain 91% VS per unit biomass in weight. The ratio indicates the energy produced over the the energy consumed. The following code color is adopted: Red: Low input and energy production. Yellow: Medium input and energy production. Green: High input and energy production. Grey: High input and unchanged energy production (a plateau is reached).
Energy Balance
The anaerobic digestion simulations showed distinct trends in energy production, reactor volume, and biomass harvest logistics. These trends established the potential for increasing energy output while illustrating the challenges that accompany the scaling up of biomass input and reactor size.
The energy produced across the simulations follows a clear upward trend as reactor volume and biomass input increase. For instance, Simulation 1, with a biomass input of 50 tons/year, resulted in energy production of 2.56×10⁸ Wh and consumption of 3.11×10⁸ Wh, leading to a net energy deficit with an ΔE of 0.82. This indicates that smaller reactors, particularly those with biomass inputs below 100 tons per year, may not be energy-efficient unless improvements are made in operational efficiency, substrates used or if they are in special circumstances where the biomass is collected for other reasons than specific AD. The energy deficit seen in Simulation 1 highlights the limitations of very small-scale reactors, which may struggle to reach energy self-sufficiency due to insufficient methane generation. As reactor size increases, energy efficiency improves. Simulation 2 (100 tons/year) produced 5.10×10⁸ Wh of energy, consuming 4.60×10⁸ Wh, resulting in a positive net energy gain of 5.00×10⁷ Wh and a ΔE of 1.11, represents the energetic break-even point. This simulation represents the threshold at which the anaerobic digestion process becomes energy positive. Significant improvements are seen from Simulation 3 onwards, where biomass inputs range from 166 tons/year to 225 tons/year. For example, Simulation 3 produced 8.49×10⁸ Wh, while consuming 6.15×10⁸ Wh, resulting in a ΔE of 1.38. Similarly, Simulation 4 results in a ΔE of 1.48. At this point, it becomes clear that reactors handling over 150 tons/year of biomass can achieve greater energy surpluses, showing the benefits of scaling up. The highest levels of energy efficiency are achieved in Simulations 7 to 12, where the biomass input exceeds 10,000 tons/year. These results demonstrate that reactors processing large amounts of biomass can achieve significant energy outputs. Beyond these volumes, the anaerobic digestion begins to lose its energetic efficiency.
The reactor volumes used in the simulations increase with biomass input, ranging from 75 m³ in Simulation 1 to 100,000 m³ in Simulation 18. A larger reactor allows for greater biomass digestion, which correlates with the increased energy production seen in the later simulations. Increased reactor size comes at the expense of biomass-feed harvest and transport radii, which pose logistical challenges. The harvest radius is defined by the area needed to collect biomass, and as this distance grows, the cost and complexity of transport increases. Stirring costs increase with larger volumes but heat losses are decreased due to the increased surface to volume ratio of the bioreactor.
The energy efficiency of each simulation is represented by ΔE, which compares energy produced to energy consumed. ΔE values below 1, such as in Simulation 1 (0.82), indicate energy deficits, while values above 1, as seen in Simulation 2 and beyond, represent energy surpluses. The trend of increasing ΔE with larger biomass inputs and reactor volumes shows that scaling up leads to more favorable energy balances up to reactor volumes of 20,000 m³.
Annual methane yield for the simulations was 407 m³ of methane/t of VS. Annual methane yields for anaerobic digestion units as mentioned in literature are reported to vary between 16.43 m³ and 390.08 m³ of methane/t of VS [13-16]. The scientific studies dealing with the energetic analysis of on-farm anaerobic digestion are sparse, particularly with the specific substrates used in this study, namely CD and SL. Consequently, there are only a few sources available for comparison [17].
As biomass input increases, both annual methane yield and annual energy production. In smaller systems like Simulation 1 (50 tons/year of biomass), energy production is approximately 0.82 MWh/ton VS. In contrast, larger systems such as Simulation 18 (66,534 tons/year) exhibit energy production of about 3.35 MWh/ ton VS. This trend demonstrates that larger-scale anaerobic digestion systems are considerably more efficient in generating energy per ton of volatile solids (VS) but this efficiency decreases slightly with larger biomass harvest volumes. This pattern is consistent with findings in the literature that larger-scale anaerobic digesters, due to their increased reactor volume and more efficient handling of biomass, exhibit enhanced energy outputs [18].
The results show a consistent methane specific yield coefficient of 407 m³/ton VS across all 18 simulations, despite variations in reactor size. This fixed methane yield suggests that while reactor scales do not influence the methane-specific yield directly, it significantly affects the overall energy production and system efficiency. Larger reactors (Simulations 7–18) still achieve higher energy outputs, with Simulation 18 producing up to 3.35 MWh/ton VS due to the increased biomass input and larger reactor volumes, leading to better system performance. This observation may be as a result of the reduced heat loss in larger bioreactors, only partly compensated by the increased cost of stirring the larger anaerobic digesters.
Carpentier et al and Kang et al [17, 18] reported methane yields ranging from 500–600 m³/ton VS for solid waste and food waste digesters, the fixed yield of 407 m³/ton VS in close agreement with the results of our model. This difference could be due to the composition of the feedstock or system configurations. For instance, food waste digesters are known for their high degradability, leading to higher methane yields, as confirmed by Elbeshbishy et al [19]. The results in the present study align closely with those found by Demirel and Scherer [20] where sugar beet digestion produced methane yields in a similar range (methane yields ranging from 380 to 450 m³/ton VS).
The larger simulations show improved efficiency, much like the findings from Holohan et al [21], where larger systems processing 5,000 to 50,000 tons per year achieved up to 70% energy recovery (4.0 to 5.0 MWh/ton VS), despite similar methane yields of 400–500 m³/ ton VS.
In conclusion, while the methane yield remains fixed at 407 m³/ ton VS, larger-scale systems still outperform smaller ones in terms of energy production due to larger biomass volume reaffirming the advantages of scaling up anaerobic digestion systems for enhanced energy recovery.
Optimal Digester Volumes for Anaerobic Digestion Systems
The simulations enabled the calculation of energy gain/loss (ΔE) for different digester volumes. Figure 4A illustrates the relationship between digester volume and energy efficiency. As digester volume increases, the net energy gain (ΔE) first rises, reaching a peak at a volume of approximately 10,000-20,000 m³, where the ΔE is around 1.77 MWh/tonVS. Beyond this volume, the net energy gain begins to decrease slowly, stabilizing at larger digester sizes. The inset in the figure confirms that systems larger than 10,000 m³ maintain relatively consistent energy efficiency, but no further improvements in energy recovered are observed with higher volumes.
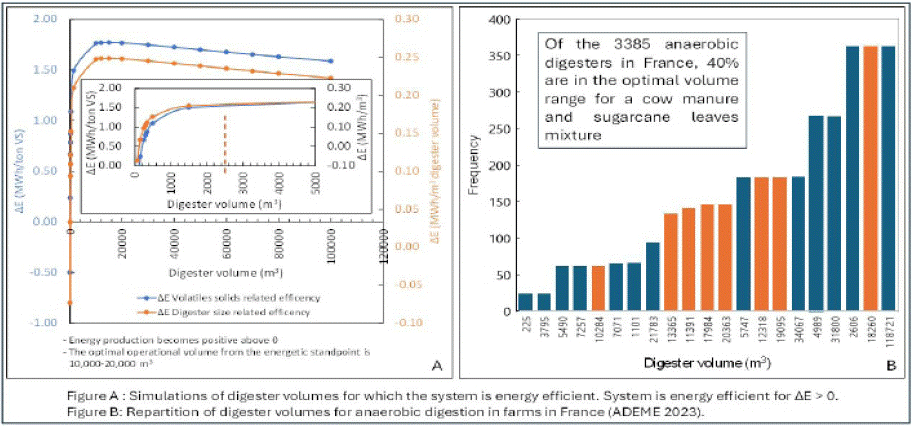
Figure 4: Digester volumes for which anaerobic digestion is energy efficient.
Figure 4B shows the distribution of digester volumes used in anaerobic digestion systems on farms in France in 2023. The histogram reveals that 40% of the digesters operate within the volume range of 10,000 to 20,000 m³, with a peak around 13,000 m³. This aligns closely with the point of optimal energy efficiency identified in the simulations. There are fewer digesters below 5,000 m³ and beyond 30,000 m³, indicating a preference for mid-range digester sizes in current applications. The authors consider this as validation of the model reported here in this article. This aligns with findings by Holohan et al [21] and Demirel and Scherer [20] which also demonstrate that mid-sized digesters maximize methane production while minimizing operational energy use. Larger systems, though capable of processing more biomass, face diminishing returns due to increased energy consumption for heating, mixing, and transport, as previously noted by Gerber and Span [22]. Again, validation of the model reported here.
The distribution of digester sizes in France further supports the adoption of this optimal volume range, reflecting similar patterns in other agricultural regions where energy recovery and efficiency are prioritized [17,23]. Systems below 5,000 m³ are less efficient, reinforcing the need for scaling up operations for better energy output. This suggests that for best energy gain across the country, anaerobic digesters of between 6,653-13,307 tons/year with a harvest radius of between 3.541-5.008 km should be operated.
Our simulation demonstrated an optimal digester volume ranging from 10,000 to 20,000 m³. It is preferable to have several digesters of 20,000 m³ each rather than a single digester of 240,000 m³ (Figure 5). In smaller reactors, there is a better homogeneity of internal conditions (temperature, mixing, heat transfer) as demonstrated in several studies [24-27]. Multiple digesters can be organized within a fixed total volume, emphasizing efficient space utilization in a digester system design. Levenspiel [24] shows that a single CSTR requires a larger volume compared to when multiple CSTRs are arranged, the total required volume decreases, thus improving efficiency and allowing for space savings. Suresh et al [25] have shown that segmenting the total volume into multiple independent units helps maintain more stable and homogeneous conditions within each reactor. Massanet-Nicolau et al [26] observed that separating the total volume into multiple units reduces the system’s sensitivity to environmental fluctuations and operational disturbances: in the event of a problem with one digester, the others can continue to function without interrupting the entire process. Xinyi Zheng and Ruying Li [27], who noted that smaller reactors offer better control over anaerobic digestion processes, particularly in terms of controlling critical parameters such as pH and temperature.
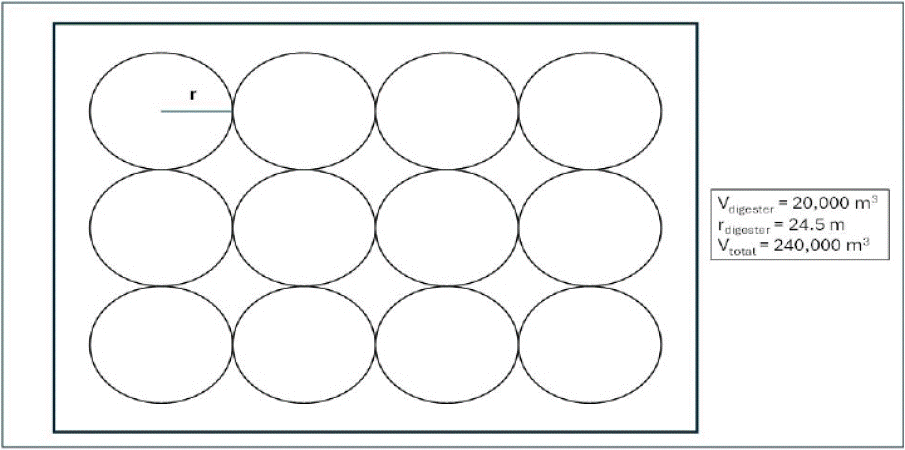
    Figure 5: To optimise the methane production for a surface such as a region or a country, our conclusions suggest that it is better to cover the surface with many
anaerobic digestors, all operating at their ideal energy efficiency, rather than big digesters with large harvest areas. In reality the harvest area is not just related
on the size of the area but on the type of terrain as well. A mountainous terrain will incur a bigger energy deepens for the harvest of the biomass. Conversely, if
the biomass has to be harvested for other reasons, such a animal feed, then then anaerobic digestors can be bigger.
Summary
Focusing on digester volumes between 10,000 and 20,000 m³ is key to enhancing energy efficiency in biogas production, as supported by both simulation and real-world data.
To improve efficiency, save space, and have a robust system that can function despite perturbations, it is preferable to have several digesters of 20,000 m³ each rather than a single digester of 240,000 m³.
Conclusions
This study evaluates the energetic viability of anaerobic digestion (AD) systems, focusing on a feedstock mixture of 60% sugarcane leaves and 40% cow dung. The sugarcane represents any energy crop. A series of simulations showed that AD can be energetically viable above a reactor capacity of 100 tons VS/year and particularly when reactor volumes are optimized between 10,000 and 20,000 m³, where energy recovery is maximized with a peak energy gain (ΔE) of 3.70 MWh/h. Smaller reactors, especially those below 5,000 m³, tend to be inefficient due to higher energy demands for heating and mixing.
In summary, the findings of this study provide important insights into the design and optimization of AD systems and how the size of anaerobic digesters could be optimized for maximum energy generation across the country. Scaling up digesters to volumes between 10,000 and 20,000 m³ can enhance energy efficiency, making AD a more sustainable and economically viable solution for biogas production. Future research should focus on operational parameters, feedstock composition, and system logistics (Feedstock collection and transportation, substrate handling and processing, heating, mixing, pumping and gas capture, post-digestion logistics) to further optimize energy recovery, particularly in large-scale systems.
Author Contributions
Arthur COLIN, Maël BOISSONNADE and Anastasia TEREKHOVA designed the model, searched for much of the information and made a first draft of the manuscript; Lila NAIT HMAD analysed the data and reworked the draft; Behnam TAIDI proposed the idea for the study and supervised the work as well as participated in the preparation of the manuscript, and supervised the creation of the model; Islam BOUSSAADA and Sette DIOP corrected and edited the manuscript.
Acknowledgement
We thank Marie Laurence GIORGI for the help she brought to this article by supervising model creation along with Behnam TAIDI. Thanks to Melissa Ann THOMAS for her valuable help in revising the manuscript. This work is carried out in the framework of the collaborative project MAC-BIORé (IPSA/Sup’Biotech/ CentraleSupelec) financially supported by IONIS Education Group. The LGPM is acknowledged for co-funding the project.
Declaration of Competing Interest
The authors declare that they have no known competing commercial interests or personal relationships that could have appeared to influence the work reported in this paper.
Funding
This research received funding from the Polytechnical Institute for Advanced Sciences (IPSA). To prepare this paper, information has been used from many diverse sources which have been cited in the appropriate sentence or paragraph. The list of citations is attached with this document as references.
References
- ADEME. “Les chiffres clés de la méthanisation.” ADEME Infos. Accessed September 21, 2023.
- Carte des unités de méthanisation en France. (n.d.). 2023.
- ADEME. “Transition 2050 agir pour le climat rapport de l’ADEME | viepublique. fr,” 2021.
- IEA. “Energy Statistics Data Browser – Data Tools.” IEA. Accessed September 21, 2023.
- IEA. “Net Zero by 2050 - A Roadmap for the Global Energy Sector,” 2021.
- IEA. “Outlook for Biogas and Biomethane. Prospects for Organic Growth. World Energy Outlook Special Report.,” 2020.
- B Niya; K Yaakoubi; SE Azaroual; FZ Beraich; M Arouch; I Meftah Kadmiri. Anaerobic Digestion of Agricultural Waste Using Microbial Inocula: Performance and Characterization of Bacterial Communities Using 16S rRNA Sequencing Approach. Energies. 2023; 16: 3300.
- Buswell A.M, & Mueller H.F. Mechanism of Methane Fermentation. Industrial & Engineering Chemistry. 1952; 44: 550–552.
- Uddin M.M & Wright M.M. Anaerobic digestion fundamentals, challenges, and technological advances. Physical Sciences Reviews. 2022.
- Shen J, Zhao C, Liu Y, Zhang R, Liu G & Chen C. Biogas production from anaerobic co-digestion of durian shell with chicken, dairy, and pig manures. Energy Conversion and Management. 2019; 198: 110535.
- Sinbuathong N, Sillapacharoenkul B, Palakas S, Kahraman U & Dincer I. Using sugarcane leaves and tops for exploiting higher methane yields: An assessment study. International Journal of Hydrogen Energy. 2022; 47: 32861–32875.
- Xu C, Wu B, Zhao P, Wang Y, Yang H, Mi Y, et al. Biological saccharification coupled with anaerobic digestion using corn straw for sustainable methane production. Bioresource Technology. 2023; 367: 128277.
- Amon T, Amon B, Kryvoruchko V, Machmüller A, Hopfner-Sixt K, Bodiroza V, et al. Methane production through anaerobic digestion of various energy crops grown in sustainable crop rotations. Bioresource Technology. 2007; 98: 3204–3212.
- Chowdhury TH. Technical-economical analysis of anaerobic digestion process to produce clean energy. Energy Reports. 2021; 7: 247–253.
- Arshad M, Ansari AR, Qadir R, Tahir MH, Nadeem A, Mehmood T, et al. Green electricity generation from biogas of cattle manure: An assessment of potential and feasibility in Pakistan. Frontiers in Energy Research. 2022: 10.
- Mazurkiewicz J. Energy and Economic Balance between Manure Stored and Used as a Substrate for Biogas Production. Energies. 2022; 15: 413.
- Carpentier J, Platteau W, Vanwalleghem J, Steenhoudt D & Verstraete W. Anaerobic digestion of solid slaughterhouse waste: Potential of renewable energy for Belgium. IWA International Symposium on Anaerobic Digestion of Solid Waste, 4th, Proceedings. 2005; 649–655.
- Kang J, Jeong C, Kim N, Kim M.I & Chang H. On-Site Removal of H2S from Biogas Produced by Food Waste Using an Aerobic Sludge Biofilter for Steam Reforming Processing. Biotechnology and Bioprocess Engineering. 2010; 15: 505–511.
- Elbeshbishy E, Nakhla G & Hafez H. Biochemical methane potential (BMP) of food waste and primary sludge: Influence of inoculum pre-incubation and inoculum source. Bioresource Technology. 2012; 110: 18–25.
- Demirel B & Scherer P. Production of methane from sugar beet silage without manure addition by a single-stage anaerobic digestion process. Biomass and Bioenergy. 2008; 32: 203–209.
- Ms D, Ma S-C, Aj C, Af S, Ma P, Rm Z, et al. Principles, Advances, and Perspectives of Anaerobic Digestion of Lipids. Environmental Science & Technology. 2022; 56: 4749-4775.
- Gerber M & Span R. An analysis of available mathematical models for anaerobic digestion of organic substances for production of biogas. Proceedings of the International Gas Union Research Conference. 2008; 2: 1–30.
- Jain S, Jain S, Wolf I.T, Lee J & Tong Y.W. A comprehensive review on operating parameters and different pretreatment methodologies for anaerobic digestion of municipal solid waste. Renewable and Sustainable Energy Reviews. 2015; 52: 142–154.
- O Levenspiel. Chemical Reaction Engineering (3rd Ed.), Wiley India Pvt. Limited. 2006.
- Suresh R and Vivekanandan S. Two Stage Anaerobic Digestion Over Single Stage on Biogas Yields from Edible and Non-Edible De-Oiled Cakes Under the Effect of Single and Co-Digestion System. International Journal of Civil Engineering and Technology. 2017; 8: 565–574.
- Massanet-Nicolau, Jaime, et al. “Utilising Biohydrogen to Increase Methane Production, Energy Yields and Process Efficiency via Two Stage Anaerobic Digestion of Grass.” Bioresource Technology. 2015; 189: 379–383.
- Zheng X & Li R. Critical Review on Two-Stage Anaerobic Digestion with H2 and CH4 Production from Various Wastes. Water. 2024 ; 16 : 1608.