
Research Article
Austin J Bus Adm Manage. 2017; 1(1): 1004.
The Comparison of Major Financial Issues Japan vs. the United States: 1986-2015
Murafuji I*
Department of Business and Technology Management, Kyushu University Business School, Japan
*Corresponding author: Murafuji Isao, The Department of Business and Technology Management, Graduate School of Economics, Kyushu University, 6-19- 1, Hakozaki Higashi-ku, Fukuoka 812-8581, Japan
Received: May 02, 2017; Accepted: May 18, 2017; Published: May 25, 2017
Abstract
The Common issue at the government of US and Japan is that the US Federal Government and Japanese Central government both have a huge amount of net debt as the result of continued issues of deficit government bonds. The diverged issues are the size of social welfare system, the size of financial return and the relative importance of equity and real estate market. Japan has a larger social welfare system, much smaller financial return and a larger real estate market than equity market compared with those in the US. These points largely influence the stocks and the flows of the households of the US and Japan.
Keywords: System of National Accounts (SNA); Net liabilities; Intergenerational unfairness; Aging population; Household balance sheet
Abbreviations
tn: trillion; bn: billion; B4: Before; FRB: Federal Reserve Board/ Federal Reserve Bank; BEA: Bureau of Economic Analysis
Introduction
I have been watching the SNA data [1], released by Japanese and the US governments for many years. I have just completed the analysis of 2015 data which updates my analysis of 1986-2014 data. By this paper, I would like to point out my summary conclusions on the comparison of major financial issues between Japan and the US.
Materials and Methods
The major data I used for the analysis are Japanese SNA data, the US SNA data and the Japanese consolidated central government balance sheet data from the Ministry of Finance homepage [2]. If you are interested, please look at the raw data from the homepages I noted in the reference section.
Starting from the SNA data, I produced the financial statements by sectors for corporate sector, financial institution sector, general government sector and household sectors. The financial statements I produce include balance sheet, Income statement and cash flows for each sector. I have been making the financial statements for Japan and the US for each sector yearly when new yearly data are released. I also make combined financial statements for total Japan and the US, by adding sector financial statements. Here, internal elimination is not possible so it is not consolidated statements but the adding-up of sector numbers in Japan and the US.
By analyzing the financial statements for sector and the total, I have been trying to identify the most important financial issues for each sector and the country. After identifying the most important issues, I have been trying to evaluate the strategic alternatives to solve the issues. I have published two books on this theme which I showed in the reference section.
This paper compares the financial statements of Japan against those of the US and tried to describe the most important common issues and diverged issues.
Results and Discussion
The common issue
The consolidated balance sheet of Japanese central government: At the end of March 2016, the total consolidated asset of Japanese central government was Y959tn and the total consolidated liabilities were Y1424tn (Figure 1a) [1]. The consolidated balance sheet consolidates general account, special accounts and public entities of the central government and does not include any balance sheets of the local government and the public entities under the local governments. Therefore, the net liabilities were Y465tn for the consolidated central government. By the way, the net liability of the consolidated Japanese central government used to be Y441tn at the end of March 2012 [3]. The net liabilities came neither from the special accounts nor outside legal entities but the general accounts. At the general accounts, the net liabilities were Y553tn at the end of March 2016, as the result of Y292tn asset and Y845tn liabilities including Y807tn government bonds. In recent years, Japanese government has been financing the necessary fund for social welfare thorough issuing a large amount of deficit government bond. The net liabilities have to be repaid by the future younger generations, which did not receive the government service from proceed of the government bonds, causing a vast intergenerational unfairness.
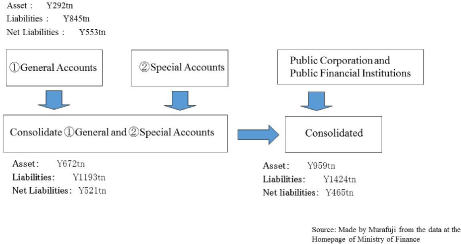
Figure 1a: The Net Liabilities of the Central Government of Japan.
The central government will not face liquidity crisis as far as The Bank of Japan could purchase the government bonds by issuing Japanese currencies or pay the consideration into BOJ’s current account. However, it is possible the country will face hyper-inflation or currency crisis in the future, unless Japan will hurry up with the reduction of the government securities.
The financial crisis of the USA: The value of the US federal government increased slowly from US$700 billion in 1986 to $1.4 trillion in 2007. The government value is defined as the net administrative value plus the total financial asset of the US federal government. As the result of Lehman shock in 2008, the financial asset jumped almost 80% from US$360bn in 2007 to $644bn in 2008. The financial asset of the federal government at the end of 2015 was US$1.3tn so that, together with $1.2tn net administrative value, the federal government value became $2.5tn at the end of 2015.
On the other hand, government debt increased 7.5 times from $2tn in 1986 to $14.5tn in 2015. Most of the increase in government debt during this period was caused by the increase of deficit treasury securities which financed federal government’s yearly deficit. As the result of this debt increase, the net liability of federal government increased from $1.3tn in 1986 to $12.2tn in 2015 (Figure 1b) [3,4].
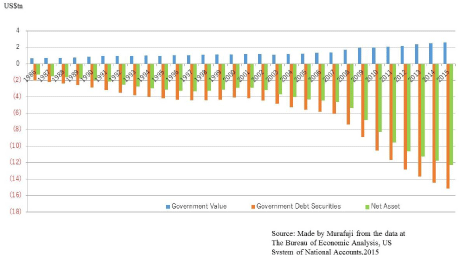
Figure 1b: The Net Liabilities of the Federal Government of the U.S.
This net liability issue is a big burden for future generations who did not receive public service but have to repay the debt. This is same problem as that of Japanese central government. However, US treasury securities are almost 30% owned by foreign investors based on the No1 political power backed by the military power as well as the credibility of US$ currency. This makes the US government possible to share its own problem with other countries of the world. Japan has to sell most of the government securities domestically.
If you look at the balance sheet of the state & local governments of the US, the state & local governments together have $7.5tn net asset. But this does not mean the state & local government of the US can offer support to the federal government, because the savings, the final bottom line of the state & local government in 2008-2016 were all about minus $200bn. When the bottom line flow is minus, we have to say the market value of the stock which produces the minus flow has to be minus. Although the statistical net asset value was $7.5tn, the market value of the net asset guessed by the flows looks to be minus. Therefore, too much support from the state & local government to the federal government cannot be expected in the US.
Diverged issues: Japan vs. the U.S.
Social welfare system comparison: The burdens of household to pay tax and social welfare payments from the compensations are almost equal at about 60% in the US and Japan. However, the social welfare receipt is more than 60% of compensation in Japan whereas it is only about 30%+ in the US (Figure 2a) [3]. This sounds good for Japanese household but actually is not necessarily good. The Government in any country has to pay for its employees, public infrastructure and other public expenditures. Japan is paying all the income as the social welfare payments to the household sector. Since Japanese governments also have to pay for its employees and other public expenditures, it is issuing deficit government bond. I have to say this is very unhealthy practice. Japan has government operated pension and health insurance schemes for all the people in Japan. The US has pension and health insurance schemes only for the poor, elderly and retired public servants including military people. As the result of social welfare system for all the people, Japan is paying too much for social welfare system and this is not sustainable any more as the result of the aging population. The deficit government bond to sustain the current social welfare system amounted to unsustainable level. I think Japan has to deregulate social welfare system and let private insurance companies enter into pension and health insurance businesses for rich and normal people. This means the liquidation of the current social welfare system for all the people. If this restructuring happens, the social welfare payment will become 30-40% of the compensations, which makes the issue of Y20-40tn deficit government bond per year unnecessary, eliminating the largest financial issue of the Japanese government.
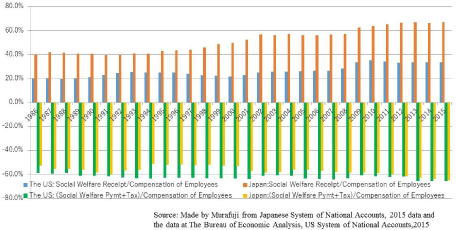
Figure 2a: Social Welfare System Comparison.
Household sector’s principal occupation and financial income: If you look at the financial asset returns of the US and Japan, the US financial asset returns always have been much higher than those of Japan. In the US, the 12% return in 1986 became lower to 8% in 2015. However, it is still 8% in 2015. In Japan, the highest return point was 5% in 1991 and it declined to 1% in 2003, staying still at 1% in 2015 (Figure 2b) [3].
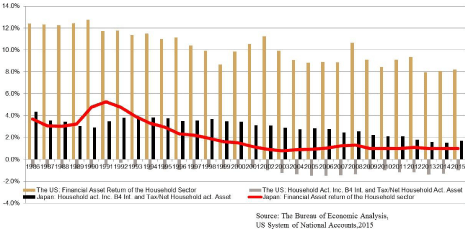
Figure 2b: Household sector’s principal occupation and financial income.
If you look at Household activity income B4 interest expense and personal Tax/Net household asset for the US and Japan, the returns in Japan have been always plus from 1986 to 2015 but they have always been in minus in the US. This is because the US household can consume not only household income but also financial income, expecting 8-12% return on the financial asset. Japanese household cannot count on high financial return so that Japanese household can expect consuming only the income from household activities. Japanese government has to increase the international competitiveness of Japanese multinational corporations and financial institutions so that household can enjoy much higher financial returns from their fixed income and equity securities.
The market prices of real estate and stock: Lehman shock was largely the result of the collapse of the US real estate bubbles (Figure 2c) [4]. Because of the emergence and the collapse of real estate bubbles in the US, accelerated by the mortgage securities and credit derivatives, there was a financial crisis from the end of 2008 to 2009. The US Government injected huge amount of US$ in the world to recover from the financial crisis. The loan and investment of the US Federal government jumped from US$400bn in 2007 to US$1tn in 2008 and has been kept at very high level.
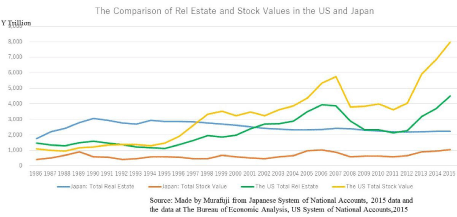
Figure 2c: The Market Prices of Real Estate and Stock.
The largest liabilities of FRB, the central bank of the US, are the US$ currency and the current accounts at FRB by private banks. The balance sheet size of FRB jumped from less than US$1tn before Lehman shock to more than US$4tn by Oct. 2014 as the result of the purchases of government and mortgage securities. From Oct. 2014, FRB stopped buying the government bonds and mortgage securities. However, it is only recently that the FRB started to consider the shrinking the size of FRB balance sheet. Since FRB has to keep the US and global economy healthy, it is expected that FRB will not sell the securities but shrink the reinvestment when maturities of the securities come. We believe it will take many years for FRB to come back to the original size.
Figure 2c compares the real estate and stock values in the US and Japan. Japanese real estate value includes not only land but also houses, buildings and factories. In the US, the land price and house/ building price are not necessarily separated whereas in Japan, the land price and house/building price are always separately set. In the US, real estate data are shown only in the corporate and household sector and not in the government and financial institution sector in SNA statistics.
Since the US data are shown in the US$, the year-end exchange rates are used to convert the US$ numbers to Japanese trillion yen. Japanese real estate value increase from Y1769tn in 1986 to Y3070tn in 1990 but declined to Y2138tn in 2015. The total land price in Japan jumped from Y1200tn in 1986 to Y2400tn in 1990 and gradually declined to Y1091tn in 2015. This was the land bubble in Japan which caused more than 20 years of economic depression in Japan. On the other hand, fixed asset in both corporate and household sectors more than doubled from Y304tn and Y168tn in 1986 to 783tn and Y355tn in 2015. This fixed asset definition excludes land but include house, buildings and factories. Due to the increase of fixed assed, the decline of real estate value in Japan has much more gentle slope compared with the declining slope of Japanese land.
The total US real estate values increased from Y1,475tn in 1986 to Y3,944tn in 2006 and then dropped to Y2,131tn in 2011 as the result of Lehman shock. However, the size of the US land is 25 times that of Japan. The value of real estate in the US started to recover in 2013 and reached Y4517tn in 2015 which was larger than the before Lehman shock value.
The total stock value of Japan increased from Y300tn in 1986 to Y900tn in 1989 but dropped and fluctuated together with economic situations. Although the Nikkei Index never recovered Y40,000, the total stock price reached Y1000tn, which was larger than the 1989 peak value, thanks to a lot of new entrants to the stock markets. The US stock market increased from Y1000tn in 1986 to Y5763tn in 2007 but lost a lot of value due to the Lehman shock. According to the SNA statistics, the US stock value increased to Y5935tn in 2013 and Y7978tn in 2015. Of note is that in the US, the stock value is 1.8 times of real estate value whereas in Japan, the total real estate value is 2.1 times of the total stock value. In the US, the equity market is much larger than real estate market but in Japan, the real estate markets are much larger than the equity market.
The relationship between stocks and flows at the household Sectors
The relationship between stocks and flows in Japan: It is rare to see the stock figures of the household sector. However, it is important to see the stock figures and understand the relationship between the stocks and the flows of the household sector in order to understand the activities and the financial results of the household sector (Figure 3a) [4]. The household sector normally is the largest sector of each country, providing corporate and financial activities and supporting their own government.
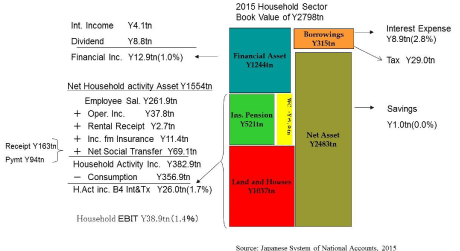
Figure 3a: The Relationship of the Stocks and Flows at the Household Sectors of Japan.
The value of the household sector can be divided into financial asset and net home activity asset. In case of 2015, the financial asset of the household sector had Y1, 244tn which produced Y12.9tn financial income. This financial income includes only current income such as interest income and dividend income and does not include capital gains/losses. Although insurance and pension asset could be included in financial asset in different definition, I categorized net household activity and financial activity separately so that insurance and pension asset are included not in financial asset but in net household asset. This is because insurance is for the risk of life and pension is for the retired life and both do not produce financial yearly current income.
Net household activity asset (Y1554tn) consists of the land and houses (Y1037tn), insurance and pensions (Y521tn) and the working capital (-Y3.9tn) of the household sector. As I explained above, please note that I have separated the insurance and pensions from the financial asset and put them into the net household activity asset, since they do not necessarily produce yearly income and they are owned by the household sector for risk events and for retirement life which are the parts of the core household activities. This net household activity asset produced household activity income of Y383tn after including the net transfer from the governments. If you subtract the household consumption of Y357tn from the Y383tn household activity income, you will reach the household activity income before interest expense and tax of Y26tn in 2015.
Assuming the consumption tax is Y2.5tn per %, the raise of consumption tax from 5% to 8% in April 2014 increased the consumption tax by Y7.5tn in 2015.
Since Y1224tn financial asset produced Y12.9tn financial income and Y1554 net household activity asset produced Y26.0tn household activity income before interest and personal tax, the EBIT for the household sector was Y38.9tn in 2015 produced by Y2798tn household sector value. If you deduct Y8.9tn interest expense for the borrowing and Y29tn tax for the government, the household sector savings was Y1.0tn in 2015. This Y1.0tn was the product of Y2, 483tn net asset. It seems the Y1.0tn is too small as the figure from the Y2483tn since Y1.0tn is only 0.04% of Y2, 483tn. This means that Y2483tn is only the book value on SNA and the actual market value of net asset of the Japanese household sector is much smaller than the book value. If you assume the real market value of the net asset of the household sector is, say 20-30 times of savings, it is in the magnitude of Y20-30tn. This means the household sector has unrealized loss of about Y2450-60tn in the net asset. The implication of this discovery is that the government has to be careful to increase tax for household sector such as consumption tax further since Japanese household sector is not as rich as they look statistically in SNA.
The Relationship between Stocks and flows in the US: Let us look at the balance sheet of household sector in the US in order to identify the difference between the household sectors of Japan and the US.
Basically, I am applying the same analyzing methodology as Japan to the household sector balance sheet of the US. The Household sector value is classified into financial asset and household activity asset. According to the SNA statistics by the BEA for 2015, US$46.6tn financial asset produced US$3.8tn financial income which was 8.2% return on the financial asset. This 8.2% financial return is more than 8 times of 1.0% financial return in Japan. You can see that in the United States, the household sector is earning a lot on their financial investments, compared with Japan. No wonder Japanese household put their money not on fixed income and equity security investments but on bank deposit. This is same historically (Figure 3b) [4]. Japanese household has no expectation to earn much on financial investments, learning from the past experiences.
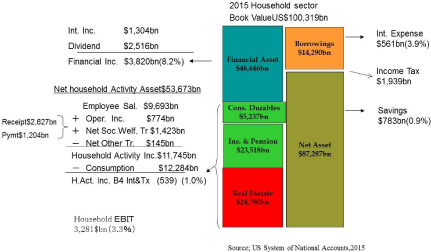
Figure 3b: The Relationship of the Stocks and Flows at the Household Sectors of U.S.
On the other hand, in the US in 2015, net household activity asset was US$54tn which included US$25tn real estate, US$24tn insurance & pensions and US$5tn consumer durables. Although the size of the land in the US is 25 times that of Japan, the real estate value is only 2.5 times that of Japan in 2015. Insurance & pensions value in the US is about 5 times that of Japan. Of note is that in Japan, the government operated pension and health insurance schemes are for all the people, whereas in the US, the government pension and health insurance are for only a selected part of people. The rich and many normal people have private pension and health insurance schemes in the US. Japanese government recognize pension asset but does not recognize pension liability in SNA statistics, saying that it is not legal obligation. This is making the pension and insurance asset smaller in Japan than real picture [5].
From US$54tn household activity asset, US$11.7tn household activity income was produced in 2015 in the US. The household consumption in the US in 2015 was $12.3tn which was larger than the $11.7tn household activity income, since US household can always count on a large financial income. In case of 2015, financial income was US$3.8tn. As the total of financial income and household activity income was larger than the household consumption of $12.3tn, total Household EBIT was US$3.3tn. From US$3.3tn household activity EBIT, $561bn interest expense and US$1,939bn income tax were paid. The remaining bottom-line household savings was $783bn. Since this was only 0.9% of US$87tn net asset in book value, you can also say that the market value of household sector net asset in the US is also much lower than the book value net asset.
This comparison is showing the global strategy of the US which is making the competitiveness of their private sector higher so that the household sector can enjoy the higher return on the fixed income and equity investments. When we say in Japan we have to transfer the financial asset from deposit to fixed income and equity investments, we have to reconsider how the Japanese government can assist the global competitiveness of Japanese private sector companies.
Conclusion
Both Japanese central government and the US federal government have net liabilities as the result of the continued issues of deficit government securities. Japan has social welfare system for all the people which are getting to be too much. I think deregulation and privatization of the social welfare system is necessary in Japan. Japanese household sector’s financial return is too small compared with that of the US and I think the increase of global competitiveness of Japanese companies are necessary for the household to have a higher financial return.
References
- Cabinet Office in Japan, Economic and Social Research Institute (ESRI), System of National Accounts (SNA). 1986-2015.
- The home page of Ministry of Finance, Japan, Consolidated Financial Statements of Central Government, Fiscal. 2015.
- Murafuji I. “The Net Government”. Dobunkan-Shuppan, 2015. 1986-2012 SNA data.
- Bureau of Economic Analysis, the US Department of Commerce, System of National Accounts (SNA), 1986-2015.
- Murafuji I. “The Financial Restructuring of Japan”. Toyokeizai-Shinpo, 2004. 1986-2000 SNA data.