Review Article
Austin J Bus Adm Manage. 2018; 2(2): 1026.
To What Extent Changing Tax Policy and External Financing Influence the Risk Level of Viet Nam Insurance Industry During and After the Global Crisis
Huy DTN*
Chung Yuan Christian University for Class Lectures, Japan
*Corresponding author: Dinh Tran Ngoc Huy, Chung Yuan Christian University for Class Lectures, Japan
Received: March 29, 2018; Accepted: May 09, 2018; Published: May 16, 2018
Abstract
Over past few years, the global financial crisis shows certain influence on emerging financial markets including Viet Nam. Therefore, this study chooses an analytical approach to give some systematic opinions on how many some certain determinants such as income tax and leverage, affect the level of market risk in listed insurance organizations.
First, it calculates equity and asset beta values in three (3) different scenarios of changing tax rates and changing the level of financial leverage.
Second, under 3 different scenarios of changing tax rates (20%, 25% and 28%), we recognized that there is not large disperse in equity beta values, estimated at 0,118 for current leverage situation.
Third, by changing tax rates in 3 scenarios (25%, 20% and 28%), we recognized both equity and asset beta mean values have positive relationship with the increasing level of tax rate.
Last but not least, this paper covers some ideas and policy suggestions.
JEL classification numbers: G00, G3, G30
Keywords: Risk management; Asset beta; Financial crisis; Corporate tax; Leverage
Introduction
After financial crisis and reactions in financial industry taking place recently, we find out that there are signals of impacts of tax rates and the level of financial leverage on the fluctuations of market risk, measured by both equity and asset beta values. This leads to a question on using external debt of management team in a hope that the business market value can be recovered. Despite of trying to select an easy-reading writing style, there is still some academic words need to be explained in further.
The organization of paper contents is as following. As our previous series of paper, Research literature, issues, methodology and theories are covered in the first two sessions. Next, it followed by introduction of our empirical findings in session 3 (3rd). Continuously, session four (4) covers conclusion and policy suggestion. Before last, there are exhibit session which covers some calculated results of this paper’s analysis and comparison.
Preliminary Notes
Research issues
This research aims to figure out two (2) issues:
Issue 1: What happen to asset beta if both FL and tax rate change in 3 scenarios
Issue 2: What happen to equity beta if both FL and tax rate change in 3 scenarios
Literature review
John (1999) mentions a two-rate tax system where land is taxed at a higher rate than structures in his research on two-rate property tax effects on land development [1].
Smith (2004) mentions in Chicago, properties located in a designated TIF (Tax Increment Financing) district will exhibit higher rates of appreciation after the area is designated a qualifying TIF district when compared to those properties selling outside TIF districts, and when compared to properties that sell within TIF district boundaries prior to designation [2].
Anderson (2009) recognized that the user cost tax elasticities are relatively small while the expected house price inflation elasticity is substantially larger and therefore plays a greater role in affecting housing market demand.
McCarty (2012) stated there is evidence which suggests that for the most tax risky firms investors also apply a higher discount rate to estimations of future cash flows. Then, Vello and Martinez (2012) indicated there is a negative and significant relation between the market risk and the tax planning efficiency index of firms that have good governance practices [3-5].
Next, Madhou (2012) found out, for Australia firms over the period 2003-2008, those with low leverage appear to hold higher cash holdings than high leverage ones. Then, McCauley (2013) pointed that during calm periods, portfolio investment by real money and leveraged investors in advanced countries flow into emerging markets, leading to an asymmetric asset swap (risky emerging market assets against safe reserve currency assets) and leveraging up by emerging market central banks. Last but not least, Gunarathna (2013) found out in different industries in Sri Lanka, firm size does not significantly affect the financial risk, but the degree of financial leverage has a significant positive correlation with financial risk [6-10].
Conceptual theories
The tax system not only responds to the globalization but also affects national income, investment levels and risks of doing business. Furthermore, tax system can affect the investment return and the ratio of re-investment and business growth.
The using of leverage also could create both negative and positive effects on business operational results. A firm will make decision on significant amount of debt when it hopes ROA will be higher than the lending interest. Although Fl might increase or decrease ROE in different situations, at an ideal level of leverage, the firm will receive positive impact from FL on its ROE.
Methodology
In this research, analytical research method is used, philosophical method is used and specially, scenario analysis method is used. Analytical data is from the situation of listed banking industry firms in VN stock exchange and applied current tax rate is 25%.
Main Results
Empirical research findings and discussion
Data used are from total 7 listed insurance industry companies on VN stock exchange (HOSE and HNX mainly). In the scenario 1, current tax rate is kept as 25% as in the 2011 financial statements which is used to calculate market risk (beta) while leverage degree is kept as current, then changed from 30% up to 20% down. Then, two (2) FL scenarios are changed up when tax rate is up to 30% and down to 20%. In summary, the below Tables 1-7 shows three (3) scenarios used for analyzing the risk level of these listed firms.
    Tax rate as current (25%)
    Tax rate up to 30%
    Tax rate down to 20%


    Leverage as current
    Scenario 1
    Scenario 2
    Scenario 3


    Leverage up 30%


    Leverage down 20%
Table 1: Analyzing market risks under three (3) scenarios (Made by Author).
    Order No.
    Company stock code
    Leverage as current
    Leverage down 20%
    Leverage up 30%


    Equity beta
    Asset beta (assume debt beta = 0)
    Equity beta
    Asset beta (assume debt beta = 0)
    Equity beta
    Asset beta (assume debt beta = 0)


    1
    BVH
    0,966
    0,252
    0,966
    0,395
    0,966
    0,038


    2
    PVI
    0,937
    0,580
    0,937
    0,652
    0,937
    0,473


    3
    ABI
    0,288
    0,104
    0,288
    0,141
    0,288
    0,049


    4
    BIC
    0,114
    0,037
    0,154
    0,071
    0,046
    0,006


    5
    BMI
    1,261
    0,744
    1,261
    0,848
    1,261
    0,589


    6
    PGI
    0,150
    0,067
    0,181
    0,101
    0,099
    0,028


    7
    PTI
    0,145
    0,063
    0,178
    0,097
    0,093
    0,024
Table 2: Market risk of listed companies on VN insurance industry market under
a two factors model (case 1) (source: VN stock exchange 2012).
    Order No.
    Company stock code
    Leverage as current
    Leverage down 20%
    Leverage up 30%


    Equity beta
    Asset beta (assume debt beta = 0)
    Equity beta
    Asset beta (assume debt beta = 0)
    Equity beta
    Asset beta (assume debt beta = 0)


    1
    BVH
    0,966
    0,252
    0,966
    0,395
    0,966
    0,038


    2
    PVI
    0,937
    0,580
    0,937
    0,652
    0,937
    0,473


    3
    ABI
    0,288
    0,104
    0,288
    0,141
    0,288
    0,049


    4
    BIC
    0,116
    0,038
    0,157
    0,072
    0,048
    0,006


    5
    BMI
    1,261
    0,744
    1,261
    0,848
    1,261
    0,589


    6
    PGI
    0,153
    0,069
    0,184
    0,103
    0,102
    0,029


    7
    PTI
    0,148
    0,064
    0,180
    0,099
    0,095
    0,025
Table 3: Market risks of listed insurance industry firms under a two factors model
(case 2) (source: VN stock exchange 2012).
    Order No.
    Company stock code
    Leverage as current
    Leverage down 20%
    Leverage up 30%


    Equity beta
    Asset beta (assume debt beta = 0)
    Equity beta
    Asset beta (assume debt beta = 0)
    Equity beta
    Asset beta (assume debt beta = 0)


    1
    BVH
    0,966
    0,252
    0,966
    0,395
    0,966
    0,038


    2
    PVI
    0,937
    0,580
    0,937
    0,652
    0,937
    0,473


    3
    ABI
    0,288
    0,104
    0,288
    0,141
    0,288
    0,049


    4
    BIC
    0,109
    0,036
    0,149
    0,069
    0,044
    0,006


    5
    BMI
    1,261
    0,744
    1,261
    0,848
    1,261
    0,589


    6
    PGI
    0,145
    0,065
    0,177
    0,099
    0,095
    0,027


    7
    PTI
    0,141
    0,061
    0,173
    0,095
    0,089
    0,023
Table 4: Market risks of listed insurance industry firms under a two factors model
(case 3) (source: VN stock exchange 2012).
    Leverage as current

    Leverage down 20%

    Leverage up 30%


    Statistic results
    Equity beta
    Asset beta (assume debt beta = 0)
    Difference
    Equity beta
    Asset beta (assume debt beta = 0)
    Difference
    Equity beta
    Asset beta (assume debt beta = 0)
    Difference


    MAX
    1,261
    0,744
    0,517
    1,261
    0,848
    0,413
    1,261
    0,589
    0,672


    MIN
    0,114
    0,037
    0,076
    0,154
    0,071
    0,083
    0,046
    0,006
    0,041


    MEAN
    0,552
    0,264
    0,288
    0,567
    0,329
    0,237
    0,527
    0,329
    0,198


    VAR
    0,2353
    0,0812
    0,154
    0,2212
    0,0975
    0,124
    0,2600
    0,0614
    0,199


    Note: Sample size : 7 firms
Table 5: Statistical results (FL in case 1) (source: VN stock exchange 2012).
    Leverage as current

    Leverage down 20%

    Leverage up 30%


    Statistic results
    Equity beta
    Asset beta (assume debt beta = 0)
    Difference
    Equity beta
    Asset beta (assume debt beta = 0)
    Difference
    Equity beta
    Asset beta (assume debt beta = 0)
    Difference


    MAX
    1,261
    0,744
    0,517
    1,261
    0,848
    0,413
    1,261
    0,589
    0,672


    MIN
    0,116
    0,038
    0,078
    0,157
    0,072
    0,084
    0,048
    0,006
    0,042


    MEAN
    0,553
    0,265
    0,288
    0,568
    0,330
    0,238
    0,528
    0,330
    0,199


    VAR
    0,2341
    0,0809
    0,153
    0,2201
    0,0972
    0,123
    0,2590
    0,0613
    0,198


    Note: Sample size : 7 firms
Table 6: Statistical results (FL in case 2) (source: VN stock exchange 2012).
    Leverage as current

    Leverage down 20%

    Leverage up 30%


    Statistic results
    Equity beta
    Asset beta (assume debt beta = 0)
    Difference
    Equity beta
    Asset beta (assume debt beta = 0)
    Difference
    Equity beta
    Asset beta (assume debt beta = 0)
    Difference


    MAX
    1,261
    0,744
    0,517
    1,261
    0,848
    0,413
    1,261
    0,589
    0,672


    MIN
    0,109
    0,036
    0,073
    0,149
    0,069
    0,080
    0,044
    0,006
    0,038


    MEAN
    0,550
    0,263
    0,287
    0,565
    0,328
    0,236
    0,526
    0,328
    0,198


    VAR
    0,2372
    0,0816
    0,156
    0,2230
    0,0981
    0,125
    0,2615
    0,0615
    0,200


    Note: Sample size : 7 firms
Table 7: Statistical results (FL in case 3) (source: VN stock exchange 2012).
Market risk (beta) under the impact of tax rate, includes: 1) equity beta; and 2) asset beta.
The calculated figures generate some following results:
First of all, Equity beta mean values in all 3 scenarios are acceptable (< 0,6) and asset beta mean values are also small (< 0,2). If leverage increases to 30%, asset beta max maintains the same value of 0,589 when tax rate is up to 28% or down to 20%. Finally, when leverage is kept as current, asset beta max values increase slightly to 0,038 in the case of current tax rate.
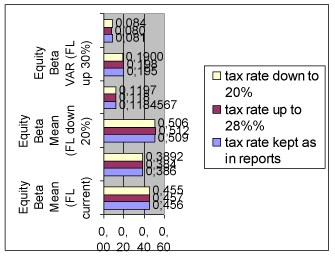
The below chart 1 shows us: when leverage degree decreases down to 20%, if tax rate is up to 28%, average equity beta value decreases slightly (0,512) compared to that at the decrease of tax rate of 20% (0,506). However, equity beta var is 0,08 (tax rate up), almost the same as that in case tax rate down. Then, when leverage degree increases up to 30%, if tax rate is up to 28%, average equity beta decreases little (to 0,384) compared to that at the decrease of tax rate of 20% (0,389). However, in case the tax rate up, the equity beta var is 0, 198, higher than 0,190 (tax rate down).

    Chart 1:  Comparing statistical results of equity beta var and mean in three
(3) scenarios of changing FL and tax rate (source: VN stock exchange 2012).

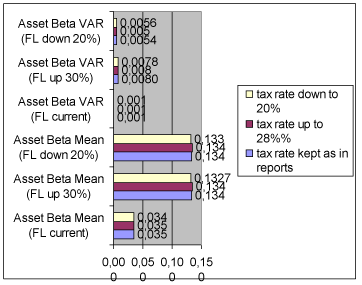
    Chart 2:  Comparing statistical results of asset beta var and mean in three (3)
scenarios of changing FL and tax rate (source: VN stock exchange 2012).
The below chart 2 shows us: when leverage degree decreases down to 20%, if tax rate is up to 28%, average asset beta value increases slightly (0,134) compared to that at the decrease of tax rate of 20% (0,133). However, asset beta var is 0,005 (tax rate up), little smaller than 0,006 (tax rate down). Then, when leverage degree increases up to 30%, if tax rate is up to 28%, average asset beta also increases little more (to 0,134) compared to that at the decrease of tax rate of 20% (0,133). However, in case the tax rate up, the asset beta var is 0,008, almost the same as that in case tax rate down.

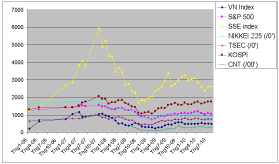
    Exhibit 1:  VNI Index and other stock market index during crisis 2006-2010
(source: global stock exchange 2012).

    Exhibit 2:  VNI Index and other stock market index during crisis 2006-2010
(source: global stock exchange 2012).
Conclusion and Policy Suggestion
In summary, the government has to consider the impacts on the movement of market risk in the markets when it changes the macro policies and the legal system and regulation for developing the insurance market. The Ministry of Finance continues to increase the effectiveness of fiscal policies and tax policies which are needed to combine with other macro policies at the same time. The State Bank of Viet Nam continues to increase the effectiveness of capital providing channels for insurance organizations as we might note that in this study when leverage is going to increase up to 30%, the risk level decreases (asset beta mean decreases to 0,133 if tax rate moves down to 20%).
Furthermore, the entire efforts among many different government bodies need to be coordinated.
Finally, this paper suggests implications for further research and policy suggestion for the Viet Nam government and relevant organizations, economists and investors from current market conditions.
Acknowledgement
I would like to take this opportunity to express my warm thanks to Board of Editors and Colleagues at Citibank –HCMC, SCB and BIDVHCMC, Dr. Chen and Dr. Yu Hai-Chin at Chung Yuan Christian University for class lectures, also Dr Chet Borucki, Dr Jay and my ex- Corporate Governance sensei, Dr. Shingo Takahashi at International University of Japan. My sincere thanks are for the editorial office, for their work during my research. Also, my warm thanks are for Dr. Ngo Huong, Dr. Ho Dieu, Dr. Ly H. Anh, Dr Nguyen V. Phuc and my lecturers at Banking University – HCMC, Viet Nam for their help. Lastly, thank you very much for my family, colleagues, and brother in assisting convenient conditions for my research paper.
References
- Allen F, Gale D. Stock Price Manipulation. Review of Financial Studies. 1992.
- Basu, Devraj , Streme, Alexander. CAPM and Time-Varying Beta: The Cross-Section of Expected Returns, SSRN Working paper series. 2007.
- Arkadev Chatterjea, Joseph A. Cherian, Robert A. Jarrow. Market Manipulation and Corporate Finance: A new Perspectives. 1994 Annual Meeting Review, SouthWestern Finance Association, Texas, USA. 2001.
- DeGennaro, Ramon P, Kim, Sangphill. The CAPM and Beta in an Imperfect Market, SSRN Working paper series. 2003.
- Galagedera DUA. An alternative perspective on the relationship between downside beta and CAPM beta. Emerging Markets Review. 2007; 8: 4-19.
- Huy Dinh TN. Whether The Risk Level of Viet Nam Real Estate Firms under the different changing tax rates increase or decrease so much?. International Journal of Research in Business and Technology. 2013.
- Asim Ijaz Khwaja, Mian Atif. Unchecked intermediaries:Price manipulation in an emerging stock market. Journal of Financial Economics. 2005; 78: 203-241.
- Marchesi, Michael Favere. The Impact of Tax Services on Auditors’ Fraud Risk Assessments Advances in Accounting.
- Ang A, Chen J. CAPM Over the Long Run: 1926-2001. Journal of Empirical Finance. 2007.
- ADB and Viet Nam Fact Sheet. 2010.