Research Article
Austin J Bus Adm Manage. 2019; 3(1): 1037.
Evaluating the Volatility of Market Risk of Viet Nam Construction Industry after the Low Inflation Period 2015-2017
Ngoc Huy DT*
Banking University, International University of Japan, Japan
*Corresponding author: Dinh Tran Ngoc Huy, Graduate School of International Management, International University of Japan, Niigata, Japan
Received: November 06, 2019; Accepted: December 06, 2019; Published: December 13, 2019
Abstract
The Vietnam economy has gained lots of achievements after the financial crisis 2007-2011, until it reached a low inflation rate of 0.6% in 2015. This paper measures the volatility of market risk in Viet Nam construction industry after this period (2015-2017). The main reason is the vital role of the construction company group in Vietnam in the economic development and growth in recent years always go with risk potential and risk control policies.
This research paper aims to figure out how much increase or decrease in the market risk of Vietnam construction firms during the post-low inflation period 2015-2017.
First, by using quantitative combined with comparative data analysis method, we find out the risk level measured by equity beta mean in the construction industry is acceptable, i.e. it is little lower than (‹) 1.
Then, one of its major findings is the comparison between risk levels of construction industry during the financial crisis 2007-2009 compared to those in the post-low inflation time 2015-2017. In fact, the research findings show us market risk fluctuation, measured by equity beta var, during the post-low inflation time has increased moderately.
Finally, this paper provides some ideas that could provide companies and government more evidence in establishing their policies in governance. This is the complex task but the research results shows us warning that the market risk volatility might be higher during the post-low inflation period 2015-2017. And our conclusion part will recommend some policies and plans to deal with it.
JEL classification numbers: G00; G390; C83
Keywords: Risk management; Asset beta; Financial crisis; Construction industry; Policy
Introduction
Throughout many recent years, Viet Nam construction market is evaluated as one of active markets, which has certain positive effect for the economy. The development of construction industry goes parallel with real estate and construction material markets. And Vietnam construction firms take advantages of providing real estate assets with high quality but low cost.
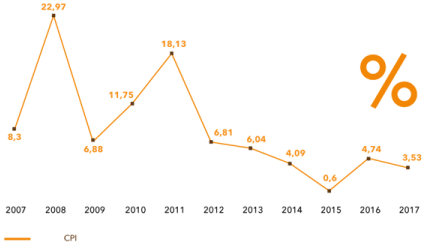
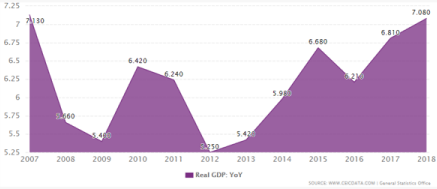
Generally speaking, central banks aim to maintain inflation around 2% to 3%. Increases in inflation significantly beyond this range can lead to possible hyperinflation, a devastating scenario in which inflation rises rapidly out of control. Looking at (Figures 1,2), we can see the Vietnam economy has controlled inflation well. High inflation might lead to higher lending rate and harm the construction industry because of rising construction material price.

Figure 1: Inflation, CPI over past 10 years (2007-2017) in Vietnam.

Figure 2: GDP growth rate past 10 years (2007-2018) in Vietnam.
This study will calculate and figure out whether the market risk level during the post-low inflation time (2015-2017) has increased or decreased, compared to those statistics in the financial crisis time (2007-2009).
The paper is organized as follows: after the introduction it is the research issues, literature review, conceptual theories and methodology. Next, section 3 will cover main research findings/ results. Section 4 gives us some discussion and conclusion and policy suggestion will be in the section 5.
Theory
Research issues
The scope of this study are:
Issue 1: Whether the risk level of construction firms under the different changing scenarios in post-low inflation period 2015-2017 increase or decrease so much, compared to in financial crisis 2007- 2009 and?
Issue 2: Because Viet Nam is an emerging and immature financial market and the stock market still in the starting stage, whether the dispersed distribution of beta values become large in the different changing periods in the construction industry.
This paper also tests three (3) below hypotheses:
Hypothesis 1: Comparing two (2) periods, during the financial crisis impact, the beta or risk level of listed companies in construction industry will relatively higher than those in the post-low inflation environment.
Hypothesis 2: Because Viet Nam is an emerging and immature financial market and the stock market still in the recovering stage, there will be a large disperse distribution in beta values estimated in the construction industry.
Hypothesis 3: With the above reasons, the mean of equity and asset beta values of these listed construction firms tend to impose a high risk level, i.e., beta should higher than (›) 1. This hypothesis is based on the context of emerging markets including Viet Nam where there lacks of sufficient information and data disclosure although it might have high growth rate.
Literature review
Fama, Eugene F., and French, Kenneth R., [1]. also indicated in the three factor model that “value” and “size” are significant components which can affect stock returns. They also mentioned that a stock’s return not only depends on a market beta, but also on market capitalization beta. The market beta is used in the three factor model, developed by Fama and French, which is the successor to the CAPM model by Sharpe, Treynor and Lintner.
Dimitrov [2] documented a significantly negative association between changes in financial leverage and contemporaneous riskadjusted stock returns.
Umar [3] found that firms which maintain good governance structures have leverage ratios that are higher (forty-seven percent) than those of firms with poor governance mechanisms per unit of profit. Chen et all [4] supported regulators’ suspicions that over-reliance on short-term funding and insufficient collateral compounded the effects of dangerously high leverage and resulted in undercapitalization and excessive risk exposure for Lehman Brothers. The model reinforces the importance of the relationship between capital structure and risk management. And Gunaratha [5]. evealed that in different industries in Sri Lanka, the degree of financial leverage has a significant positive correlation with financial risk.
During the financial crisis 2007-2009 in Viet Nam and global financial markets, high inflation causing high lending rates have created risks for many industries such as real estate and the whole economy. Mohamad et all [6] showed that financial risk is vital through using both return on asset and return on equity in the performance equation. This result also implied that we cannot avoid the inverse relation of financial risk and performance; therefore, bank system would be better to make a trade-off between risk and performance.
Wang et al [7] presented results showing that firms with longterm institutional investors receive significantly positive abnormal returns around the offering announcement.
Then, Gunarathna [8] revealed that whereas firm size negatively impacts on the financial risk, financial leverage and financial risk has positive relationship.
Hami (2017) showed that financial depth has been affected negatively by inflation in Iran during the observation period.
Park et al [9]. found that sentiment caused by investors’ inattentiveness mainly drives the underlying potent relationship between investor sentiment and aggregate stock returns. The results accord with the notion that investor attention generally improves market efficiency.
Conceptual theories
Positive sides of low inflation: Low (not negative) inflation reduces the potential of economic recession by enabling the labor market to adjust more quickly in a downturn, and reduces the risk that a liquidity trap prevents monetary policy from stabilizing the economy. This is explaining why many economists nowadays prefer a low and stable rate of inflation. It will help investment, encourage exports and prevent boom economy.
Negative side of low inflation: it leads to low aggregate demand and economic growth, recession potential and high unemployment. Production becomes less vibrant. Low inflation makes real wages higher. Workers can thus reduce the supply of labor and increase rest time. On the other hand, low product prices reduce production motivation.
The central bank can use monetary policies, for instance, increasing interest rates to reduce lending, control money supply or the Ministry of finance and the government can use tight fiscal policy (high tax) to achieve low inflation.
Financial and credit risk in the bank system can increase when the financial market becomes more active and bigger, esp. with more international linkage influence. This affects to risk increasing in construction and real estate sector. Hence, central banks, commercial banks, construction firms and the government need to organize data to analyze and control these risks, including market risk.
Methodology
We use the data from the stock exchange market in Viet Nam (HOSE and HNX) during the financial crisis 2007-2009 period and the post – low inflation time 2015-2017 to estimate systemic risk results. We perform both fundamental data analysis and financial techniques to calculate equity and asset beta values.
In this study, analytical research method and specially, comparative analysis method is used, combined with quantitative data analysis. Analytical data is from the situation of listed construction firms in VN stock exchange.
Specifically, stock price data is from live data on HOSE stock exchange during 3 years 2015-2017, which presents the low inflation environment. Then, we use both analytical and summary method to generate analytical results from data calculated. Finally, we use the results to suggest policy for both these enterprises, relevant organizations and government.
Main Results
General data analysis
We get some analytical results from the research sample with 20 listed firms in the construction market with the live date from the stock exchange.
Empirical research findings and discussion
In the below section, data used are from total 20 listed construction industry companies on VN stock exchange (HOSE and HNX mainly). Different scenarios are created by comparing the calculation risk data between 2 periods: the post – low inflation period 2015-2017 and the financial crisis 2007-2009.
Market risk (beta) under the impact of tax rate, includes: 1) equity beta; and 2) asset beta. We model our data analysis as in the below (Table 1).
    Risk level (equity beta)
    Risk level (asset beta)
    Other measures
    Gap


    Post – low inflation period
    Scenario    …
    Scenario    ..
    Scenario    ..
    Analysis


    Financial crisis time
Table 1: Analyzing market risk under two (2) scenarios: post – low inflation period
2015-2017 compared to the financial crisis 2007-2009.
Based on the above calculation result table, we analyze data as follows:
Firstly, we see in the (Table 2) that more construction firms (8 over 20 firms) have equity beta values lower (‹) than 1, which means risk level acceptable. There are 4 firms (LM3, MCG, DIG, and CNT) with equity beta › 1. And 5 companies with negative equity beta (‹0).
    2015-2017 (post - low inflation)


    Order No.
    Company stock code
    Equity beta
    Asset beta (assume debt beta =    0)
    Financial leverage
    Note


    1
    DIC
    0.381
    0.09
    76.30%
    assume debt beta = 0; debt    ratio as in F.S 2015; FL calculated as total debt/total capital


    2
    LBM
    1.534
    1.25
    18.50%


    3
    NAV
    0.286
    0.173
    39.50%


    4
    DXV
    -0.05
    -0.035
    30.60%


    5
    HT1
    0.806
    0.299
    62.90%


    6
    CVT
    0.815
    0.253
    68.90%


    7
    DC4
    0.577
    0.202
    65.00%


    8
    HPS
    -0.614
    -0.442
    27.90%


    9
    KBT


    10
    PPG


    11
    SDN
    -1.205
    -0.575
    52.20%


    12
    SKS


    13
    VXB
    0.319
    0.117
    63.30%


    14
    DHA
    -0.05
    -0.044
    12.20%


    15
    CTI
    0.35
    0.065
    81.50%


    16
    DCT
    0.037
    0.004
    90.20%


    17
    SCL
    1.012
    0.496
    51.00%


    18
    HVX
    0.308
    0.121
    60.60%


    19
    NHC
    -0.804
    -0.578
    28.20%
Table 2: The Volatility of Market Risk (beta) of Construction material Industry in the post- low inflation period 2015-2017.
And (Table 3) provides evidence for us to see that equity beta mean of the sample is 0.358, just little lower than (‹) 1. It is acceptable [10-21].
    2015-2017 (post - low inflation)


    Statistic results
    Equity beta
    Asset beta (assume debt beta =    0)


    MAX
    1.534
    1.25


    MIN
    -1.205
    -0.578


    MEAN
    0.231
    0.087


    VAR
    0.4796
    0.1878


    Note: Sample size : 19
Table 3: The Statistics of Volatility of Market Risk (beta) of Construction material
Industry in the post- low inflation period 2015-2017.
Then, looking at the (Table 4), we recognize that there are 4 firms with equity beta values › 1 in the post-low inflation period 2015-17, compared to 6 firms with equity beta values › 1 in the financial crisis 2007-2009.
    2007-2009 (financial crisis)
    2015-2017 (post - low    inflation)


    Order No.
    Company stock code
    Equity beta
    Asset beta (assume debt beta =    0)
    Equity beta
    Asset beta (assume debt beta =    0)
    Note


    1
    DIC
    0,986
    0,337
    0.381
    0.09
    assume debt beta = 0; debt    ratio as in F.S 2015 and 2008


    2
    LBM
    1,186
    0,783
    1.534
    1.25


    3
    NAV
    0,895
    0,539
    0.286
    0.173


    4
    DXV
    1,135
    0,185
    -0.05
    -0.035


    5
    HT1
    0,599
    0,087
    0.806
    0.299


    6
    CVT
    2,504
    1,031
    0.815
    0.253


    7
    DC4
    1,007
    0,345
    0.577
    0.202


    8
    HPS
    0,815
    0,697
    -0.614
    -0.442


    9
    KBT
    1,019
    0,639


    10
    PPG
    0,755
    0,354


    11
    SDN
    0,533
    0,281
    -1.205
    -0.575


    12
    SKS
    0,761
    0,358
    0
    0


    13
    VXB
    0,355
    0,141
    0.319
    0.117


    14
    DHA
    0,837
    0,704
    -0.05
    -0.044


    15
    CTI
    0,129
    0,041
    0.35
    0.065


    16
    DCT
    0,869
    0,316
    0.037
    0.004


    17
    SCL
    0,620
    0,338
    1.012
    0.496


    18
    HVX
    0,613
    0,426
    0.308
    0.121


    19
    NHC
    0,717
    0,549
    -0.804
    -0.578
Table 4: The Comparison of Volatility of Market Risk (beta) of Construction material Industry in the post- low inflation period 2015-2017 and the financial crisis 2007-
2009.
Next, (Table 5) shows that equity beta vary in the post- low inflation period are higher (›) than those in the financial crisis 2007- 2009. Furthermore, (Table 6) tells us equity beta max in the postinflation period 2015-2017 are higher (›) than that in the financial crisis 2007-2009, whereas asset and equity beta mean are smaller (‹) than those in the financial crisis 2007-2009.
    GAP (+/-) 2015-17 compared to 2007-09


    Order No.
    Company stock code
    Equity beta
    Asset beta (assume debt beta =    0)
    Note


    1
    DIC
    -0.605
    -0.247
    values (2015-17) minus (-)    2007-09


    2
    LBM
    0.348
    0.467


    3
    NAV
    -0.609
    -0.366


    4
    DXV
    -1.185
    -0.22


    5
    HT1
    0.207
    0.212


    6
    CVT
    -1.689
    -0.778


    7
    DC4
    -0.43
    -0.143


    8
    HPS
    -1.429
    -1.139


    9
    KBT
    -1.019
    -0.639


    10
    PPG
    -0.755
    -0.354


    11
    SDN
    -1.738
    -0.856


    12
    SKS
    -0.761
    -0.358


    13
    VXB
    -0.036
    -0.024


    14
    DHA
    -0.887
    -0.748


    15
    CTI
    0.221
    0.024


    16
    DCT
    -0.832
    -0.312


    17
    SCL
    0.392
    0.158


    18
    HVX
    -0.305
    -0.305


    19
    NHC
    -1.521
    -1.127
Table 5: The Difference between Volatility of Market Risk (beta) of Construction material Industry in the post- low inflation period 2015-2017 and the financial crisis
2007-2009.
    2007-2009 (crisis)
    2015-2017 (post - low inflation)
    GAP (+/-) 2015-17 compared to 2007-09


    Statistic results
    Equity beta
    Asset beta (assume debt beta =    0)
    Equity beta
    Asset beta (assume debt beta =    0)
    Equity beta
    Asset beta (assume debt beta =    0)


    MAX
    2.504
    1.031
    1.534
    1.25
    -0.97
    0.219


    MIN
    0.129
    0.041
    -1.205
    -0.578
    -1.334
    -0.619


    MEAN
    0.86
    0.429
    0.231
    0.087
    -0.628
    -0.342


    VAR
    0.2264
    0.0658
    0.48
    0.188
    0.253
    0.122


    Note: Sample size : 19
Table 6: Statistics of Volatility of Market Risk (beta) of Construction material Industry in the post- low inflation period 2015-2017 compared to those in the financial
crisis 2007-2009.
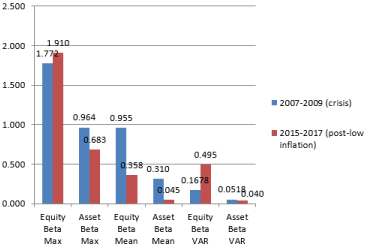
In addition to, looking at the below (Chart 1), we can find out:

    Chart 1: Statistics of Market risk (beta) in VN Construction industry in the post
– low inflation period 2015-2017 compared to the financial crisis 2007-2009.
More clearly, Values of equity beta max and equity beta var in the post-low inflation 2015-2017 are higher (›) than those in the crisis 2007-2009 while equity beta mean and asset bta mean are just little smaller (‹) than those in the financial crisis 2007-2009. It means that the level of risk in the post – low inflation period 2015-2017 is lower in general and in average, although the fluctuation in risk level measured by equity beta var is higher during the post-low inflation time.
Discussion for Further Researches
We can continue to analyze risk factors behind the risk scene (risk fluctuation increasing, shown by equity beta var as above analysis) in order to recommend suitable policies and plans to control market risk better.
Conclusion and Policy Suggestion
In general, construction company group in Vietnam has been contributing significantly to the economic development and GDP growth rate of more than 6-7% in recent years. The above analysis show us that despite of market risk decreasing, risk volatility (equity beta var) is increasing during the post-low inflation period. Construction firms in Vietnam need to continue increase their corporate governance system, structure and mechanisms, as well as their competitive advantage to control risk better. Also, they need to reduce risk of quality of real estate assets and reputation risk of construction companies.
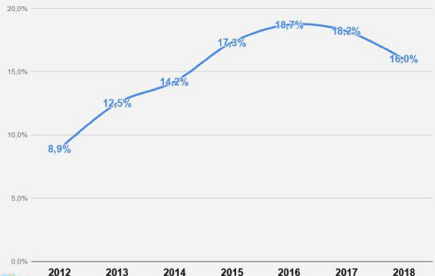
This research paper provides evidence that the market risk potential might be lower in 2015-2017 post-low inflation period (looking again chart 1 – equity beta mean values), while the (Figure 3) also suggests that the credit growth rate increased in 2016 and slightly decrease in later years (2017-2018). It means that the local economy is trying to control credit growth reasonably, however we need to analyze risk factors more carefully to reduce more market risk.

Figure 3: Loan/Credit growth rate in the past years (2012-2018) in Vietnam.
Looking at the above chart 1, the result rejects the hypothesis 3 mentioning that the mean of equity and asset beta values of these listed construction firms tend to impose a little high risk level, i.e., beta should higher than (›) 1. Because the equity beta mean is lower in the post-low (L) inflation period, it supports the hypothesis 1 saying that comparing two (2) periods, during the financial crisis impact, the beta or risk level of listed companies in construction industry will relatively higher than those in the post-low inflation environment. Additionally, the above result supports the hypothesis 2 stating that because Viet Nam is an emerging and immature financial market and the stock market still in the recovering stage, there will be a large disperse distribution in beta values estimated in the construction industry.
Last but not least, as it generates the warning that the risk fluctuation might be higher in the post-low inflation period, the government and relevant bodies such as Ministry of Finance and State Bank of Vietnam need to consider proper policies (including a combination of fiscal, monetary, exchange rate and price control policies) aiming to reduce the risk volatility and hence, help the construction system as well as the whole economy become more stable in next development stage. The Ministry of Finance continue to increase the effectiveness of fiscal policies and tax policies which are needed to combine with other macro policies at the same time. The State Bank of Viet Nam continues to increase the effectiveness of capital providing channels for construction companies as we could note that in this study, debt leverage has impacts on reducing risk level.
Finally, this study opens some new directions for further researches in risk control policies in construction system as well as in the whole economy.
Acknowledgements
I would like to take this opportunity to express my warm thanks to Board of Editors of This Journal and Colleagues at Citibank – HCMC, SCB and BIDV-HCMC, Dr. Chen and Dr. Yu Hai-Chin at Chung Yuan Christian University for class lectures, also Dr Chet Borucki, Dr Jay and my ex-Corporate Governance sensei, Dr. Shingo Takahashi at International University of Japan. My sincere thanks are for the editorial office, for their work during my research. Also, my warm thanks are for Dr. Ngo Huong, Dr. Ho Dieu, Dr. Ly H. Anh, Dr Nguyen V. Phuc, Dr Le Si Dong and my lecturers at Banking University – HCMC, Viet Nam for their help.
Lastly, thank you very much for my family, colleagues, and brother in assisting convenient conditions for my research paper.
References
- Eugene FF, French KR. The Capital Asset Pricing Model: Theory and Evidence, Journal of Economic Perspectives, 2004; 18: 25-46.
- Dimitrov V, Jain PC. The Value Relevance of Changes in Financial Leverage, SSRN Working Paper. 2006: 1-40.
- Umar. Profits, Financial Leverage and Corporate Governance, SSRN Working Paper Research. 2011.
- Chen RR, Chidambaran NK, Imerman MB, Sopranzetti BJ. Liquidity, Leverage, and Lehman: A Structural Analysis of Financial Institutions in Crisis, Fordham School of Business Research Paper No. 2279686. 2013; 45; 117-139.
- Gunaratha V. Degree of Financial Leverage as a Determinant of Financial Risk: An Empirical Study of Colombo Stock Exchange in Sri Lanka, 2nd International Conference on Management and Economics Paper. 2013.
- Li L, Pornchai C. Income Structure, Competitiveness, Profitability, and Risk: Evidence from Asian Banks, Review of Pacific Basin Financial Markets and Policies. 2014; 17: 1450015.
- Cheng LY, Wang MC, Chen, KC. Institutional Investment Horizons and the Stock Performance of Private Equity Placements: Evidence from the Taiwanese Listed Firms, Review of Pacific Basin Financial Markets and Policies. 2014; 17: 1-30.
- Gunarathna V. How does Financial Leverage Affect Financial Risk? An Empirical Study in Sri Lanka, Amity Journal of Finance. 2016; 1: 57-66.
- Park JC, Ali FD, Mbanga C. Investor sentiment and aggregate stock returns: the role of investor attention, Review of Quantitative Finance and Accounting. 2019; 53: 397-428.
- Allen F, Gale D. (1992). Stock Price Manipulation, Review of Financial Studies.
- Basu Devraj, Streme Alexander. CAPM and Time-Varying Beta: The Cross- Section of Expected Returns, SSRN Working paper series. 2007.
- Chatterjea Arkadev, Jerian Joseph A, Jarrow Robert A. Market Manipulation and Corporate Finance: A new Perspectives, 1994 Annual Meeting Review, SouthWestern Finance Association, Texas, USA. 2001.
- DeGennaro Ramon P, Kim Sangphill. The CAPM and Beta in an Imperfect Market, SSRN Working paper series. 2003.
- Emilios A. Bank Leverage Ratios and Financial Stability: A Micro- and Macroprudential Perspective, Working Paper No.849, Levy Economics Institute. 2015; 1-47.
- Galagedera DUA. An alternative perspective on the relationship between downside beta and CAPM beta, Emerging Markets Review. 2007; 8: 4-19.
- Khwaja Asim Ijaz, Mian Atif. Unchecked intermediaries:Price manipulation in an emerging stock market, Journal of Financial Economics. 2005; 78: 203- 241.
- Martin K, Sweder VW. On Risk, leverage and banks: Do highly leveraged banks take on excessive risk?, Discussion Paper TI 12-022/2/DSF31, Tinbergen Institute. 2012.
- Rahman Dima. Are Banking Systems Increasingly Fragile? Investigating Financial Institutions’ CDS Return Extreme Co-Movements, Quantitative Finance. 2013; 14: 805-830.
- Siller Thomas. Measuring Marginal Risk Contributions in Credit Portfolios, Quantitative Finance. 2013; 13: 1915-1923.
- Ang A, Chen J. CAPM Over the Long Run: 1926-2001, Journal of Empirical Finance. 2007; 14: 1-40.
- ADB and Viet Nam Fact Sheet. 2010; 1-5.