
Review Article
Austin J Bus Adm Manage. 2022; 6(1): 1053.
Factors Influencing Switching Behavior of Telecom Customers in Saudi Arabia
Al-Otaiby AK* and Ismail E
King Saud University, Riyadh 11451, Saudi Arabia
*Corresponding author: Abdulmajeed Khalid Al-Otaiby, King Saud University, Riyadh 11451, Saudi Arabia
Received: October 10, 2022; Accepted: November 01, 2022; Published: November 08, 2022
Abstract
Since the introduction of Mobile Number Portability (MNP), customers of telecom service providers have been switching between service providers in high rate in Saudi Arabia. This imposed a challenge for telecom service providers to know the reasons of such phenomena and try to minimize it. In this research paper, we studied the variables that affect the customer’s decision to stay with or switch current telecom service provider in Saudi Arabia. The analysis of data shows that the most significant variable is offers and prices.
Keywords: Mobile number portability; Switching behavior; Customer decision; Telecom services; Offers & prices; quality reliability; Technical support; E-services
Abbreviations
MNP: Mobile Number Portability (MNP); CITC: Communication and Information Technology Commission; STC: Saudi Telcom Company; Mobily: Etihad Etisalat Mobily; Zain: Zain Saudi Telecom Company; E-Services: Electronic Services.
Introduction
Before the introduction of Mobile Number Portability (MNP), customers of telecom service providers were not able to change their service provider while keeping their numbers. This almost eliminated the switching requests between service providers due to the customer’s fear of losing their numbers which have become as important as identity numbers for many people due to the rise of technology in every aspect of life. This act of fear faded away after many countries adopted MNP which allows customers to switch their service providers while keeping their original number. MNP has sparked the switching rate between telecom service providers.
MNP was introduced in Saudi Arabia in 2006. Since then, switching between Local telecom companies, which are STC, Mobily and Zain, have spread among customers. The customers are now more aware about what they should receive, in terms of service’s quantity and quality, in exchange of their subscriptions fees. As a result of awareness among customers, they tend to change their service providers because of many reasons.
In this research paper, we aim to study the variables that affect the customer’s decision to stay with or switch current telecom service provider in Saudi Arabia.
Literature Review
Customer retention has been a very attractive subject to many researchers. This subject has also been very important factor to consider in every firm’s strategy. Many firms have started to acquire every available information in this field. Marketing researchers were targeted by those firms to investigate why do customers switch and how to retain them. Each firm’s goal is to identify the reasons that adversely influence the customer relationship with the firm and drive him to switch to other competitors. Then the firm will try to apply the corrective strategies and actions to stop losing its market share due to these reasons.
Many researchers believe that to understand customer retention, you should have background knowledge in many areas such as customer behavior, customer satisfaction and customer loyalty. [1] Suggest that the analysis of customer’s behavior should be according to four distinct customer segments, which are based on their staying or switching behavior. The four groups are satisfied switchers, dissatisfied stayers, satisfied stayers and dissatisfied switchers. They also point out that satisfaction does not appear to drive repeat purchases for all consumers. That is why Ganesh et al [2] stated that “…. Not all customers should be targeted with retention and loyalty efforts, and some of the most satisfied and loyal customers might still switch to a competitor for reasons beyond the control of the firm and at times even beyond the control of the customer”.
The marketing literature suggests that the three concepts loyalty, satisfaction and involvement with the addition of demographics factors may give the researcher an understanding of customers’ switching behavior. The first concept “loyalty” has been emphasized by academics and professionals as a key to a successful business. The second concept “satisfaction” is highly positively correlated to customer retention, but as mentioned above it does not appear to drive repeat purchases for all consumers. Satisfaction is mainly correlated to service quality factors such as reliability and responsiveness. Loyalty and satisfaction are influenced by demographic factors. For example, women care about the support and help from staff members. Thus, their evaluation and satisfaction are influenced more by the personal interaction with the staff members. Also, old people above 55 tend to be more loyal than young people since they are slower in information processing ability. In addition, it has been found that education level is inversely correlated to customer satisfaction. The third concept “involvement” is related to switch behavior by how much a customer is involved in the purchase decision [1].
Butt, Bhutto and Abbas [3] argue that researches about stayers and switchers are little and limited. They stated that switching and staying behavior of the customer is strongly related with the satisfaction level. Satisfaction is interpreted as the difference between expected service and real perceived service [4]. The expectation level of new customers is influenced by previous experiences with the service of former company [5]. Butt et al [3] found that dissatisfied switchers are more satisfied in the new company than satisfied switchers and stayers. Also, they found that satisfied switchers are significantly less satisfied than stayers. Almotairi and Almeshal [6] stated that, a clear relationship exists between the quality of service a company provides and the customer satisfaction level gained.
Mouri [19] has defined brand switching as a termination of customer relationship with particular service provider and continuation of relationship with a new service provider. Customer switching behavior is defection or exit of customers from company [15]. According to Boote [16], customer switching behavior is a decision of customers to discontinue purchase dealings permanently or temporary.
In our research, we are considering the switchers and stayers in the telecom service industry in Saudi Arabia which has three main telecom companies which are STC, Mobily and Zain. Long time ago, people around the world were not able to shift to another telecom service provider keeping their original number. This stopped many people from changing their telecom service provider. Now, a process called Mobile Number Portability (MNP) is practiced in the telecom industry around the world. This process enables customers to shift to another telecom service provider keeping their original number. MNP implies that customer should contact the new provider to arrange the transfer without the need of the approval of the old provider with the condition of paying all pending invoices on the customer to the old provider. This process changed the telecom market in terms of customer retention.
According to Yadav and Dabhade [8] many benefits emerged to operators as well as customers from applying Mobile Number Portability (MNP). Now, operators can save expenses related to number series reservation, since they don’t have to pay the reservation expenses for the incoming customers’ numbers that come through MNP. In Addition, new comers in this business will have fewer struggles to attract customers. Also, customers can now enjoy the offers and prices that result from competition between telecom companies. According to Buehler and Haucap [11], MNP results in elimination of switching costs which is a benefit to the customers.
Yadav and Dabhade [8] discussed also the negative impacts on service providers such as increasing competition and profit margin erosion. Dani and Ambavale [13] discussed both positive and negative impacts on telecom service providers. They listed the positive impacts as improved competitive service provided by operators, and new entrants in the business will attract new customers more easily. For the negative impacts, they listed growing rivalry, grinding down profit margin and unethical synergy between operators.
According to Agyekum, Tchao and Affum [9], the threat of switching has led to improved competition among operators resulting in lower tariffs, better services and improved Quality Of Service (QoS) of the networks. Hence, the implemented MNP policy could be considered as successful. They also found that the two major reasons for customer dissatisfaction are high tariff rate and poor network coverage.
The relationship between the “Offers &Prices” and Switching Behavior
Change in demand in response to change in prices is called sensitivity of demand (Fuha, 2005). Price sensitivity has divided telecommunication segment into three segments. These are fixed line segment, mobile segment and combined segment. Fuha (2005) has determined relationship between changes in price and demand in telecommunication industry. His findings suggested that reduction in price of mobile services attract customers. In other words price changes influence brand switching in telecommunication industry. Kumaresh and Praveena [11] found that promotional offers, family orientation and service affordability are the most important factors influencing the mobile subscriber intention to switch service provider. A study on which factors influence customers to switch mobile service providers was done by Lee and Murphy [17]. They found that price is the most important factor that persuades customers to change their mobile service providers. Rajkumar [20] suggest that price is not always brand switching influencer. He explained that customers who are quality conscious prefer to pay high prices for high quality. It influences those customers who have limited income. Companies use this feature of price and provide price comparisons to customers in order to persuade them to try new products. According to Sathish et al [18], call rates is the most influencing factor for brand switching in telecommunication industry. Studies show that price is major influencer for brand switching. It is not necessary that price always affects brand switching. Customers with low income are more influenced by changes in price to switch service providers whereas quality conscious customers are less influenced by changes in price to switch brands.
The Relationship between the “Quality & Reliability” and Switching Behavior
Service is intangible in nature and it is practiced by the customers simultaneously at the time of production and consumption. Contact of customers and service providers delivers service to the ultimate customers [21]. Five characteristics have been identified by (Gronroos) [21] which distinguish services from goods. These characteristics are services are intangible, services cannot be separated during production, delivery and consumption, services are heterogeneous, services are perishable and cannot be stored, and there is no transfer of ownership while delivering services. The interaction between customers and service providers provide opportunity to the customers to assess the service quality. Bitner & Hubbert (1994) define service quality as the impression of customers about the inferiority or superiority of the service providers and their provided services. Previous researchers have shown that customer decision is influenced by service quality and reliability. It can be deduced that if customers are provided with high service quality they can be retained with the company or in other words switching rate of customers can be reduced.
The Relationship between the Technical Support and Switching Behavior
Wigglesworth [22] stated that standard measure is of primary importance to both mobile operators and regulators. First, mobile operators can utilize a standardized satisfaction measure for strategic benchmarking with other telecommunications service providers. Second, they may self-assess their performance through the application of longitudinal satisfaction studies. Third, the use of such a measure may help regulators better achieve their objectives by overcoming the flaws of extant service-level regulations. To ensure acceptable service levels, regulators typically enforce a maximum number of disconnections, coverage constraints and technical standards. Bougie Piters and Zeelanberg (2003) agreed with Andreassen (2001) that customer encounters a service failure; it leads to dissatisfaction and loss of confidence, negative emotion, and customer switching. Service recovery can be defined as the way organization provides response to what is perceived as a service failure; it includes psychological and tangible efforts to address the service failure in order to satisfy, keep or restore relationship with disappointed customers (Lovelock & Wirtz, 2011). Customer satisfaction service recovery is an overall customer attitude towards service provider and regarded as a pivotal element in maintaining long-term customer relationship after service failures. Customer satisfaction is the feeling or attitude of a customer towards a product or service after it has been used [24]. Previous researchers have shown the importance of the technical support provided to the customer and how it’s affecting the customer satisfaction.
The Relationship between the E-Services and Switching Behavior
Melody [25] suggests that the reform of communication technology has since been expanded to include the transformation of the traditional voice telecom network into an expanded and enhanced information infrastructure, which is capable of communicating all forms of information content. The nature of competition today in the global telecommunication industry seems to focus on market activities that aim at gaining competitive advantages through strategic combinations of resources and presences in multiple products and geographical areas [23]. Previous researchers have shown the importance of using the technology in the provided services, where it affects the customer decisions wither to stay or switch its service provider.
In Saudi Arabia, MNP was introduced in 2006. At first, telecom service providers created many obstacles to try to stop this new procedure. Few customers were able to switch their numbers in the first five years. But in order to create an efficient telecom market, Saudi Communication and Information Technology Commission (CITC) imposed many sanctions on the companies that tried to create obstacles to prevent their customers from switching. Eventually, the application of MNP was successful in the kingdom. Below is a figure that shows how many numbers were successfully switched between telecom service providers in Saudi Arabia from 2011 to 2015 (CITC Annual Report, 2015).
Decision Statement
In this research paper, we aim to study the variables that affect the customer’s decision to stay with or switch current telecom service provider and pass the results to the interested parties such as telecom companies or CITC to benefit them. This study will cover different aspects of these variables such as its significance in relation to the whole market or to a specific company.
Objectives
Mobile Number Portability (MNP) allow customers to change their telecom service provider. In this research paper, we will look over the variables that affect the customer decision of either staying with or switching the current telecom service provider. Specifically, the objectives of this research paper are:
1) To investigate which one of the following variables:
• Offers & Prices
• Quality & Reliability
• Technical support
• E-Services
Is the most significant variable that affects the customer’s decision to stay with or switch the current telecom service provider?
2) To determine the most significant variable for each local company (Namely: STC, Mobily and Zain) that drives their customers to switch.
Hypotheses
Based on the above literature review and unstructured interviews with many customers, two hypotheses were formulated as follows:
H1: Quality & Reliability is the most significant variable that affects the customer’s decision to stay with or switch the current telecom service provider.
H2: The most significant variable for each local company (Namely: STC, Mobily and Zain) that drives their customers to switch, is:
Research Methodology
To test our hypothesis, we designed an internet survey questionnaire that studies the effect of following variables (offers & Prices, quality & Reliability, technical support, e-Services) on the customer’s decision to stay with or switch the current telecom service provider. A copy of the survey questionnaire can be found in the appendix. The target population of our study is the people who live in Saudi Arabia, use telecommunication services and have changed their telecommunication service provider. The survey questionnaire was distributed through social media to ensure a high participation rate and cover different cases and types of people all around Saudi Arabia randomly. A filter question was put at the start of the questionnaire which asks the participants if he or she had ever changed their service provider. Only answering with yes will allow them to continue and fill the rest of the questionnaire. The questionnaire was distributed in both Arabic and English language to reach both Saudi and non-Saudi who live in Saudi Arabia.
Likert method was used to measure respondents’ attitudes and IBM SPSS statistics program was used to analyze the results and the data was coded as follows:
• 1 = Strongly disagree
• 2 = Disagree
• 3 = Neutral
• 4 = Agree
• 5 = Strongly agree
• 1 = Never
• 2 = Rarely
• 3 = Sometimes
• 4 = More often
• 5 = Always
It is important to mention that some data was reversing coded. Likert statements in the questionnaire have either a positive or negative correlation with effeteness of the variables. Thus, reverse coding is done on Likert statements that have negative correlation.
Data Analysis & Results
It’s worth mentioning that 1098 people participated in the questionnaire and only 495 people (45.1%) changed their service provider and were allowed to continue and fill the rest of the questionnaire. After that editing process was applied on the results to exclude the responds which have issues such as incompleteness and contradiction. This left us with 301 responds (27.4% of the total 1098 responds or 60.8% of switcher) which were included in our analysis.
Analyzing the data revealed that the majority of respondents were Saudi (97.7%), male (75.7%), young (55.1% below 34 years old) and well educated (82.3 % had completed at least an undergraduate degree). The respondents had relatively high incomes with 63.9% earn more than 10,000 SR per month. Majority of respondents had STC as their former service provider (60.8%), followed by Mobily (30.6%), then Zain (8.6%). On the other hand, most respondents have Mobily as their current service provider (46.2%), followed by STC (32.6%), then Zain (21.3%) (See the below figures).
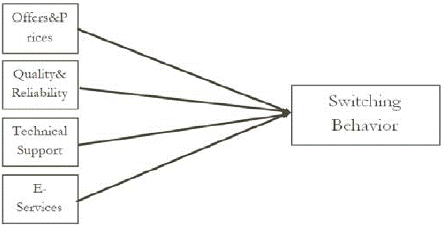
Figure 1: Research Model.
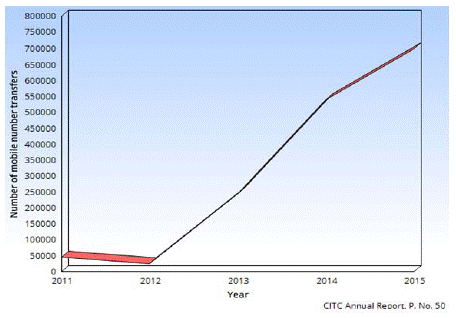
    Figure 2: Number of mobile number transfer between Saudi telecom

companies.
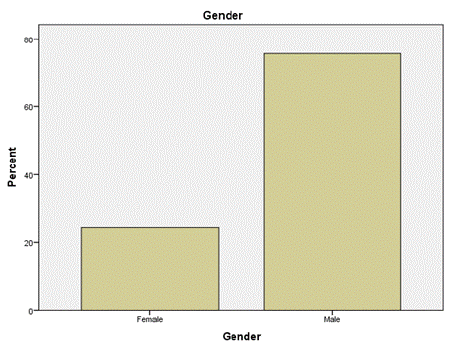
Figure 3: Demographic Factors (Gender).
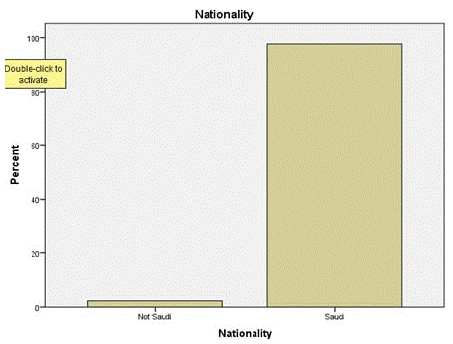
Figure 4: Demographic Factors (Nationality).
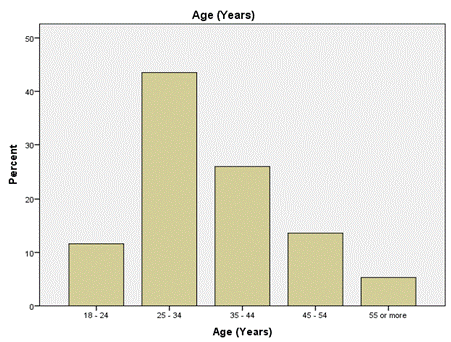
Figure 5: Demographic Factors (Age).
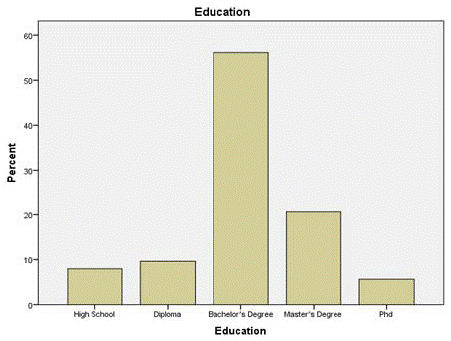
Figure 6: Demographic Factors (Education).
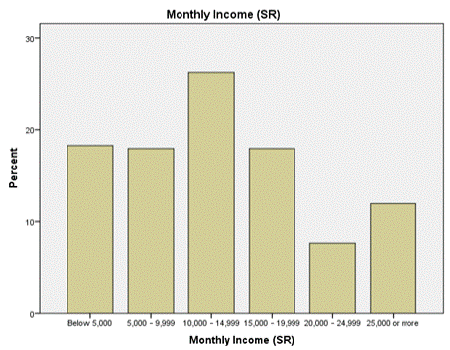
Figure 7: Monthly Income (SR).
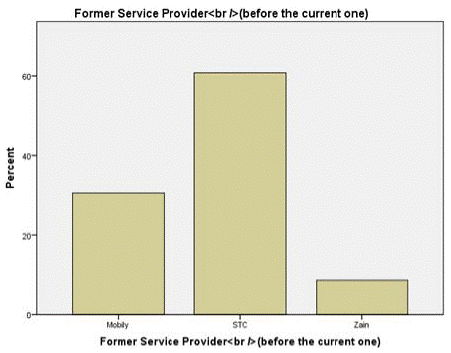
Figure 8: Fromer Service Provider.
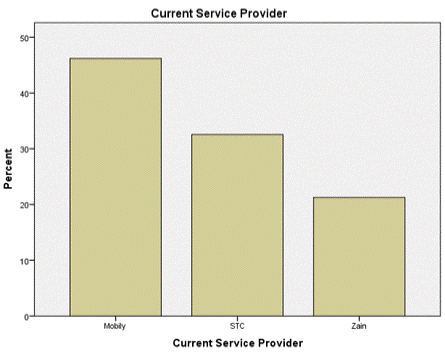
Figure 9: Current Service Provider.
To test our hypothesis, we generated a group of Likert statements for each of the variables that we want to study its effect on the customer’s decision to stay with or switch the current telecom service provider. For each variable, four or more composed statements of Likert-type represent a similarity that can be combined into a single composite score or variable. In this case the composite score can be analyzed as interval data and the mean is the best measure of central tendency.
The first factor (offers and Prices) contain four composed statements of Likert-type that represent similarity and can be combined into a single composite score. The second factor (quality and reliability) has six composed Likert statements which were combined into a single score. The third factor (technical support) has five composed Likert statements which were combined into a single score and the fourth factor (E-service) has four composed Likert statements which were combined into a single score.
To test H1, the mean for each combined score was calculated as shown in the table:
    Company

    Most significant variable


    STC

    Offers & Prices


    Mobily

    Quality & Reliability


    Zain

    Quality & Reliability
Table 1: Most Significant variable of each local company.
    Frequency

    Percent

    Valid Percent

    Cumulative Percent


    Valid

    Female

    73

    24.3

    24.3

    24.3


    Male

    228

    75.7

    75.7

    100.0


    Total

    301

    100.0

    100.0
Table 2: Demographic Factors (Gender).
    Frequency

    Percent

    Valid Percent

    Cumulative Percent


    Valid

    Not Saudi

    7

    2.3

    2.3

    2.3


    Saudi

    294

    97.7

    97.7

    100.0


    Total

    301

    100.0

    100.0
Table 3: Demographic Factors (Nationality).
    Frequency

    Percent

    Valid Percent

    Cumulative Percent


    Valid

    18 - 24

    35

    11.6

    11.6

    11.6


    25 - 34

    131

    43.5

    43.5

    55.1


    35 - 44

    78

    25.9

    25.9

    81.1


    45 - 54

    41

    13.6

    13.6

    94.7


    55 or more

    16

    5.3

    5.3

    100.0


    Total

    301

    100.0

    100.0
Table 4: Demographic Factors (Age).
    Frequency

    Percent

    Valid Percent


    Valid

    High School

    24

    8.0

    8.0


    Diploma

    29

    9.6

    9.6


    Bachelor’s Degree

    169

    56.1

    56.1


    Master’s Degree

    62

    20.6

    20.6


    Phd

    17

    5.6

    5.6


    Total

    301

    100.0

    100.0
Table 5: Demographic Factors (Education).
    Frequency

    Percent

    Valid Percent


    Valid

    Below 5,000

    55

    18.3

    18.3


    5,000 - 9,999

    54

    17.9

    17.9


    10,000 - 14,999

    79

    26.2

    26.2


    15,000 - 19,999

    54

    17.9

    17.9


    20,000 - 24,999

    23

    7.6

    7.6


    25,000 or more

    36

    12.0

    12.0


    Total

    301

    100.0

    100.0
Table 6: Monthly Income (SR).
    Frequency

    Percent

    Valid Percent

    Cumulative Percent


    Valid

    Mobily

    92

    30.6

    30.6

    30.6


    STC

    183

    60.8

    60.8

    91.4


    Zain

    26

    8.6

    8.6

    100.0


    Total

    301

    100.0

    100.0
Table 7: Former Service Provider.
    Frequency

    Percent

    Valid Percent

    Cumulative Percent


    Valid

    Mobily

    139

    46.2

    46.2

    46.2


    STC

    98

    32.6

    32.6

    78.7


    Zain

    64

    21.3

    21.3

    100.0


    Total

    301

    100.0

    100.0
Table 8: Current Service Provider.
    Mean

    Std. Deviation

    Variance


    Offers_and_Prices

    3.49

    1.146

    1.312


    Quality_and_Reliability

    3.24

    1.194

    1.426


    Technical_Support

    3.31

    1.184

    1.401


    E_Serices

    3.27

    1.014

    1.029
Table 9: Variables means for whole market.
    Mean

    Std. Deviation

    Variance


    offers_and_prices

    3.75

    1.078

    1.161


    quality_and_reliability

    3.23

    1.239

    1.535


    technical_support

    3.42

    1.203

    1.448


    E_Serices

    3.22

    1.026

    1.052
Table 10: Variables means for STC.
    Mean

    Std. Deviation

    Variance


    offers_and_prices

    3.08

    1.087

    1.182


    quality_and_reliability

    3.25

    1.112

    1.237


    technical_support

    3.13

    1.111

    1.235


    E_Serices

    3.35

    1.012

    1.024
Table 11: Variables means for Mobily.
    Mean

    Std. Deviation

    Variance


    offers_and_prices

    3.08

    1.267

    1.606


    quality_and_reliability

    3.28

    1.162

    1.349


    technical_support

    3.13

    1.203

    1.448


    E_Serices

    3.31

    .925

    .856
Table 12: Variables means for Zain.
The above data does not support our first hypothesis. H1 states that quality and reliability is the most significant variable that affects the customer’s decision to stay with or switch the current telecom service provider. The above data shows that the most significant factor is offers and prices.We think that the reason,why did not the above data support our H1, is related to the representativeness of the sample. Most of the sample had STC as their former service provider (60.8%) and as indicated in the upcoming H2, STC had offers and prices as the most significant variable. Data from CITC showed that STC as a former service provider should constitute less than (60.8%) in the whole population. Thus, we think that,the majority of the sample having STC as their former service provider, affected the result of the overall sample and that is why the variable offers and prices had the highest significance number.
To test H2, the combined score for each factor was separated on the basis of the former service provider. Then, for each former service provider we calculated the mean for the combined scores to find the most significant variable for each service provider.
The results are:
H2 states that the most significant variable for STC is offers and prices. The above data supports this as it shows that the most significant variable for STC is offers and prices.
For Mobily:
H2 states that the most significant variable for Mobily is quality and Reliability. The above data does not support this as it shows quality and Reliability having the second rank in significance. We think that E-services have become a major concern in customers’ mind in recent years especially between young generation who forms the majority of our sample (55.1% below 34 years old) and the people in Saudi Arabia. Having excellent E-services means that customers could be able to perform many functions online in any time and place without having to go to retailing offices. By examining The e-services of both Mobily and Zain, we notice that they don’t meet the customers’ expectation especially when STC is excelling in this field and presenting their application “My STC” which out-performs the applications of both Zain and Mobily.
For Zain:
H2 states that the most significant variable for Zain is quality and Reliability. The above data does not support this as it shows quality and Reliability having the second rank in significance with a very close mean with the most significant variable E-services. We explained above why the data did not support our hypothesis and why did it show E-services as the most significant variable for both Mobily and Zain.
Conclusion
In this paper, we have studied four variables (offers and prices, quality and reliability, technical support, E-services) that are considered the main variables which affect the customer’s decision to stay with or switch the current telecom service provider in Saudi Arabia. This paper studied these variables’ significance in relation to the whole market or to a specific company.
A literature review was introduced in this paper covering different subjects related to switching behavior: customer retention, customer satisfaction, customer loyalty, MNP impact and switching reasons. Then the objectives and hypotheses, regarding the switching variables of interest, were stated. A survey questionnaire was designed and distributed to gather the required date to analyze and test the hypotheses. Extensive editing was done to the survey’s responds to exclude any responds that may distort the accuracy of the results.
The analysis of data did not support H1 and shows that the most significant factor that affects the customer’s decision to stay with or switch the current telecom service provider is offers and prices. On the other hand, the first part of H2, which states that the most significant variable for STC is offers and prices, is supported by our analysis. The second and third part of H2, which states that the most significant variable for Mobily and Zain is quality and Reliability, was not supported by the analysis of data.
Recommendations
1. The above analysis, result, findings and outcome; the researchers recommend the following:
As generally as Saudi telecommunication market, it’s clearly noticed that customers are very sensitive to prices and offers. Accordingly, it’s highly recommended to optimize the service provider costs structures in order to enable the company to sustain and provide more appealing prices and offers.
A well define pricing strategy will grant the service provider a great competitive advantage in the Saudi telecom market or industry.
2. For STC, despite that it’s the oldest service provider in the Saudi telecom industry; yet it has to review its pricing and offers. Though STC markets itself as the best network coverage and reliable service provider, the research revealed that customers are very sensitive to prices as (mentioned in previous bullet) and it’s the main influencer to switchers from STC. Accordingly, STC should pay more attention to its costing structure and investments plans in order to manage and continue their dominant over the Saudi telecom industry.
3. For Mobily (the second oldest service provider in the Saudi telecom industry) and Zain (the third service provider entered the Saudi telecom industry) the E-services was the main influencer to switchers. In the era of smart gadgets and internet services revolutions, both Mobily and Zain must invest more in providing better e-services taking into consideration the following:
a) Ease of Use (Usability)
b) Reliability, that e-services would perform customer’s requirement in an adequate time.
c) Availability, as the online services should be available 24/7
d) Accessibility, Mobily should over their e-services all current available platforms i.e., IOS, Android, Windows...etc.
e) Usefulness, e-services should be up to date with offers, news, products…etc. to promote its usage.
It’s worth mentioning that “Quality and Reliability” scored pretty high and close figure, (just 0.1 for Mobily and 0.04 for Zain) below “E-Services” as the second influencer over their switchers. Accordingly, infrastructure plans and projects should be taken to a whole new level of sustainable quality without affecting their pricing strategies if would like to retain its customers.
Research Limitation and Future Venues
The research sample should have been bigger to be more representative, also more variables could participate as an influencer whom the research didn’t cover such as family member & friends, service provider financial status, customer service, and customer boycott. On the survey side, interviews would give more deceptive insight that didn’t take place in this research.
References
- Skogland I, Siguaw JA. Understanding Switchers and Stayers in the Lodging Industry. School of Hotel Adminstration. 2004.
- Ganesh J, Arnold MJ, Reynolds KE. Understanding the Customer Base of Service Providers: An Examination of the Differences between Switchers and Stayers. Journal of Marketing. 2000; 64: 65-87.
- Butt F, Bhutto NA, Laghari MK. Exploring the Difference between Stayers and Switchers as Corporate Customers for Life Insurance Companies in Sindh. Asian Social Science. 2012; 8: 233.
- Oliver RL. Satisfaction: A Behavioral Perspective on the Consumer. Irwin/ McGraw-Hill, Boston, MA. 1997.
- LaTour SA, Peat NC. The role of situationally produced expectations, others’ experiences and prior experience in determining consumer satisfaction. in: Olson, J. C. (ed.) Advances in Consumer Research, Association for Consumer Research, Ann Arbor, MI. 1980.
- Almotairi M, Almeshal S. Saudi telecom company: customer focus. Journal of Competitiveness Studies. 2015; 23: p103.
- Yu YT, Dean A. The contribution of emotional satisfaction to consumer loyalty. International Journal of Service Industry Management. 2001; 12: 234-250.
- Yadav RK, Dabhade N. Effects of Mobile Number Portability in Telecom Sector - a Case Study of Idea Cellular Ltd. Indian Journal of Economics and Development. 2013; 1: 49-59.
- Gyekum KA, Tchao ET, Affum E. Customer experience with mobile number portability. International journal of emerging technology and advanced engineering. 2013; 3.
- Roos I, Friman M, Edvardsson B. Emotions and Stability in Telecom-customer Relationships. Journal of Service Management. 2009; 20: 192-208.
- Buehler S, Haucap J. Mobile Number Portability. Journal of Industry, Competition and Trade. 2004; 4: 223-238.
- Giese J, Cote J. Defining consumer satisfaction. Academy of marketing science. 2000: 1.
- Dani S, Ambavale R. A study on customer satisfaction of mobile users in Ahmedabad city in context of mobile number portability. international journal of application or innovation in engineering & management. 2014; 3.
- K Kumaresh, S Praveena. An empirical analysis of consumer switching behavior towards mobile number porta¬bility, National monthly refereed journal of research in com¬merce & management. 2011; 1: 10-22.
- Stewart K. Customer exit: Loyalty issues in retail banking. Irish Marketing Review. 1994; 7: 45-53.
- Boote J. Towards a comprehensive taxonomy and model of consumer complaining behaviour. Journal of Consume Satisfaction, Dissatisfaction and Complaining Behaviour. 1998; 11: 141-149.
- Lee R, Murphy J. From Loyalty to Switching: Exploring the Determinants in the Transition. {journal}. 2005: 196-203.
- M Sathish, K Santhosh Kumar, KJ Naveen, V Jeevanantham. A Study on Consumer Switching Behaviour in Cellular Service Provider: A Study with reference to Chennai, Far East Journal of Psychology and Business. 2011; 2: 2.
- Mouri Nacef. A Consumer-based Assessment of Alliance Performance: An Examination of Consumer Value, Satisfaction And Post Purchase Behavior. University of Central Florida, Electronic Theses and Dissertations. 2005.
- Rajkumar R, LJ Chaarlas. Brand Switching In Cellular Phone Service Industry Because Of Bill-Related Issues Faced By Clients, International Journal of Electronic Marketing and Retailing. 2011; 1: 5.
- Grönroos C. Relationship approach to marketing in service contexts: The marketing and organizational behavior interface. Journal of Business Research. 1990; 20: 3-11.
- Wigglesworth WRB. The role of information in telecom regulations. In W. H. Melody (Ed.), Telecom reform: Principles, policies and regulatory practices. Lyngby, Denmark: Center for Tele-Information, Technical University of Denmark. 1997; 295–324.
- Johnson MD, Gustafsson A, Andreassen TW, Lervik L, Cha J. The Evolution and Future of National Customer Satisfaction Index Models. Journal of Economic Psychology. 2001; 22: 217-245.
- Jamal A, Naser K. Customer satisfaction and retail banking: an assessment of some of the key antecedents of customer satisfaction in retail banking. International Journal of Bank Marketing. 2002; 20: 146-160.
- Melody WH. Preparing the information infrastructure for the network economy. Elgaronline. 2003.
- CITC. Mobile Number Portability. CITC Annual Report. 2015: 50-50.