
Special Article - Myocardial Infarction
Austin Cardio & Cardiovasc Case Rep. 2018; 3(1): 1021.
Splitting of the ECG Pattern is Not only a Sign of Possible Myocardial Infarction or Cardio Pathology, But one of Many Possible Normal States of the Nonlinear Dynamics of the Heart as Well
Shmid AV¹, Novopashin MA¹, Zimina EY² and Berezin AA¹*
¹Department of EC-leasing Moscow, Russia
²Department of High School of Economics Moscow, Russia
*Corresponding author: Berezin AA, Department of EC-leasing, Moscow, Russia
Received: April 19, 2018; Accepted: May 24, 2018; Published: May 31, 2018
Abstract
The ECG features analysis in a patient born in 1946 led to repeated statement of misdiagnosis, particularly of myocardial infarction. About 2,500 patients’s ECGshave been analyzed for the three-year period of the patient’s observation. A Fourier analysis of the spectra of the ECGs of the patient 2506 allowed to assume that there exists an additional leading center in his myocardium, with a variable start phase of the myocardium relative to the phase of the fundamental frequency of contractions of the myocardium. Experimental confirmation of this hypothesis is in particular; found in the patient jump-like transition from synchronous phase daily changes in the function dynamics of the P wave width and the PQ segment to the antiphase ones, which reflects the change in the conditions for triggering the process of myocardial contraction. As a result, the coupling of the two leading frequencies of the myocardium, with a variable phase shift of the triggering, can be expressed both in the extra systoles appearance as well as in unusual cardio cycles not coinciding in the form and phase of cardio cycles of a single ECG. Cluster analysis of the entire set of collected patient’s ECGs in the similarity of their forms revealed 18 separate clusters of similarity. While cluster analysis of the ECG samples in other 4857 patients in most cases led to the identification of only one cluster characteristic for a certain patient’s ECG form.
Mathematical modeling of the proposed hypothesis about the presence of more than one leading center of myocardial triggering which resulted in getting model patterns of split ECGs, qualitatively corresponding to the split forms of ECGs observed in the studied patient, confirmed its validity.
Introduction
For several years, under the daily supervision (ECGs daily registered by a mobile Cardiograph CardioCVARK [1]) there has been a patient born in 1946, who in his youth was an athlete and engaged in sports such as lifting heavy weights, rowing and athletics. In the analysis of his ECGs, along with normal ECGs, there were often found split ECGs, which were repeatedly interpreted by cardiologists in favor of the presence of myocardial infarction or other cardio pathologies in the patient. However, the overall health of the patient with split cardiograms remained normal, and the standard hospital study of the patient’s condition with suspected to heart attack, including high loads on treadmill, did not reveal the presence of any cardio pathology. It is interesting to note that after the average load, for example, on the Bicycle Ergometer, the split ECG was replaced by a normal one. Multiple comparative Fourier analysis of his 2,500 ECGs, registered over 3 years of observation, revealed the presence of 18 types of different stable States as an open nonlinear thermodynamic system corresponding to 18 types of FPU auto recurrences [2], which replaced each other during the observation. It was also revealed 244 transitional (not reproducible) heart States.
Both main and transitional States of the patient’s heart were able to be identified in the database of the patient’s ECGsdue to the application of the tool created for this study for digging data (Data mining) providing the detection of similarity of the ECG forms (ECG clustering forms).
Figure 1 shows the patient’s ECG corresponding to one of the main conditions of the patient’s heart, and Figure 2 of its Fourier spectrum. Worth mentioning, that this Fourier spectrum corresponds to the General form of the Fourier spectrum of the rectangular pulse [3] and is typical for healthy persons.
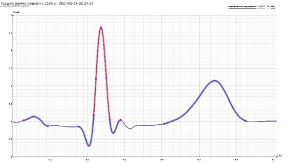
Figure 1: Normal ECG of the patient 2506.
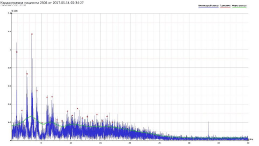
Figure 2: Fourier spectrum of a normal patient’s 2506ECG.
(Figure 3,4) present Fourier spectra of the patient’s ECG of two stable States corresponding to typical spectra of athletes. It should be noted that this spectrum corresponds to the General form of the Fourier spectrum of the expansion of an exponential pulse [3].
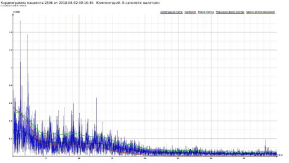
    Figure 3:  The Fourier spectrum of the ECG of the patient 2506, similar in its
form to the Fourier spectrum of the ECG of athletes.
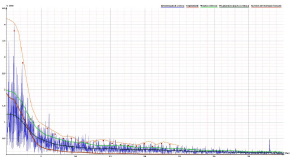
    Figure 4:  Typical Fourier spectrum of a normal ECG observed in athletes
and in patient 2506.
Figure 5 shows a typical ECG of a patient 2506 with a simple form of splitting corresponding to the steady state of the patient’s heart, and Figure 6 shows its Fourier spectrum.
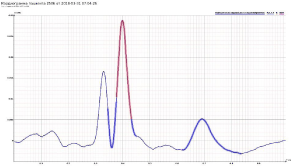
Figure 5: The patient’s 2506 ECG with a simple form of splitting.
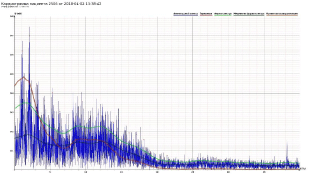
    Figure 6:  Fourier spectrum of the patient’s 2506 ECG with a simple form
splitting.
In Figures 7-9 the ECG of two variants of the patient’s heart States with complex forms of splitting are presented, and in Figure 8,10 their Fourier spectra are shown.
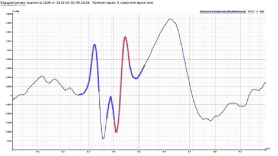
Figure 7: The patient’s 2506 ECG with a complex form of splitting.
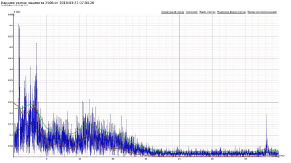
    Figure 8:  Fourier spectrum of the patient’s 2506 ECG with a complex form
of splitting.
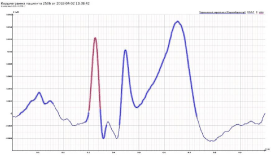
Figure 9: The patient’s 2506ECG with a complex form of splitting.
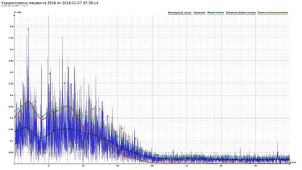
    Figure 10:  Fourier spectrum of the patient’s 2506 ECG with a complex form
of splitting.
Further, in Figure 11 are presented the comparative results of daily simultaneous observations of fluctuations of the P wave width and the PQ segment of the cardiac cycle, characteristic for most patients participating in the project Cardio CVARK, and in Figure 12 are presented the results of observation of the same parameters of the patient 2506, which are different from Figure 11 by the lack of synchronicity of the P and PQ parameters of starting the cardiac cycle, which is the reason for the presence of a large number of the Fourier spectra (18) for this patient.
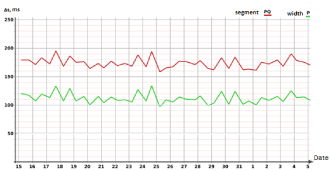
    Figure 11:  Typical synchronous fluctuations of the dynamics of the P wave
width and PQ segment observed in the vast majority of people, Vert the axis
of milliseconds. Horiz, Axis - days.
On the basis of profound analysis of the ECG database, collected daily from thousands of patients in the CardioCVARK project, with the use of tools developed for digging into the data in this project, a hypothesis can be put forward that does not contradict on the one hand the basic postulates of mathematical cardiology, and on the other hand, offering a mathematical model of the unusual behavior of the patient’s heart 2506.
Hypothesis
Earlier studies have shown that the electrical activity of the heart can be described in the framework of the FPU auto-recurrence [2]. Fourier analysis of the spectra of the ECGs of the patient 2506 allowed to assume that there exists the second leading center in his myocardium that implements the startup of the myocardium with a variable start phase of the myocardium relative to the main phase of the first leading center for triggering the contraction of the myocardium.
The confirming of this hypothesis is the jump-like transition from synphase changes in the functions of the P wave width and PQsegment to antiphase ones, as can be seen in Figure 12. That reflects the change in launching conditions of the process of the myocardium contraction in time. As a result, the heart of the patient 2506 can be not only in the usual conditions-in the form of the spectrum (Figure 4) and in the form of spectrum (Figure 2), but due to the presence of an additional leading center, in 18 basic and a set of transient States (Figure 5,6, Rice 7,8,9,10).
Moreover, no anatomical pathologies in the heart of the patient 2506 were detected, and his heart was recognized by cardiologists to be of a sporting type.
And its singularity is manifested only in the presence of a variety of variants of myocardial launch, generated by the presence of interaction between the two leading launching centers.
Mathematical model
Mathematical analysis of interacting self-oscillating systems with a time lag [4] showed that both synphase and antiphase modes of oscillations are regular modes of dynamics in such coupled systems. In (Figure 13) the synphase (upper graph) and antiphase (middle graph) in two interacting self-oscillating systems with time lag [4], are shown (Figure 13). Synphase (upper graph) and anti-phase (middle graph) graphs of amplitudes of two interacting self-oscillatory systems with time lag. The lower graph shows the ratio of frequencies in the systems [4].
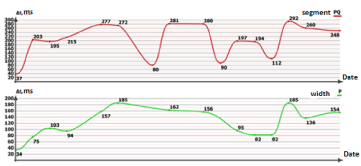
    Figure 12:  Synchronous and asynchronous fluctuations of the dynamics of
the P wave width and the PQ segment observed in the patient 2506. Vert,
Axis-milliseconds. Horiz, Axis - days.
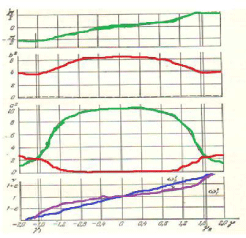
    Figure 13:  Synphase (upper graph) and anti-phase (middle graph) graphs of
amplitudes of two interacting self-oscillatory systems with time lag. The lower
graph shows the ratio of frequencies in the systems.
ECG patterns can also be in synphase and antiphase positions, as can be seen on patient’s 2506 ECG patterns (Figure 14).
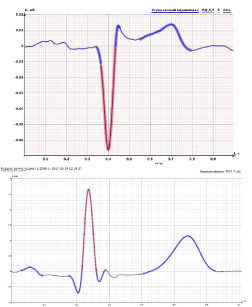
Figure 14: Synphase and antiphase patterns of the ECGs of the patient 2506.
Therefore, it can be assumed that in the dynamics of cardiac activity can also be a variety of modes of myocardial contractions triggering, leading to the splitting of the ECG pattern and forming of 18 clusters of different types of Fourier spectra of the patient’s ECG representations.
To simulate the proposed hypothesis, the previously proposed mathematical model [2] of the electrical activity of the heart was used in the form of two coupled Van der Pol equations with a time lag, in which a third-party modulation of the basic frequency of contractions with a variable phase shift in relation to the basic frequency was introduced. External modulation simulates the presence of a second myocardial trigger. Analysis of the modified mathematical model [2] showed that the introduction of external modulation, as a simulation of the presence of the second leading center of myocardial trigger, leads to the development of unusual model ECG forms, qualitatively corresponding to the unusual ECGs of the patient 2506.
Examples of model split ECG patterns and their Fourier spectra
During the computer study of the modified model, the patterns of the split ECG qualitatively corresponding to the split forms of ECG observed in the studied patient were obtained.
Figure 15,16 simulate the case of simple splitting of the patient’s 2506 ECG (Figure 5,6)
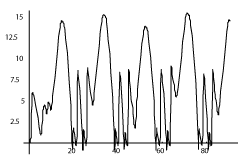
Figure 15: Model of simple splitting of the ECG pattern. Conditional units.
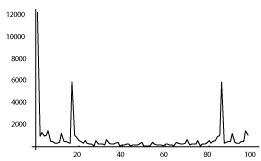
    Figure 16:  The Fourier spectrum of a simple model of the split pattern of the
ECG. Conditional units.
Figure 17-22 model cases of a complex form of splitting of an ECG of the patient 2506 (Figure 7-10).
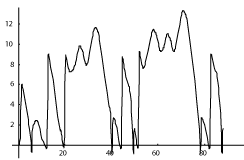
    Figure 17:  Model of the complex splitting pattern of the ECG. Conditional
units.
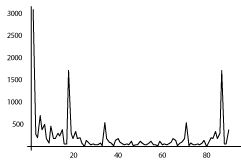
    Figure 18:  Fourier spectrum of the model complex splitting of the ECG
pattern. Conditional units.
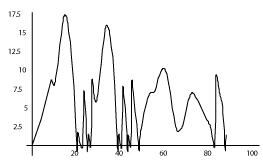
    Figure 19:  Model of interaction of several types of ECGs corresponding to
different clusters. Conditional units.
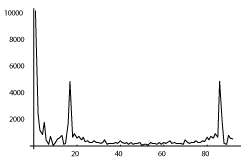
    Figure 20:  Fourier spectrum of the interaction model of several types of
ECGs corresponding to different clusters. Conditional units.
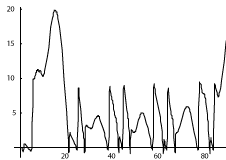
    Figure 21:  Model of jump-like transition between two types of ECGs.
Conditional units.
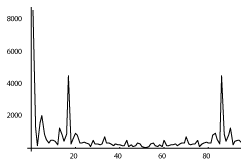
    Figure 22:  The Fourier spectrum of the model is the abrupt transition between
the two types ECG. Conditional units.
Discussion
During the research it was shown that analogs of the types of dynamics existing in nonlinear distributed physical systems are observed in the functioning of the heart as well. In particular, the splitting of the ECG pattern corresponds to the presence of an additional leading center in the myocardium, the phase of oscillations of which is variable in relation to the basic frequency of the heart contractions. The study of a mathematical model with an additional leading center made it possible to conclude that its functioning causes a decrease in the frequency of contractions (bradycardia). Working with a mathematical model, made it possible to obtain model images of the main types of split ECGs corresponding to the various clusters found.
The following patient’s 2506 information should also be noted. At the age of 16 (in 1962), at the peak of sports uniforms in rowing, he was examined by sports cardiologists. The morning ECG showed a pulse of 45 beats and the presence of extra systoles. However, the study on Bicycle Ergometer showed that when applying the average load on heart, the extra systoles disappear and the patient was able to withstand extreme loads. For example, a sit-29 times in thirty seconds with weights of 50 kilograms.
Thus, the studied types of split ECGs of patient 2506 and their Fourier representations indicate the existence in the myocardium of the patient’s congenital additional leading center of contractions, the energy of which was increased due to intensive sports training of the patient during his sports. This leads to the conclusion that this type of split ECG can be attributed to the number of rare, but normal modes of functioning of the heart.
Moreover, the above mentioned allows to conclude that the presence of bradycardia in children may be an indication of their potential ability for active sports.
References
- Alexander V Ezhkov, Roman V Isakov, Olga V Sountsova, Sergey P Sadovskiy. Diagnostic capabilities of CardioQVARK new cardiac monitor. “Research Journal of Pharmaceutical, Biological and Chemical Sciences”. 2016; 7.
- Novopashin MA, Shmid AV, Berezin AA. Fermi-Pasta-Ulam auto recurrence in the description of the electrical activity of the heart. Medical Hypothesis. 2017; 101: 12-16.
- Kalinin VI, d Gerstein GM. Introduction to Radio physics State publishing house of technical and theoretical literature M. 1957; 660.
- Rubanik Vp. Oscillations of quasilinear systems with a time lag. M Science. 1969; 288.
Citation: Shmid AV, Novopashin MA, Zimina EY and Berezin AA. Splitting of the ECG Pattern is Not only a Sign of Possible Myocardial Infarction or Cardio Pathology, But one of Many Possible Normal States of the Nonlinear Dynamics of the Heart as Well. Austin Cardio & Cardiovasc Case Rep. 2018; 3(1): 1021.