
Research Article
J Cardiovasc Disord. 2014;1(1): 6.
The Mechanism of ATP Synthesis in Reactions Initiated by Adding in Vivo Levels of O2 to Mitochondria Already Charged with ADP
Baltazar D Reynafarje*
Department of Biological Chemistry, Johns Hopkins University, USA
*Corresponding author: Baltazar D Reynafarje, Department of Biological Chemistry, Johns Hopkins University, Wolfe Street, 410 Worthington Street, Marco Island FL 34145-5042, Baltimore, USA
Received: August 16, 2014; Accepted: September 11, 2014; Published: September 15, 2014
Abstract
Background: The exact mechanism of ATP synthesis is not yet known.
Methods: The oxidative phosphorylation processes of O2 consumption and ATP synthesis were simultaneously determined in reaction initiated by adding in vivo levels of O2 to fully reduced forms of heart and liver mitochondria.
Results: The following novel facts were found. Net synthesis of ATP only occurs during the respiratory process in which cytochrome aa3 undergoes net oxidation. The exergonic processes of electron flow and O2 reduction to water drive the endergonic process of ATP synthesis. The hyperbolical process of O2 consumption precedes the sigmoidal process of ATP synthesis. The amount of O2 involved in the process of ATP synthesis is not at all affected by the level of ADP. The KMKM of cytochrome aa3 for O2, i.e. the concentration of O2 required for half maximal rates of O2 consumption is close to 30 μM. Maximal rates of O2 consumption and ATP synthesis are orders of magnitude higher in the presence of in vivo levels of O2 than in the presence of 230 μM O2 under state-3 metabolic conditions. The ATP/O ratio is not constant but changes from near zero to 3.4 exquisitely depending on the redox potential (ΔEh) and the relative concentrations of cytochrome aa3, O2, and ADP. The amount of O2 consumed during the process of ATP synthesis attains maximal values at an O2/cytochrome aa3 ratio of about 10. The phosphorylation potential (ΔGp) is a function of the O2/cytochrome aa3 ratio. There is a "limitation" in the ejection of vectorial H+ that only occurs during the ensuing processes of cytochrome aa3 reduction, ATP hydrolysis and slow phase of O2 consumption.
Conclusion: The free energy of the respiratory processes of electron flow and O2 reduction drives the phosphorylative process of ATP synthesis by inducing conformational changes at the levels of the cytochrome aa3 and ATP synthase.
Keywords: SMP: Sub-Mitochondrial Particles; ΔGp: Phosphorylation Potential; ΔEh: Redox Potential; Δp: Proton Motive Force
Methods
Materials
Cytochrome c oxidase from bovine heart, Rat Liver Mitochondria (RLM), and Sub-Mitochondrial Particles (SMP) were prepared as described [1,2]. The standard reaction mixture, at 25oC, contained 200 mM sucrose, 50 mM KCl, 10 mM Na-KPi, pH 7.05, 2 mM MgSO4, 5.0 μl of a mixture of luciferin/luciferase (a product of Bio Orbit, dissolved in 5.0 ml of standard medium), and either 3 mM NADH, 10 mM succinate or 100 μM cytochrome c plus 10 mM ascorbate.
Equipment
A Luminometer made by Man-Tech Associates. Inc. was used to detect the presence of ATP in reaction mixtures. A fast responding O2 electrode, a pH electrode and its reference electrode were fitted inside the airtight-closed chamber of the luminometer to determine the polyphasic processes of O2 uptake, H+ translocation, and ATP synthesis [3-5]. A stirring devise placed at the bottom of the chamber was used to mix the components of the medium. The electrical outputs of all, luminometer, fast responding O2 electrode and pH electrode were fed into a multi-channel recorder running at a rate of 2 cm/second.
Calibrations
The extent of ATP synthesis was calculated by comparing the recorded size of the trace with a standard curve prepared by adding from 0.001 to 100 μ? ATP to standard reaction mixtures containing either isolated cytochrome aa3 or heat-denatured forms of mitochondria [6]. A plot of the intensity of light emission versus ATP concentration resulted in a straight line that intercepted the coordinates at the near origin. The very small fraction of ATP used by the luciferin/luciferase reaction during the process of light emission was insignificant under current experimental conditions [7]. The rates of ATP synthesis were determined during the steepest portion of the sigmoidal process of ATP synthesis [5]. The amount of O2 consumed was determined by subtracting the amount of O2 consumed at any point of the reaction from the amount of O2 added and comparing the size of the trace with the size of a standard curve obtained by adding O2 to anaerobic standard-reaction mixtures [8]. The phosphorylation potential (ΔGp) was evaluated by determining the difference between the ratio of products and substrates at the beginning and at the equilibrium of every reaction [9]. Thus, in the following equation:
ΔGp = RT ln [ATP]a [S]b/[ADP]c [Pi]d [O2]e [SH2]f - RT ln Keq.
S and SH2 represent, respectively, the oxidized and reduced forms of the respiratory substrates. The coefficients of ATP, S, ADP, PI, O2, and SH2 are represented by a, b, c, d and f, respectively. Because the changes in substrate concentration that occur during the actual synthesis of ATP are practically negligible, the value of ΔGp was calculated considering that the SH2/S ratio is 1.0. The standard free-energy changes of NADH oxidation and ATP hydrolysis was considered to be -52.6 and -7.3 kcal/mol, respectively.
Methods
Reactions were initiated by adding mitochondrial preparations into a tightly closed chamber containing standard reaction mixtures in the presence of respiratory substrates and ˜230 μM O2. After a period of incubation of about 25 min, when every trace of O2 and ATP completely disappeared from the medium, the oxidative phosphorylation process was initiated by injecting from 0.10 to 60 μM O2 to anaerobic and fully reduced suspensions of mitochondria. The consumption of O2, the uptake of scalar H+, the ejection of vectorial H+, and the synthesis of ATP were recorded from the first milliseconds to the end of the entire process of oxidative phosphorylation. The possibility of a contamination of the medium with the ATP synthesized by the activity of enzymes such as adenylate kinase or nucleoside monophosphate kinase was discarded because in the absence of O2 there were no traces of ATP [7].
Results
Kinetic and thermodynamic correlation between O2 consumption and ATP synthesis
Figure 1 shows the simultaneously determined processes of O2 consumption and ATP synthesis in a reaction initiated by adding 2.3 μM O2 to an anaerobic and fully reduced suspension of RLM in the presence of ADP, NADH and succinate. The figure shows the following novel facts. 1) The processes of O2 consumption and ATP synthesis are polyphasic in nature [3-5]. 2) A strict kinetic and thermodynamic correlation between O2 consumption and ATP synthesis only occurs during the fast phase of the respiratory process [5]. 3) The hyperbolical process of O2 uptake (t½ = 0.3 sec) precedes the sigmoidal process of ATP synthesis (t½ = 1.2 sec). The initial phase of O2 consumption has a t½ of ˜0.3 sec and precedes the sigmoidal phase of ATP synthesis. 4) The amount of O2 consumed during the net synthesis of ATP (1.71 nmols) is close to 53% of the amount of O2 consumed in the entire reaction. 5) The initial rate of O2 consumption is higher than 1,700 nmols O min-1 mg of protein-1. 6) The fastest rate of ATP synthesis is close to 750 nmols min-1 mg protein-1. 7) The net synthesis of ATP ceases the moment in which the extremely fast phase of O2 consumption ceases and the ensuing processes of ATP hydrolysis and slow phase of O2 consumption begin. 8) The ATP/O ratio changes from near zero to a maximum of 0.7 sigmoidally depending on the initial concentration of O2.
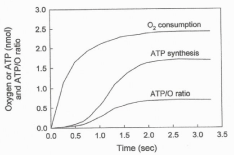
    Figure 1:  The processes of O2 consumption and ATP synthesis are
polyphasic in nature. The consumption of O2 and the synthesis of ATP were
simultaneously determined in a reaction initiated by adding 4.6 nmols of O
(2.3 μM O2) to a fully reduced suspension of RLM (0.15 mg of protein) in
the presence of 300 nmols of ADP and 5 mM of each NADH and succinate.
Effect of ADP concentration on the amount of O2 directly involved in the process of ATP synthesis
Data presented in Figure 2 show that the amount of O2 consumed during the process of ATP synthesis is not at all affected by the level of ADP. Thus, in reactions catalyzed by homogenates of whole liver, the amount of O2 consumed during the actual synthesis of ATP (first phase of the respiratory process) is exactly the same in the presence or absence of externally added ADP. The hyperbolical phase of O2 consumption increases from 0.22 to 7.9 nmols O2 whether the concentration of ADP is close to zero or 250 μM. Distinctly, the extent of ATP synthesis increases from 0.22 to 9.4 nmols in the presence of 250 nmols of ADP, and from 0.001 to 0.16 nmols in the only presence of endogenous ADP (<2.3 μM). The ATP/O stoichiometry increases from 0.003 to 0.02 in the presence of endogenous ADP and from 0.91 to 1.2 in the presence of 250 μM ADP.
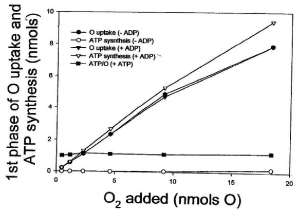
    Figure 2:  The concentration of ADP has absolutely no effect on the amount
of O2 consumed during the actual process of ATP synthesis. Reactions
were initiated by adding from 0.46 to 18.4 nmols of O (0.23 to 9.2 μM O2) to
homogenates of Pig liver (10 mg of protein) in the presence of 5 mM NADH,
10 mM succinate and either less than 2.3 nmols of endogenous ADP or 250
nmols of externally added ADP. The extent of ATP synthesis was calculated
at the end of the hyperbolical phase of O2 consumption (see Figure 1).
The KM of cytochrome aa3 for O2 is close to 30 μM
The results presented in Table 1 and Figure 3 provide experimental evidence that, regardless of the ΔEh, the form of mitochondria (SMP or homogenates of whole tissues) and the initial concentrations of O2, the half maximal rate of O2 consumption is close to 30 μM, not below 0.5 μM [10]. Differently, the maximal rates (Vmax) of O2 uptake vary sensitively depending on all these factors. Thus, Figure 3. shows that the Vmax of O2 consumption is 100 μmol min-1 mg-1 of protein in reactions catalyzed by SMP (upper line) and 333 μmol min-1 mg-1 of protein in reactions catalyzed by liver homogenates (lower line).
    O2 added (nmoles  O)
    Liver homogenates                                   Sub-mitochondrial particles


    mmol min-1 mg-1 protein)


    0.23
    3.509


    0.575
    8.475


    1.15
    16.667
    6.02


    2.00


    2.30
    32.258


    2.50

    7.41


    4.6
    58.824


    5.0

    13.69


    7.5

    19.61


    9.2
    83.33


    10.0

    24.39


    20.0

    38.46
Table 1:  Correlation between O2 concentration and rates of O2 consumption.
Reactions were catalyzed by either 10 mg protein of homogenates of Pig liver
or 0.1 mg protein of SMP in the presence of 5 mM NADH and 10 mM succinate.
The rates of O2 consumption were determined during the initial and hyperbolical
phase of O2 consumption. Values are averages of at least 2 determinations
performed in the presence or absence of externally added ADP.
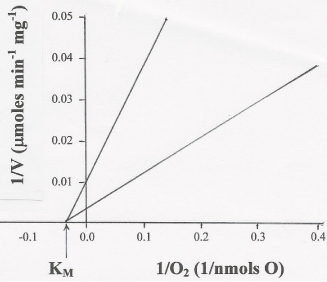
    Figure 3:  The KM of cytochrome aa3 for O2 is close to 30 μM. The KM of
O2 consumption was determined by double reciprocal plots of the rates
of O2 consumption versus the initial concentration of O2 (see Table 1), in
reactions catalyzed by either 0.1 mg of SMP protein (upper line) or 10 mg of
homogenates of whole liver (lower line) in the presence of 5 mM NADH, 10
mM succinate, and the absence or presence of externally added ADP (250 nmols ADP).
Effect of the redox potential and the initial concentrations of O2 and ADP on the rates of ATP synthesis
Data in Figure 4 show that the rates of ATP synthesis, in reactions catalyzed by RLM, increase exponentially depending on the ΔEh (NADH or cytochrome c oxidation) and the initial concentrations of ADP (25 or 100 μM) and O2 (0.46 to 12.5 μM). It is remarkable, however, that the rates of ATP synthesis are higher in the exclusive presence of cytochrome c and high levels of ADP than in the presence of NADH and low levels of ADP.
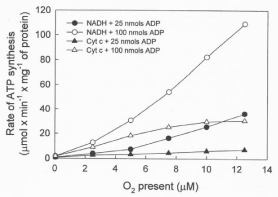
    Figure 4: The rates of ATP synthesis depend on the degree of reduction of
the mitochondrial membrane, the ΔEh, and the initial levels of O2 and ADP.
The rates were determined during the steepest portion of the sigmoidal
process of ATP synthesis (see Figure 1) in reactions initiated by adding from
0.5 to 12.5 μM O2 to RLM (0.15 mg protein) in the presence of either 25 or 50
nmols of ADP, 5 mM NADH or 100 μM cytochrome c plus 10 mM ascorbate.
Effect of the relative concentrations of O2 and cytochrome aa3 on the amount of O2 consumed during the process of ATP synthesis
Data in Figure 5 show that the ATP/O ratio is not constant, as currently believed [11-14], but increases from 0.1 to 3.4 intricately depending on the ΔEh (NADH or cytochrome c oxidation) and initial levels of O2 (0.23 to 15 μM) and ADP (25 or 100 μM). It is also remarkable that under low in vivo levels of O2 the ATP/O ratio can be up to 10 times higher in the exclusive presence of cytochrome c and high levels of ADP (100 μM) than in the presence of NADH and low levels of ADP (25 μ?). At high levels of both O2 and ADP, however, the ATP/O stoichiometry can be close to 2.4 times higher in the presence of NADH than in the presence of cytochrome c.
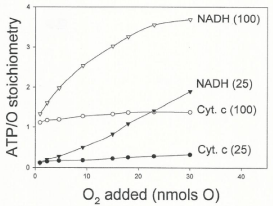
    Figure 5: The ATP/O stoichiometry changes depending on all, ΔEh and initial
levels of O2 and ADP. The ATP/O ratio was evaluated by simultaneously
determining the extents of ATP synthesis and O2 consumption at the moment
in which both the hyperbolical process of O2 consumption and the sigmoidal of
ATP synthesis cease. The experimental conditions were like those described
for Figure 4.
Effect of the relative concentrations of O2 and cytochrome aa3 on the amount of O2 consumed during the process of ATP synthesis
Figure 6 shows the effect of the relative concentrations of O2 and cytochrome aa3 on the extents of O2 consumption and H+ uptake that occur during the process of ATP synthesis. The extents of O2 and H+ uptake were measured at the end of the hyperbolical phase of O2 consumption (see Figure 1) in oxygen-pulse experiments initiated by adding from 0.23 to 30 μM O2 to fully reduced suspensions of isolated cytochrome aa3 (0.2 to 2.3 nmols) embedded in liposomes. Maximal values of O2 and H+ uptake are only attained in a small range of O/ cytochrome aa3 ratios. At any O/cytochrome aa3 ratio lower or higher than 20 the extents of both O2 and H+ uptake are greatly impaired. The H+/O uptake-ratio, however, remains constant and equal to 2.0. The mechanistically significance of these findings is discussed.
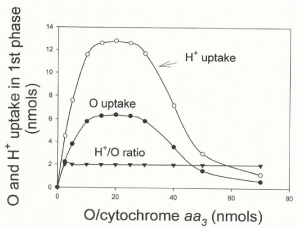
    Figure 6: Maximal rates and extents of O2 and H+ uptake are limited by the
relative concentrations of O2 and cytochrome aa3 ratio. Extents of O2 and
H+ uptake were determined during the hyperbolical phase of O2 uptake in
reactions initiated by adding from 2.76 to 18.4 nmols of O (1.38 to 9.4 μM O2)
to fully reduced suspensions of isolated cytochrome aa3 (0.2 to 2.3 nmols)
embedded in liposomes in the presence of 10 mM ascorbate and 60 μM
cytochrome c plus 10 mM ascorbate.
Effect of the relative concentrations of O2 and cytochrome aa3 on the level of ΔGp
Data in Figure 7 show that the ΔGp increases from 12.39 to 15.1 kcal per mol when the concentration of protein is low (0.1 mg) and from only 11.6 to 12.8 kcal per mol when the level of protein is high (0.9mg) and the O2/protein or O2/cytochrome aa3 ratio is reduced. It is also significative that, even at low levels of ADP (10 μM), the level of ΔGp is higher in the exclusive presence of cytochrome c and high O2/cytochrome aa3 ratios than in the presence of NADH and low O2/ cytochrome aa3 ratios. Undoubtedly, the O2/cytochrome aa3 ratio plays a fundamental role in the process of ATP synthesis.
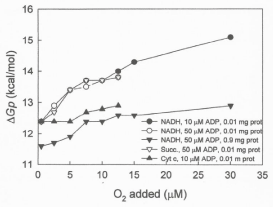
    Figure 7: The level of ΔGp is mainly controlled by the O2 per cytochrome aa3
ratio. The ?Gp was determined in reactions initiated by adding from 0.23 to 30
μM O2 to frozen/thawed and inverted vesicles from SMP (0.01 or 0.9 mg) in
the presence of each 5 mM NADH, 10 mM succinate or 100 μM cytochrome
c plus 10 mM ascorbate, supplemented with either 10 or 50 nmols of ADP.
Kinetic and thermodynamic correlation between H+ ejection and ATP synthesis
Data in Figure 8 show the time course of the oxidative phosphorylation processes of ATP synthesis, H+ ejection, O2 consumption, and cytochrome aa3 oxidation in reactions initiated by adding 4-6 μM O2 to fully reduced suspensions of RLM in the presence of NADH and 50 μM ADP [5]. The extent of H+ ejection is neither kinetically not thermodynamically related to the process of ATP synthesis. The ejection of H+ continues during the slow phase of O2 consumption, the net hydrolysis of ATP and net reduction (not oxidation) of cytochrome aa3. In fact, data presented in Table 2 show that, in reactions catalyzed by fully reduced cytochrome aa3 embedded in liposomes, the extent of H+ ejection decreases from 27.6 to 2.4 when the O2/cytochrome aa3 ratio increases from 15.9 to 250. Indeed, the process of H+ ejection depends on the state of reduction cytochrome aa3, maintaining a constant H+/cytochrome ratio of ˜12.
    Cytochrome aa3   (nmols)
    O/cytochrome aa3 (ratio)
    H+ ejection  (nmols)
    H+/O ejection  (ratio)
    H+/cytochrome aa3  (ratio)


    0.20
    250
    2.4
    0.06
    12.0


    0.60
    62.5
    7.2
    0.19
    12.0


    1.20
    30.0
    14.4
    0.39
    12.0


    2.30
    15.9
    27.6
    0.75
    12.0
Table 2:  Correlation between maximal ejection of vectorial H+ and relative
concentrations of O2 and cytochrome aa3.
Reactions were catalyzed by adding in vivo levels of O2 to fully reduced
suspensions of cytochrome aa3 embedded in liposomes. The maximal extent of
H+ ejection was determined at the end of every reaction. Values are average of
at least 2 experiments.
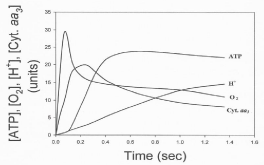
    Figure 8: Time courses of the processes of H+ ejection, O2 consumption,
cytochrome aa3 oxidation and ATP synthesis. Reactions were initiated by
adding 9.2 nmols O to fully reduced samples RLM (3.5 mg protein) in the
presence of 5 mM NADH and 50 μM ADP. Every unit in the y-axis represents
0.24 nmols of O, 3.37 nmols of H+ ejection, 0.186 nmols of ATP, and a ΔA of
1.2 x 10⁻⁴ at 606-630 nm.
Discussion
The consensus is that the respiratory process of O2 consumption and the phosphorylative of ATP synthesis maintain a constant and strict kinetic and thermodynamic correlation [10-16]. Thus, the process of ATP synthesis is often evaluated by exclusively determining the consumption of O2 that occurs after the addition of ADP to mitochondrial suspensions in the presence of abnormally high levels of O2 [12,13]. In classic oxygen-pulse experiments [17], however, the first phase of O2 consumption, which is directly related to the actual synthesis of ATP, has been always discarded erroneously assuming that represents an "experimental artifact". By simultaneously determining the processes O2 consumption and ATP synthesis under in vivo levels of O2 [18], we found that these two processes have the following mechanistically significant characteristics.
- The entire process of oxidative phosphorylation is polyphasic in nature [3-5].
- A strict kinetically and thermodynamically correlation between ATP synthesis and O2 consumption only occurs during the initial and extremely fast initial respiratory process in which cytochrome aa3 undergoes net oxidation [6,19].
- The sigmoidal process of ATP synthesis follows the hyperbolical phase of O2 consumption (see Figure 1)
- Contrary to the idea that "electrons do not flow from fuel molecules to O2 unless ATP needs to be synthesized" [12], data in Figure 2 show that the level of ADP (near zero to 250 μM) does not modify the process of O2 consumption that is directly involved in the net synthesis of ATP [5].
- Regardless of the form of mitochondria (whole cells, intact mitochondria or SMP), the ΔEh, and the initial concentrations of O2 and ADP, the KM of cytochrome aa3 for O2 is close to 30 μM (see Table 1 and Figure 3). Indeed, under close to in vivo conditions [18] the real KM of cytochrome aa3 for O2 can only be determined under strict kinetics of first order. Since 1956, however, when Briton Chance determined the KM of cytochrome aa3 for O2 by determining half maximal rates of O2 consumption at the end of a respiratory process initiated in the presence near 230 μM O2 it is firmly believed that the KM of cytochrome aa3 for O2 is between 0.5 and 0.05 μM. If these values were true, humans would have no problem in respiring and generating ATP under the hypoxic conditions of high altitudes. In reality the rates of O2 consumption are greatly impaired at any concentration of O2 that is higher or lower than 30 μM (see Table1 and Figures 3 and 6).
- The actual rates of ATP synthesis are orders of magnitude higher than those observed under classic state-3 metabolic conditions [10]. It is mechanistically significant that the rates of ATP synthesis are higher in the exclusive presence of cytochrome c and high levels of ADP than in the presence of NADH and low levels of ADP. Evidently, at high initial concentrations of ADP, the oxidation of cytochrome aa3 takes precedence over the oxidation of NADH. Obviously, conformational changes occurring at the level of the cytochrome oxidase are essential in the process of ATP synthesis.
The ATP/O stoichiometry normally changes from near zero to 3.4. To this day it is firmly believed that the ATP/O stoichiometry is a constant the value of which only depends on the &DeltaEh [10-15]. Data in Figure 5 provide experimental evidence that the ATP/O ratio is not constant but varies from near zero to 3.4 intricately depending on &DeltaEh and the initial concentrations of O2 and ADP. It is also remarkable that at low in vivo levels of O2 [18] the ATP/O ratio is much higher in the exclusive presence of cytochrome c and high levels of ADP than in the presence of NADH and low levels of ADP. Considering that the ATP/O ratio was constant [15,20,21] it was stated that the "cell energy cycle may turn over at rest as much as half an adult's body weight in ATP per day, and many times more during physical exercise or work. If this assertion were consistent with facts, the efficiency of the cell to synthesize ATP would be abnormally low. It is obvious that under absolute resting conditions (profound sleep for example), when the level of ADP is minimal, the ATP/O ratio is greatly reduced and just enough to maintain the homeostasis of the cell. Distinctly, under strenuous physical exercise, when the mitochondria are nearly anaerobic and highly charged with ADP, the binding of O2 to fully reduced cytochrome aa3 induces a maximal ATP/O ratio.
- The O2/cytochrome aa3 ratio controls the processes of O2 consumption and ATP synthesis. The current concept of "respiratory control" is that the level of ADP controls the extent and rates of O2 consumption [12,13]. In reality the processes of O2 consumption and ATP synthesis are exquisitely controlled not by the level of ADP but by the O2/cytochrome aa3 ratio. Net synthesis of ATP only occurs at an O/cytochrome aa3 ratio of near 20. At any O/cytochrome aa3 ratio lower than 20 the rates of ATP synthesis are limited by a deficiency in O2 concentration. At any O/cytochrome aa3 ratio higher than 20 the rates of O2 uptake and ATP synthesis are impaired by the excess of O2 and oxygen radicals (see Figure 6).
- The phosphorylation potential (Gp) is an exquisite function of the O/cytochrome aa3 ratio. Data in Figure 7 demonstrate that in the absence of a proton gradient and regardless of ΔEh and ADP concentration, the ΔGp is a sensitive function of the O/protein or O/cytochrome aa3 ratio. It is also mechanistically significant that at high levels of O2/cytochrome aa3 ratios the Gp is higher in the exclusive presence cytochrome c than in the presence of NADH. Actually the O2/cytochrome ratio is the most important factor in determining the extent and rates of ATP synthesis. In fact it was described that chemoreceptors and reflexes in respiration control the phosphorylative process of ATP synthesis [22].
The vectorial ejection of H+ is neither kinetically nor thermodynamically related to the process of ATP synthesis. Data presented in Table II and Figure 8 provide experimental evidence that the vectorial ejection of H+ follows rather than precedes the oxidation of cytochrome aa3, the fast phase of O2 consumption and the net synthesis of ATP [5]. The actual process of H+ ejection is a function of the extent of reduction of cytochrome aa3 in such a way that the H+/ cytochrome aa3 is a constant equal to about 12.
Knowing that the free energy of electron flow is directly involved in the conformational changes that occur at the level of the cytochrome aa3 and γ and β subunits of the ATP synthase [23,24], the hypothetical scheme in Figure 9 was depicted illustrating the following facts. The flow of electrons induces the counterclockwise rotating the γ subunit that is tightly coupled to the clockwise rotation of the β subunit of the ATP synthase. Distinctly, during the hydrolysis of ATP, which does not depend on the free energy of electron flow, the clockwise rotation of the γ subunit is not coupled to the β subunit that rotates in counterclockwise direction coinciding with the reduction of cytochrome aa3.
Figure 9: Hypothetical scheme showing the reverse rotation of the γ & β sub-units of the ATP synthase during the processes of ATP synthesis and ATP hydrolysis.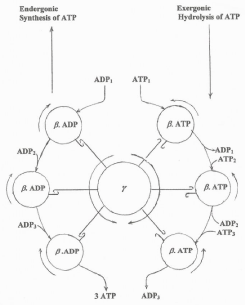 Figure 9: Hypothetical scheme showing the reverse rotation of the γ & β sub-units of the ATP synthase during the processes of ATP synthesis and ATP hydrolysis.
The validity of this study is confirmed by the novel findings that the rates of ATP synthesis in guinea pigs native to high altitudes are higher than in those from sea level [25] and that the rates of synthesis are lower in cancer derived AS30D hepatocytes than in normal hepatocytes (unpublished observations).
References
- Hendler RW, Pardhasaradhi K, Reynafarje B, Ludwig B. Comparison of energy-transducing capabilities of the two- and three-subunit cytochromes aa3 from Paracoccus denitrificans and the 13-subunit beef heart enzyme. Biophys J. 1991; 60: 415-423.
- Pedersen PL, Greenawalt JW, Reynafarje B, Hullihen J, Decker GL, Soper JW, et al. Preparation and characterization of mitochondria and submitochondrial particles of rat liver and liver-derived tissues. Methods Cell Biol. 1978; 20: 411-481.
- Reynafarje BD, Davies PW. The polyphasic nature of the respiratory process at the mitochondrial level. Am J Physiol. 1990; 258: C504-511.
- Reynafarje BD. The polyphasic reduction of oxygen to water by purified cytochrome c oxidase. Biochem Biophys Res Commun. 1991; 176: 150-156.
- Reynafarje BD, Ferreira J. Oxidative Phosphorylation: Kinetic and Thermodynamic Correlation between Electron Flow, Proton Translocation, Oxygen consumption and ATP synthesis under Close to In Vivo Concentrations of Oxygen. Int. J. Med. Sci. 2008; 5: 143-151.
- Reynafarje BD, Pedersen PL. ATP synthase. Conditions under which all catalytic sites of the F1 moiety are kinetically equivalent in hydrolyzing ATP. J Biol Chem. 1996; 271: 32546-32550.
- Bourgois JJ, Sluse FE, Baguet F, Mallefet J. Kinetics of light emission and oxygen consumption by bioluminescent bacteria. J Bioenerg Biomembr. 2001; 33: 353-363.
- Reynafarje B, Costa LE, Lehninger AL. O2 solubility in aqueous media determined by a kinetic method. Anal Biochem. 1985; 145: 406-418.
- Segel IH. Relationship between? G and the [P]/[S] Ratio. In Biochemical Calculations 2nd edn. John Wiley & Sons. New York: Chichester, Brisbane, Toronto. 1976; 150-153.
- Chance B. Reaction of oxygen with the respiratory chain in cells and tissues. J Gen Physiol. 1965; 49: Suppl:163-195.
- Lemasters JJ, Grunwald R, Emaus RK. Thermodynamic limits to the ATP/site stoichiometries of oxidative phosphorylation by rat liver mitochondria. J Biol Chem. 1984; 259: 3058-3063.
- Stryer L. The Rate of Oxidative Phosphorylation is determined by the Need for ATP. In Biochemistry. 4th edn. WH Freeman and Company. New York. 1995: 552
- Lehninger AL. Acceptor Control of the Rate of Electron Transport. In Biochemistry 2nd edn. Worth Publishers Inc. New York, USA. 1975: 518-520
- Brand MD. The Stoichiometry of Proton Pumping and ATP Synthesis in Mitochondria. The Biochemist. 1994; 16: 20-24.
- Wilson DF, Erecinska M, Drown C, Silver IA. The oxygen dependence of cellular energy metabolism. Arch Biochem Biophys. 1979; 195: 485-493.
- Chance B, Williams GR. The respiratory chain and oxidative phosphorylation. Adv Enzymol Relat Subj Biochem. 1956; 17: 65-134.
- Mitchell P, Moyle J. Respiration-driven proton translocation in rat liver mitochondria. Biochem J. 1967; 105: 1147-1162.
- Ganong WF. Review of Medical Physiology. In Gas Transport between the Lungs & the Tissues. 16th edn. Appleton & Lange Norwalk. Connecticut. 1993: 604-605.
- Reynafarje B, Ferreira J. Cytochrome c oxidase: the mechanistic significance of structural H+ in energy transduction. J Bioenerg Biomembr. 2002; 34: 259-267.
- Erecinska M, Wilson DF. Regulation of cellular energy metabolism. J Membr Biol. 1982; 70: 1-14.
- Pedersen PL, Amzel LM. ATP synthases. Structure, reaction center, mechanism, and regulation of one of nature's most unique machines. J Biol Chem. 1993; 268: 9937-9940.
- Lahiri S, Forster II RE, Davies RO, Pack AI. Oxygen Modulation of Mitochondrial Energy Transduction. In Chemoreceptors and Reflexes in Breathing: Cellular and Molecular Aspects. Oxford University Press, New York, Oxford. 1989; 175-183.
- Bianchet MA, Pedersen PL, Amzel LM. Notes on the mechanism of ATP synthesis. J Bioenerg Biomembr. 2000; 32: 517-521.
- Kaim G, Dimroth P. ATP synthesis by F-type ATP synthase is obligatorily dependent on the transmembrane voltage. EMBO J. 1999; 18: 4118-4127.
- Reynafarje BD, Marticorena E. Bioenergetics of the heart at high altitude: environmental hypoxia imposes profound transformations on the myocardial process of ATP synthesis. J Bioenerg Biomembr. 2002; 34: 407-412.