Research Article
Austin J Cerebrovasc Dis & Stroke. 2019; 6(1): 1080.
The Effect of Neutrophil-Lymphocyte Ratio on Prognosis in Acute Hemorrhagic Stroke: A Retrospective Study
Tokgöz S¹*, Uca AU¹, Poyraz N², Kozak HH¹, Altaş M¹, Seyithanoğlu A¹ and İyisoy MS³
¹Department of Neurology, Meram Medical Faculty, Necmettin Erbakan University, Konya, Turkey
²Department of Radiology, Meram Medical Faculty, Necmettin Erbakan University, Konya, Turkey
³Department of Medical Education and Informatics, Meram Medical Faculty, Necmettin Erbakan University, Konya, Turkey
*Corresponding author: Serhat Tokgoz, MD, Associate Professor, Necmettin Erbakan University, Meram Medical Facultyl, Neurology, Konya, Turkey
Received: December 10, 2018; Accepted: January 22, 2019; Published: January 29, 2019
Abstract
Objective: The study aim is to evaluate the relationship of short-term mortality with the neutrophil to lymphocyte ratio (NLR) in acute hemorrhagic stroke.
Method: The retrospective study included 106 patients who admitted within 24 hours of AHS. A hemogram (peripheral venous blood sample) was taken at admission. The ratio of neutrophils to lymphocytes was calculated. Thirty days was defined as duration of follow-up. A mortality and survival groups were detected within 30 days.
Results: During the follow-up period, twenty-eight of 106 patients died. The median NLR was significantly higher in the mortality group compared then the survival group (8.87; IQR 10.8 vs. 5.12; IQR 5.3, respectively; p=0.021) as well as a blood glucose level and hematoma volume. In the Cox regression model, NLR was not an independent variable as short-term mortality predictors. The specificity for short-term mortality when the NLR (>7.54) was 71.8%, and the sensitivity was 60.7%. The positive predictive value of a NLR (>7.5) was 43.6%, negative predictive value was 83.6% [Area under the ROC curve, 0.647; 95% CI, 0.548-0.738]. A weak linear positive correlations were found between NLR and National Institutes of Health Stroke Scale (NIHSS), and negative correlation between NLR and Glaskow Coma Score (GCS) (r=0.281; p=0.004, r=-0.283; p=0.002, respectively).
Conclusions: The NLR at admission is significantly higher in mortality group than survival group, but it has lower sensitivity and specificity for shortterm mortality than acute ischemic stroke. NLR may be important to follow short-term mortality, but it can be affected by dependents variables such as hematoma volume.
Keywords: Mortality; Neutrophil lymphocyte ratio; Stroke; Hemorrhage
Introduction
Stroke has an inflammatory process that causes blood-brain barrier damage, endothelial activation, the infiltration of platelets and leukocytes, and inflammatory and oxidant mediator accumulation [1,2]. So many studies related to white blood cells (WBCs) and its subtypes have been conducted in acute ischemic cardiac and cerebral diseases.
Local inflammation affects on the penumbra area, which aggravates brain injury. Neutrophils are the first leukocytes to migrate from peripheral blood into the brain within the first hours after acute hemorrhagic stroke (AHS) and promote secondary injury. Lymphocytes represent the protective or regulatory component of inflammation [3,4].
Recently, it has found that neutrophil-lymphocyte ratio (NLR) is a predictive factor of mortality in acute ischemic stroke and acute myocardial infarction [5-8]. A parenchymal inflammation may be one of the reasons for the increased damage in AHS [9]. However, the prognostic effect of NLR is unclear in AHS.
The value of NLR for predicting 30-day mortality in patients with supratentorial AHS is evaluated in this study.
Methods
The study is a hospital-based retrospective study. One hundred thirty five patients with AHS (>18 years of age) were screened between January 2008 and December 2016. The study included AHS patients who were admitted within the first day. The local ethic committee approved this study protocol.
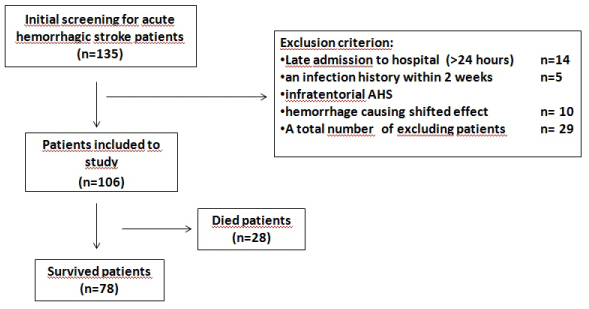
Exclusion criteria; patients admitted to the hospital >24 hours after AHS, an infection history within two weeks, malignancy and immunosuppressant drug history, hematologic disorders acute ischemic infarction, infratentorial AHS, and hematoma causing shifted effect (Figure 1).

Figure 1: Flow chart of the study.
Study protocol
The International Classification of diseases, 10th revision codes “I 61.0-2” from the hospital’s database were used in all cases. 106 patients met the criteria. The clinical and demographic characteristics of 106 patients were obtained from the patient’s archived records to evaluate mortality, Glasgow Coma Scale (GCS) and National Institutes of Health Stroke Scale (NIHSS). Hospital mortalities of patients were detected according to the hospital records. Patients, who discharged from hospital before 30 days, were questioned whether or not the mortality is present by the telephone. Nonhospital mortality was not detected. Twenty-nine patients were excluded from this study (Figure 1).
Blood sample analysis
The peripheral venous blood samples, which are taken on admission, were used for a hemogram analysis. A calcium ethylenediaminetetraacetic acid (EDTA) tube was used for blood sample collection. Blood samples were examined using an auto analyzer (Abbott Cell-DYN Ruby Hematology Analyzer, Lake Farest, Illinois). The ratio of neutrophils to lymphocytes (NLR) was calculated.
Image acquisition and analysis
All measurements were performed using a 64-MDCT scanner (Siemens Healthcare, Somatom Sensation 64) and the following parameters: slice thickness, 3mm; gantry rotation time, 0.5 second; pitch, 2.0; 120kVp; and 180mAseff. Scans were obtained without contrast material.
CT image analysis was performed by one radiologist on a PACS workstation using software (Enlil PACS Viewer, Eroglu, Eskisehir, Turkey). The hemorrhage volumes were calculated on axial CT images. The formula AxBxC/2 (mL) was calculated (A; the greatest hemorrhage diameter by CT, B; the diameter 90° to A, and C; is the approximate number of CT slices with hemorrhage.
Statistical analysis
SPSS software (version 15.0; SPSS Inc, Chicago, IL) was used in data analysis. Kolmogorov-Smirnov test was used for normality. Mean± standard deviation and Student-t test for normally distributed variables or median (interquartile range, IQR) and The Mann- Whitney U test for the other variables were used. The Chi-squared test was used to evaluate the difference between categorical variables. Spearman correlation test for linear correlation was used. Cox regression analysis was applied to determine the predictor factors of 30-day mortality. Glucose level, NLR and hemorrhage volume were included in this regression model. Receiver-operating curve (ROC), sensitivity, specify, and positive and negative predictive values of NLR for the mortality were obtained by using a medCalc 12.7.0 (MedCalc Software Acacialaan 22, B-800 Ostend, Belgium) packet program. Kaplan-Meier analyses were obtained by SAS University Edition 9.4 (SAS Institute, Cary, NC, USA).
Results
The mean age of the 106 patients was 66.28 ± 14.9. The mortality rate was 26.4% (n=28) by 30 days of follow-up. Laboratory and demographic data of the mortality and surviving patient groups are reported in Table 1. NLRs (median and IQR) of the mortality group were significantly higher than NLRs of the surviving patient group [8.87 (10.8); 5.12 (5.3), respectively, p=0.021, z=-2.30]. It was found also significant differences in two groups in terms of glucose, GCS, NIHSS, LDL, hemorrhage volume (Table 1).
NLR was not found as an independent predictor factor of mortality in Cox regression analysis contrary to glucose and hematoma volume. Results of the Cox regression model with potential predictors of mortality is displayed in Table 2.
Surviving (n=78)
Dead (n=28)
P value
Z value
Age, (mean sd)
65.38±13,99
68.79±17.3
NS
Sex (F/M)
41/37
13/15
NS
Diabetes mellitus (%)
28.6
NS
Hypertension (%)
67.5
75.0
NS
CAD (%)
15.4
17.9
NS
Smoking (%)
9.0
3.6
NS
Alcohol (%)
2.6
3.6
NS
8.0 (10.0)
18.5 (6.5)
0.001
-5.70
Glaskow coma score
13.5 (4.0)
6.0 (5.0)
0.001
-6.08
Systolic BP, mmHg (mean ±sd)
162.11 (38.8)
176.25 (47.2)
NS
Diastolic BP, mmHg (mean± sd)
92.11 (18.9)
94.16 (19.9)
NS
WBC (103/mL), median (IQR)
10.1 (4.9)
11.5 (6.3)
0.044
-2.01
Neutrophil (103/mL) median (IQR)
7.7 (4.6)
9.1 (5.2)
0.029
-2.18
NLR median (IQR)
0.021
-2.30
Glucose (mg/dL), median (IQR)
120.0 (53.0)
161.5 (103)
0.001
-3.48
Creatinine, mg/dL, median (IQR)
0.8 (0.3)
1.05 (0.8)
NS
Total cholesterol, mg/dL (mean± sd)
188.93 (46.99)
167.71 (44.1)
NS
Triglyceride (mg/dL) median (IQR)
112,00 (403)
81.80 (768)
NS
LDL, (mg/dL) (mean± sd)
124.72(39.1)
102.93 (39.4)
0.045
-2.00
HDL (mg/dL) (mean± sd)
40.74 (10.9)
45.76 (13.9)
NS
Hemorrhage volume (ml) median (IQR)
7.23 (12.0)
17.38 (25.5)
0.009
-2.60
Drugs
Antihypertensive
67.5
75.0
NS
Antidiabetic
26.9
28.6
NS
ASA
12.8
21.4
NS
Abbreviations: ASA: Acetylsalicylic Acid; BP: Blood Pressure; CAD: Coronary Artery Disease; F: Female; HDL: High-Density Cholesterol; LDL: Low-Density Cholesterol; M: Male; NIHSS: National Institutes Of Health Stroke Scale; NLR: Neutrophil to Lymphocyte Ratio; NS: Not Significant; WBC: White Blood Cell.
Table 1: Demographic and laboratory findings of surviving and dead patients.
    Variables
    HR
    95% CI
    P value


    Lower
    Upper


    NLR
    1.014
    0.964
    1.059
    ,538


    Glucose
    1.009
    0.998
    1.02
    ,027


    Volume
    1.028
    0.977
    1.035
    ,038


    Abbreviations: NLR: Neutrophil to Lymphocyte Ratio; Volume; Hematoma volume.
Table 2: Cox regression results for the predictors of mortality.
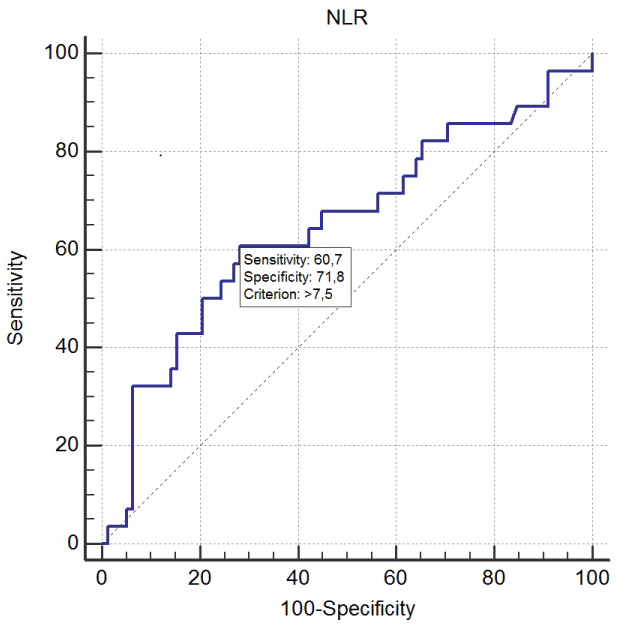
In the ROC curve analysis, 7.54 level was determined as the optimal cutoff value for NLR as a predictor factor of short-term mortality. For 7.54 level, the specificity was 71.8 and the sensitivity was 60.7 (positive predictive value was 43.6%, negative predictive value was 83.6% (Figure 2) [Area under the ROC curve (AUC), 0.647; 95% CI, 0.548-0.738].

    Figure 2:  Receiver operating curve (ROC) curves of NLR to prediction of
mortality in acute PE. Area of under curve, 0.647; 95% CI, 0.548-0.738.
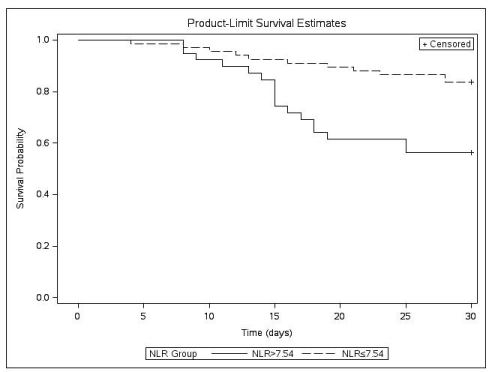
According to the optimal cutoff value for NLR (7.54), the Kaplan- Meier survival curves were different between the mortality and surviving groups (p=0.0016, Chi-square=9.921) (Figure 3).

    Figure 3:  Kaplan-Meier survival estimates for NLR in AHS and a comparison
of survival for NLR according to the ROC cutoff NLR value (7.45).
NLR has slightly positive correlation with NIHSS (r: 0.281, p: 0.004), and slightly negative correlation with GCS (r: -0.283, p: 0.002), unlike the other variables (Table 3).
    Variable
    r value
    p value


    NIHSS
    0.281
    0.004


    GCS
    -0.27
    0.005


    Abbreviations: GCS: Glaskow Coma Score; NIHSS: National Institutes of Health Stroke Scale;    NLR: Neutrophil to Lymphocyte Ratio.
Table 3: A linear relationship between NLR and the other variables.
Discussion
So many factors such as diabetes, hypertension, inflammation, cardiac disease vs. affect the stroke progression and mortality as independent and dependent variables.
In our study, NIHSS, GCS, white blood cell count, neutrophil count, NLR, glucose, and hematoma volume are significantly associated with 30-day mortality in AHS (Table 1).
It is known that NIHSS and GCS are the important scales showing neurologic deterioration and mortality.
A high glucose level is also associated with short-term mortality. Likewise, the abnormal blood glucose level can lead to the increased NLR, indicating long-term inflammation [9]. Luo et al [9] declared that blood glucose level was significantly higher in the mortality group than the surviving group similar to our results. A high glucose level may also be an independent variable on mortality (Table 1,2).
Especially these recent studies have declared that NLR could be a predictive factor of short time mortality in acute ischemic stroke and myocardial infarction [5-8]. But, the effect of NLR on AHS is still unclear.
Some studies have pointed that NLR is an independent risk factor for neurological deterioration [10-12]. Wang F and et al found that NLR at admission is not independent variable for non-surviving group unlike they found that NLR on the next morning following admission is independent variable. In their study, the optimal cut-off value of NLR was 7.35. They found that the higher NLR is related with an increased mortality in ASH patients [12]. But, the next measurement may be affected by so many factors such as the increased hematoma, infections etc.
In our study, NLR is significantly higher in the mortality group than the surviving group (Table 1). We found a weak positive correlation between NLR and NIHSS, and a negative correlation between NLR and GCS (Table 3). We also found that the optimal cut of NLR level (7.54) is similar to Wang F et al. [12], but it has a low sensitivity and specificity. Besides, it is not independent variable to predict 30-day mortality. Sun et al have found that no signification relation was observed between NLR and 3 months mortality [13].
Hemorrhagic volume may be the key factor that affects ASH outcome. Hematoma itself can cause to secondary brain damage resulting in neurological deficits and fatality [14]. The mass effects and inflammatory contents of hematoma might cause necrosis.
Immune reaction is a major feature of ACH pathology and influences its course [9,15,16].
A hematoma includes an inflammatory blood cells including neutrophil, lymphocyte, microglia and molecular (proteases, cytokines, and reactive oxygen species components) [17-19]. Therefore, hematoma may lead to increase the inflammation of brain and NLR. In our study hematoma volume is significantly higher in the mortality group than the surviving group (Table 1,2).
Limitations
This is an observational single center study. We couldn’t know the long-term results, because of the short duration of follow-up. The effect of the bleeding on the mortality is unknown. It is also unknown whether or not the hematoma volume has increased within 30 days, and its effect on mortality. The hemorrhage causing shifted effect in admission was excluded from the study because the mass effect may cause herniation and death.
Conclusion
NLR on admission is a significant predictor of mortality in acute ischemic stroke. It is also significantly higher in the mortality group than the survival group in acute hemorrhagic stroke, but it has lower sensitivity and specificity for short-term mortality then acute ischemic stroke [14,15]. NLR may be important to follow short-term mortality, but it can be affected by dependents variables such as hematoma volume.
Informed Consent
Written Consent was obtained from the participants.
References
- Ishikawa M, Zhang JH, Nanda A, Granger DN. Inflammatory responses to ischemia and reperfusion in the cerebral microcirculation. Front Biosci. 2004; 9: 1339-1347.
- Tokgoz S, Keskin S, Kayrak M, Seyithanoglu A, Ogmegul A. Is neutrophil/ lymphocyte ratio predict to short-term mortality in acute cerebral infarct independently from infarct volume? J Stroke Cerebrovasc Dis. 2014; 23: 2163-2168.
- Bhutta H, Agha R, Wong J, Tang TY, Wilson YG, Walsh SR. Neutrophillymphocyte ratio predicts medium-term survival following elective major vascular surgery: a cross-sectional study. Vasc Endovascular Surg. 2011; 45: 227-231.
- Lattanzi S, Cagnetti C, Provinciali L, Silvestrini M. Neutrophil-to-lymphocyte ratio and neurological deterioration following acute cerebral hemorrhage. Oncotarget. 2017; 8: 57489-57494.
- Azab B, Zaher M, Weiserbs KF, Torbey E, Lacossiere K, Gaddam S, et al. Usefulness of neutrophil to lymphocyte ratio in predicting short- and long-term mortality after non-ST-elevation myocardial infarction. Am J Cardio. 2010; 106: 470-476.
- Kalay N, Dogdu O, Koc F, Yarlıoglues M, Ardic I, Akpek M, et al. Hematologic parameters and angiographic progression of coronary atherosclerosis. Angiology. 2012; 63: 213-217.
- Muhmmed Suliman MA, Bahnacy Juma AA, Ali Almadhani AA, Pathare AV, Alkindi SS, Uwe Werner F. Predictive value of neutrophil to lymphocyte ratio in outcomes of patients with acute coronary syndrome. Arch Med Res. 2010; 41: 618-622.
- Tokgoz S, Kayrak M, Akpinar Z, Seyithanoglu A, Guney F, Yuruten B. Neutrophil lymphocyte ratio as a predictor of stroke. J Stroke Cerebrovasc Dis. 2013; 22: 1169-1174.
- Xi G, Keep RF, Hoff JT. Mechanisms of brain injury after intracerebral haemorrhage. Lancet Neurol. 2006; 5: 53-63.
- Luo P, Li R, Yu S, Xu T, Yue S, Ji Y, et al. The Relationship between Neutrophil-to-Lymphocyte Ratio and Intracerebral Hemorrhage in Type 2 Diabetes Mellitus. J Stroke Cerebrovasc Dis. 2017; 26: 930-937.
- Tao C, Wang J, Hu X, Ma J, Li H, You C. Clinical Value of Neutrophil to Lymphocyte and Platelet to Lymphocyte Ratio After Aneurysmal Subarachnoid Hemorrhage. Neurocrit Care. 2017; 26: 393-401.
- Wang F, Hu S, Ding Y, Ju X, Wang L, Lu Q, et al. Neutrophil-to-Lymphocyte Ratio and 30-Day Mortality in Patients with Acute Intracerebral Hemorrhage. J Stroke Cerebrovasc Dis. 2016; 25: 182-187.
- Sun Y, You S, Zhong C, Huagn Z, Hu L, Zhang X, et al. Neutrophil to lymphocyte ratio and the hematoma volume and stroke severity in acute intracerebral hemorrhage patients. Am J Emerg Med. 2017; 35: 429-433.
- Xi G, Hoff J. The pathophysiology of hemorrhagic lesions. In: Latchaw RE, Kucharczyk J, Moseley ME, eds. Imaging of the nervous system: diagnosis & therapeutic application. Chicago: Elsevier, 2005: 519–534.
- Castillo J, Dávalos A, Alvarez-Sabín J, Pumar JM, Leira R, Silva Y, et al. Molecular signatures of brain injury after intracerebral hemorrhage. Neurology. 2002; 58: 624-629.
- Di Napoli M, Godoy DA, Campi V, Masotti L, Smith CJ, Parry Jones AR, et al. C-reactive protein in intracerebral hemorrhage: time course, tissue localization, and prognosis. Neurology. 2012; 79: 690-699.
- Del BMR, Yan HJ, Buist R, Peeling J. Experimental intracerebral hemorrhage in rats. Magnetic resonance imaging and histopathological correlates. Stroke. 1996; 27: 2312–2319.
- Hanisch UK. Microglia as a source and target of cytokines. Glia. 2002; 40: 140–155.
- Wang J, Dore S. Inflammation after intracerebral hemorrhage. J Cereb Blood Flow Metab. 2007; 27: 894–908.