
Review Article
Austin Chem Eng. 2015;2(1): 1016.
Molecular Docking, IR, Raman Studies on Heterocyclic Aromatic Compound
Uma Maheswari J¹* and Tom Sundius²
¹Department of Physics, Theivanai Ammal College for Women,Villupuram,India
²Department of Physics, University of Helsinki, Finland
*Corresponding author: Uma Maheswari J, Department of Physics, Theivanai Ammal College for Women,Villupuram, Tamil Nadu, India
Received: March 04, 2015; Accepted: June 03, 2015; Published: June 06, 2015
Abstract
Quantum chemical calculations of energies, geometrical structure and vibrational wave numbers of clioquinol were carried out by DFT (B3LYP) method with 6-21G (d) basis set. The Fourier-Transform Infrared and Fourier- Transform Raman spectra of clioquinol were recorded in the region 4000-400 cm-1 and 3500-100cm-1. A detailed interpretation of the vibrational spectra of this compound has been made on the basis of the calculated Potential Energy Distribution (PED). Comparison of the simulated spectra with the experimental spectra provides important information about the ability of the computational method to describe the vibration mode. A molecular docking study was performed and the results indicate for the future drug designing. Ramachandran plot supports the docking studies by providing the ψ and Ф values for an amino acid in a protein.
Keywords: FT-IR; FT-Raman; Molecular docking; Topology; PED; Ramachandran plot
Introduction
Iodochlorhydroxyquin (clioquinol) is an antifungal drug and antiprotozoal drug. It is neurotoxic in large doses. It is a member of a family of drugs called hydroxyquinolines which inhibit certain enzymes related to DNA replication. The drugs have been found to have activity against both viral and protozoal infections [1]. A result at UCSF indicates that clioquinol appears to block the genetic action of Huntington’s disease in mice and in cell culture [2]. Evidence from phase 2 clinical trials suggested that clioquinol could halt cognitive decline in Alzheimer’s disease, possibly owing to its ability to act as a chelator for zinc and copper ions. This led to development of analogs including PBT2 as potential therapeutic compounds for the treatment of Alzheimer’s disease [3]. Literature says [3] that clioquinol acts directly on a protein called clock-1 and might slow down the aging process. Recent studies provides strong evidence that clioquinol is able to target tumor proteasome in vivo in a copperdependent manner, resulting in formation of an active AR inhibitor and apoptosis inducer that is responsible for its observed antiprostate tumor effect [4]. Di chen et al. reported that clioquinol was capable of binding copper and forming a complex as verified by XANES and EXAFS. Biochemical analysis revealed that clioquinol induced cancer cell death through apoptotic pathways that require caspase activity. It has anticancer effects both in vitro and in vivo [5].
Knowledge of drug-biomolecules interactions contributes to a better understanding of the transportation, metabolism, and toxicity of drugs at molecular level. Spectroscopic methods are powerful tools in coping with problem of molecular mechanisms with advantages of simplicity, rapidity and high sensitivity [6-8]. Quantum chemical computational methods have proved to be an essential tool for interpreting and predicting the vibrational spectra [9,10]. Now a days, sophisticated electron correlation and density functional theory calculations are increasingly available and deliver force field of high accuracy even for large polyatomic molecules [11,12]. Density Functional Theory calculations of vibrational spectra of many organic systems [13-16] have shown promising conformity with experimental results and they provide excellent vibrational frequencies of organic compounds if the calculated frequencies are scaled to compensate for the approximate treatment of electron correlation, for the basis set deficiencies and for the anharmonicity [17-19]. Molecular docking was further employed to find the ligand sites of clioquinol to understand the interaction. Knowledge about the site at which a ligand binds provides an important clue for predicting the function of a protein and is also often a prerequisible for performing docking computations in virtual drug design and screening. The aim of the present study is to give a complete description of the molecule geometry and molecular vibrations of the title molecule. For that purpose, quantum chemical computations were carried out for clioquinol using DFT method. These calculations are valuable for providing insight into the vibrational spectrum and molecular parameters is expected to be helpful in evaluating the potential of clioquinol to environment and human health.
Experimental
The compound clioquinol in the solid form was obtained from the Sigma-Aldrich chemical company with a stated purity of 98% and used as such without further purification. The FTIR and FTRaman spectra of the sample were recorded in the region 4000-400 cm-1 and 3500-100 cm-1 respectively using BRUCKER IFS 66V FTIR spectrometer with a resolution of 0.5 cm-1 at RSIC, Chennai, India. All the sharp bands of the spectrum have an accuracy of ± 1cm-1. The experimental and simulated FTIR and FT-Raman spectra are shown in Figure 1 and 2.
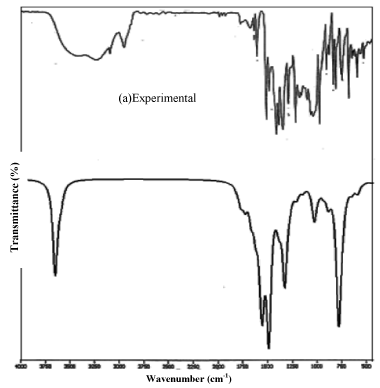
Figure 1: FT-IR spectra of Clioquinol (Experimental/theoretical).
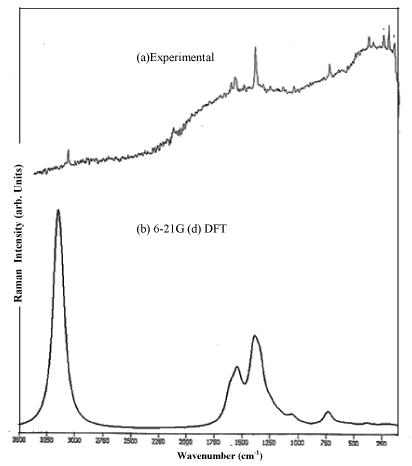
Figure 2: FT-Raman spectra of Clioquinol (Experimental/ theoretical).
Computational details
All calculations were performed using the G03W [20,21] software. Initial geometry generated from standard geometrical parameters [22] and full optimizations were carried out. The vibrational wavenumbers, geometric parameters, and other molecular properties were carried out using DFT (B3LYP) method with 6-21G (d). To compensate for the errors arising from basis set incompleteness and neglect of vibrational anharmonicity, we have scaled the wave numbers with scaling factors. All the parameters were allowed to relax and the calculations converged to an optimized geometry which corresponds to a true minimum, as seen from the lack of imaginary wave numbers. The Cartesian representation of the theoretical force constants has been computed at the fully optimized geometry. Transformation of force field, the subsequent normal coordinate analysis and calculation of the Potential Energy Distribution (PED) were done on a PC with the MOLVIB program (version V 7.0) written by Sundius [23]. The Natural Bond Orbital (NBO) analysis were performed using NBO 3.1 program as implemented in the Gaussian 03W package at the above said level.
Results and Discussion
Geometrical structure
The optimized structure parameters for the clioquinol are calculated by DFT (B3LYP) with 6-21G (d) basis set. The labeling of atoms for clioquinol is given in Figure 3. Comparison table for the calculated bond lengths and angles for clioquinol with those of experimentally [24] available x-ray diffraction data are listed in the Table 1. From the theoretical values, we can find that most of the optimized bond angles are slightly larger than the experimental values, due to the theoretical calculations belong to the molecules in gaseous phase and the experimental results belong to the molecules in solid phase. Comparing bond angles and lengths as a whole, the values of B3LYP correlates well compared with the experimental results. Inspite of the differences calculated geometric parameters represent a good approximation and they are the bases for calculating other parameters such as vibrational frequencies.
    Parameters
    Experimentala
    B3LYP/    6-21G(d)


    Bond    length


    N(1)-C(2)
    1.35
    1.32


    N(1)-C(10)
    1.35
    1.36


    C(2)-C(3)
    1.42
    1.41


    C(2)-H(14)
    1.1
    1.08


    C(3)-C(4)
    1.42
    1.37


    C(3)-H(15)
    1.1
    1.08


    C(4)-C(5)
    1.42
    1.41


    C(4)-H(16)
    1.1
    1.08


    C(5)-C(6)
    1.42
    1.42


    C(5)-C(10)
    1.42
    1.42


    C(6)-C(7)
    1.42
    1.37


    C(6)-Cl(13)
    1.71
    1.76


    C(7)-C(8)
    1.42
    1.41


    C(7)-H(17)
    1.1
    1.08


    C(8)-C(9)
    1.42
    1.37


    C(8)-I(12)
    2.14
    2.12


    C(9)-C(10)
    1.42
    1.42


    C(9)-O(11)
    1.33
    1.35


    O(11)-H(18)
    0.97
    1.01


    Bond    Angle


    C10-N1-C2
    114.99
    118.49


    C3-C2-N1
    123.5
    122.34


    H14-C2-N1
    116.50
    117.33


    C5-C10-N1
    120.00
    123.32


    H14-C2-C3
    120.00
    120.31


    C4-C3-C2
    129.38
    119.62


    H15-C3-C2
    120.00
    119.53


    H15-C3-C4
    120.00
    120.84


    C5-C4-C3
    115.61
    119.64


    H16-C4-C3
    122.19
    121.14


    H16-C4-C5
    122.19
    119.20


    C6-C5-C4
    119.99
    125.96


    C10-C5-C4
    120.00
    116.56


    C10-C5-C6
    119.99
    117.46


    C7-C6-C5
    120.00
    120.80


    C5-C10-C9
    119.99
    121.54


    Cl13-C6-C7
    120.00
    119.36


    C8-C7-C6
    119.99
    120.48


    H17-C7-C6
    120.00
    119.73


    H17-C7-C8
    120.00
    119.27


    C9-C8-C7
    119.99
    120.48


    I12-C8-C7
    120.00
    120.54


    I12-C8-C9
    120.00
    118.97


    C8-C9-C10
    119.99
    118.70


    O11-C9-C8
    124.30
    123.62


    O11-C9-C10
    124.30
    117.66


    H18-O11-C9
    108.00
    104.83
Table 1: Optimized parameters for Clioquinol B3LYP with 6-21G (d).
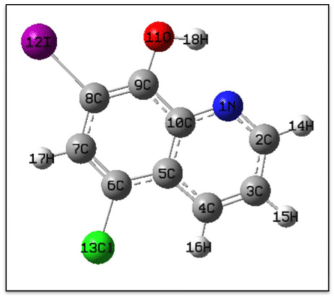
Figure 3: Numbering system adopted Clioquinol.
Topology analysis
Ring count=2
Ring atom count=10
Ring bond count =11
Aromatic ring count=2
Aliphatic atom count=3
Aliphatic bond count=3
Aromatic atom count=10
Aromatic bond count=11
Carbo ring count=1
Hetero ring count=1
Hetero aromatic ring count=1
Carbo aromatic ring count=1
Fused aromatic ring count=2
Vibrational assignments
IR and Raman spectra contain a number of bands at specific wavenumbers. The aim of the vibrational analysis is to decide which of the vibrational modes give rise to each of these observed bands. According to the theoretical calculations, clioquinol has a structure of C1 point group has 18 atoms and 48 modes of fundamental vibrations. The Table 2 shows. FT-IR and FT-Raman frequencies assignments for clioquinol. The potential energy distributions are also supporting the present study. The computed intensities show marked deviations from the observed values. One may note that the computed wavenumbers correspond to the isolated molecular state, whereas the observed wavenumbers correspond to the solid state spectra. We have assigned the fundamental mode of clioquinol on the basis of a group vibrational concept and calculated vibrational wavenumbers. On the whole, the predicted vibrational wavenumbers are in agreement with the experimental results. The internal coordinates and symmetry coordinates are given in Table 2 and Table 3. The resultant scaled frequencies, measured infrared, Raman band positions and their assignments are presented in Table 4. The internal coordinates describe the position of the atoms in terms of distances, angles and dihedral angles with respect to an origin atom. The last column of the Table 4 shows the detailed vibrational assignment obtained from the calculated Potential Energy Distribution (PED). The heterocyclic aromatic compounds and its derivatives are structurally very close to benzene. The C-H stretching vibrations [25] of aromatic and hetero aromatic cover in the region of 3100 cm-1-3000 cm-1. This permits the ready identification of the structure. The frequencies at 3120, 3100 and 3028 cm-1 in FT-IR spectrum and 3125, 3105 cm-1 in the FT-Raman is assigned to C-H stretching aromatic ring. The C-H bending vibration appears at two distinct regions 1300-1000 cm-1 and 700-610 cm-1 [26- 28]. The bands at 1200, and 953 cm-1 in FT-IR and the bands at 1205 and 950 cm-1 in the FT-Raman spectrum have been assigned to COH bending vibrations. The vibration belonging to the bond between the ring and the halogen atom are worth to discuss since mixing of vibrations are possible due to the lowering of the molecular symmetry and the presence of heavy atoms on the periphery of the molecule [29] coupling with other groups may result in shift in the absorption band as high as 840 cm-1.For simple chlorine containing organic compounds, C-Cl absorption are in the region 750-700 cm-1,whereas for the Trans- and Gauche- [30] forms they are near 650cm-1 .In the present study, the band observed at 649 cm-1 in the IR spectrum and the same band is observed in Gunasekaran et al. [27], 650 cm-1 in the IR and 652 cm-1 in Raman spectrum in Sundaraganesan et al. [31] which is identified as C-Cl stretching and CCl bending corresponding to experimental values at 670, 649 cm-1 of FTIR and 670, 650 cm-1 of FT-Raman in our present study. This mode is not pure but contains significant contribution from other modes. This result is in agreement with reported values given by Varghese et al. [32], George et al. [33] and Palafox et al. [34]. The O–H group vibrations are likely to be the most sensitive to the environment, so they show pronounced shifts in the spectra of the hydrogen-bonded species. With stronger intermolecular bonding, the O-H stretching vibrations may give rise to broad and intense bands which are often overlaid with peaks due to Fermi-resonance interactions. In the present molecule, the band observed at 3218 cm-1 in FTIR is assigned to O-H stretching with 98% PED contribution. The O-H in-plane bending vibration for phenols, in general, lies in the region 1150–1250 cm-1 and is not much affected due to hydrogen bonding unlike to stretching and out-ofplane bending wave numbers [35]. In both inter-molecular and intramolecular associations, the wave number is at a higher value than in free O-H. The wave number increases with hydrogen-bond strength because of the large amount of energy required to twist the O-H bond. The C-O-H out-of-plane bending vibration computed by B3LYP/6- 21G (d) at 1209,839, cm-1 shows good agreement with the recorded FT-IR band at 1200,740 cm-1. If a compound contains carbonyl group the absorption caused by C-O stretching is generally strong among the strongest present [36]. Accordingly, the FTIR bands observed at 1270, 1120 cm-1 and 1275 cm-1 at FT-Raman in clioquinol have been assigned to C-O stretching modes of vibrations. The assignments of C-O in-plane and out-of-plane bending vibrations made in this study are supported by the literature Ashdown and Kletz [37] have reported number of such cases and the range of frequencies 1020 cm- 1-1110 cm-1 associated with the C-O linkage. In the present case, the experimental frequencies at 620 cm-1 in FTIR and 615 cm-1 in FTRaman spectrum of clioquinol are assigned to C-C-O asymmetric bending vibrations; this is an excellent agreement with the predicted frequency at 627 cm-1.
    No
    Symbol
    Type
    Definition


    4-Jan
    ?
    CH
    C7-H17,C2-H14,C3-H15,C4-H16.


    13-May
    ?
    CC
    C2-C3,C3-C4,C4-C5,C5-C10,C5-C6,    C6-C7,C7-C8,C8-C9,C9-C10.


    14
    ?
    CCL
    C6-Cl13.


    15
    ?
    CI
    C8-I12.


    16-17
    ?
    NC
    N1-C2,N1-C10.


    18
    ?
    CO
    C9-O11.


    19
    ?
    OH
    O11-H18.


    20-25
    β
    R1b
    N1-C2-C3,C3-C4-C5,C5-C10-N1,    C2-C3-C4,C4-C5-C10,C10-N1-C2.


    26-31
    β
    R2b
    C5-C6-C7,C7-C8-C9,C9-C10-C5,    C6-C7-C8,C8-C9-C10,C10-C5-C6.


    32-33
    β
    ICCb
    I12-C8-C7, I12-C8-C9


    34-35
    β
    CCLb
    C7-C6-Cl13, C5-C6-Cl13.


    36-37
    β
    CCOb
    C8-C9-O11, C10-C9-O11.


    38
    β
    COHb
    C9-O11-H18.


    39-40
    β
    NCHb
    N1-C2-H14, C3-C2-H14


    41-46
    β
    CCHb
    C2-C3-H15, C4-C3-H15, C3-C4-H1,    C5-C4-H16, C8-C7-H17, C6-C7-H17.


    47
    β
    CCNb
    C9-C10-N1.


    48
    β
    CCCb
    C4-C5-C6.


    49
    ?
    ICo
    I12-C8-C9-C7.


    50-53
    ?
    CHo
    H15-C3-C2-C4,H16-C4-C3-C5,H14-C2-C3-N1,    H17-C7-C6-C8.


    54
    ?
    OCo
    :O11-C9-C10-C8.


    55
    ?
    CLCo
    Cl13-C6-C7-C5.


    56-57
    ?
    CCo
    C5-C10-C9-N1,C4-C5-C6-C10


    58-63
    t
    R1t
    N1-C2-C3-C4,C3-C4-C5-C10,C5-C10-N1-C2, C2-C3-C4-C5,C4-C5-C10-N1, C10-N1-C2-C3.

    64-69
    t
    R2t
    C5-C6-C7-C8,C7-C8-C9-C10,C9-C10-C5-C6,    C6-C7-C8-C9,C8-C9-C10-C5,C10-C5-C6-C7


    70-71
    t
    buttfly
    C6-C5-C10-N1 , C9-C10-C5-C4


    72-73
    t
    COt
    C10-C9-O11-H18,C8-C9-O11-H18.
Table 2: Optimized parameters for Clioquinol B3LYP with 6-21G (d).
    No
    Symbol
    Definition


    4-Jan
    CH
    R1,R2,R3,R4


    13-May
    CC
    R5,R6,R7,R8,R9,R10,R11,R12,R13


    14
    CCL
    R14


    15
    CI
    R15


    16-17
    NC
    R16,R17


    18
    CO
    R18


    19
    OH
    R19


    20
    TrigR1b
    (β20- β21+ β22- β23+ β24- β25)/v6


 21
 SymR1b
 (2β20- β21-β22+2 β23- β24-2β25)/v12


 22
 AsymR1b
 (β21- β22+ β24- β25)/v2


 23
 TrigR2b
 (β26- β27+ β28- β29+ β30- β31)/v6


 24
 SymR2b
 (2β26- β27-β28+2 β29- β30-β31)/v12


 25
 AsymR2b
 (β27- β28+ β30- β31)/v2


 26
 ICCb
 (y32-y33)/v2


 27
 CCLb
 (y34-y35)/v2


 28
 CCOb
 (v36-v37)/v2


 29
 COHb
M38


 30
 NCHb
 (v39-v40)/v2


 31-33
 CCHb
 (v41-v42)/v2, (v43-v44)/v2, (v45-v46)/v2


 34
 CCNb
 P47


 35
CCCb
P48


 36
 ICo
 P49


37-40
    CHo
    P50, P51, P52, P53


    41
    OCo
    P54


    42
    CLCo
    P55


    43-44
    CCo
    P56, P57


    45
    TrigR1t
    (s58-s59+s60-s61+s62-s63)/v6


    46
    SymR1t
    (s58-s60+s61-s63)/v2


    47
    AsymR1t
    (-s58+2s59-s60-s61+2s62-s63)/v12


    48
    TrigR2t
    (s64-s65+s66-s67+s68-s69)/v6


    49
    SymR2t
    (s64-s66+s67-s69)/v2


    50
    AsymR2t
    (-s64+2s65-s66-s67+2s68-s69)/v12


    51
    buttfly
    (s70-s71)/v2


    52
    COt
    (s72-s73)/2
Table 3: Definition of local symmetry coordinates.
    MODE No.
    IR
    RAMAN
    HF
    B3LYP
    Assignments PED%


    1
    3218
    -
    3300
    3200
    vOH ( 98)


    2
    3120
    3125
    3280
    3128
    vCH ( 99)


    3
    3100
    3105
    3245
    3110
    vCH ( 99


    4
    -
    -
    3234
    3090
    vCH ( 99)


    5
    3028
    -
    3210
    3030
    vCH ( 99)


    6
    1645
    1640
    1660
    1642
    vCC ( 58)+ COHb( 11)


    7
    1604
    1610
    1620
    1602
    vCC( 48)+ CCHb( 21)+ vNC( 15)


    8
    1575
    1580
    1580
    1575
    vCC( 51)+vNC+( 10)


    9
    1540
    1545
    1530
    1520
    CCHb( 49)+ vCC( 40)


    10
    1498
    1500
    1490
    1468
    vCC( 36)+ NCHb( 28)+ vNC( 15)


    11
    1459
    1463
    1432
    1428
    CCHb( 52)+ vCC( 29)


    12
    -
    -
    1423
    1413
    vCC( 52)+ COHb( 28)


    13
    -
    -
    1410
    1405
    vNC( 28)+ NCHb( 20)+ vCC( 17)+    VCO( 11)+ CCHb( 10)


    14
    1360
    -
    1342
    1330
    vCC( 56)+ COHb( 20)


    15
    -
    -
    1284
    1276
    vNC 20)+ CCHb( 19+ vCC(17)+    NCHb( 16)+ TrigR2(12)


    16
    1270
    1275
    1271
    1264
    vCC(39)+ CCHb( 20)+ VCO( 15)+    vNC( 14)


    17
    -
    -
    1230
    1229
    CCHb( 37)+ vCC( 34)


    18
    1200
    1205
    1220
    1209
    vCC( 53)+ vNC( 15)+ COHb( 14)


    19
    -
    -
    1172
    1165
    vCC( 42)+ CCHb ( 19)+ vNC( 12)+    TrigR2( 10)


    20
    1120
    -
    1135
    1104
    vCC( 26)+ TrigR1( 21)+ VCO(    14)+ CCHb( 10)


    21
    1095
    1090
    1080
    1053
    vCC ( 71)


    22
    1050
    -
    1072
    1041
    CHo( 86)+ TrigR1( 11)


    23
    990
    -
    1000
    990
    CHo ( 85)


    24
    -
    -
    991
    981
    VCCL( 20)+ vNC( 17)+ TrigR1(    15)+ AsymR2( 13)+ TrigR2( 13)+ vCC( 10)


    25
    953
    950
    945
    940
    CHo( 66)+ TrigR2( 21)


    26
    -
    -
    933
    921
    TrigR1( 31)+ TrigR2( 26)+ OCo(    14)+ CHo( 13)


    27
    869
    -
    880
    870
    vCC ( 24)+ TrigR1( 17)+ VCI (    13)+ SymR1b ( 12)


    28
    -
    -
    860
    839
    CHo( 77)


    29
    740
    -
    760
    747
    COt ( 61)+ OCo ( 15)


    30
    -
    -
    750
    732
    vCC( 36)+ AsymR1( 15)+ VCO(    13)+ TrigR2( 11)


    31
    -
    -
    735
    728
    OCo( 24)+ TrigR1( 22)+ COt (    17+, ICo( 10)


    32
    670
    670
    685
    679
    VCCL( 28)+ AsymR2 ( 18)+    SymR1b( 18)+ VCI(16)


    33
    649
    650
    650
    633
    CLCo( 26)+ SymR2t( 25)+ TrigR2(    16)


    34
    620
    615
    630
    627
    AsymR1( 42)+ CCOb( 19)


    35
    563
    566
    572
    569
    vCC( 19)+ CCLb( 19)+ CCCb( 15)+    SymR1b( 14)+ AsymR1 ( 10)


    36
    548
    550
    535
    533
    AsymR2( 24)+ AsymR1( 20)+ ICo(    18)+ SymR1t ( 11)


    37
    510
    505
    520
    516
    SymR2b( 31)+ SymR1b( 15)+    AsymR2( 12)+ vCC(10)


    38
    450
    445
    445
    440
    AsymR1(39)+ SymR1t(16)


    39
    426
    425
    394
    371
    CLCo(29)+ ICo( 21)+ OCo( 19)+    SymR1t( 11)


    40
    -
    -
    360
    353
    VCCL( 44) AsymR2( 31)+ vCC 11)


    41
    -
    -
    302
    299
    CCOb( 41)+ CCNb( 12)+ CCLb( 11)


    42
    -
    -
    246
    226
    AsymR1( 34)+ buttfl( 17)+ ICo(    13)


    43
    -
    216
    235
    216
    VCI( 22)+ CCLb( 16)+ SymR2b(    15)+ CCCb( 12)


    44
    -
    -
    187
    161
    CCLb( 40)+ VCI( 32)+ vCC( 12)


    45
    -
    150
    168
    158
    SymR1t( 28)+ SymR2t( 22)+    AsymR2( 22)+ TrigR2(11)


    46
    -
    -
    131
    128
    CLCo( 28)+ ICo( 23)+ SymR2t(    18)


    47
    -
    -
    126
    116
    ICCb( 81)


    48
    -
    -
    71
    60
    SymR2t( 46)+ ICo( 15)+ AsymR2 (    12)+ OCo ( 11)
Table 4: Experimental, computed frequencies (cm-1) and PED with assignments of Clioquinol with 6-21G(d).
Ligand docking
Ligand docking referred to cases where small molecular (ligand) is being docked into much larger macromolecule (target). The interaction between proteins and other molecules is fundamental to all biological functions. This include tools that can assist in prediction of interaction sites on protein surface and tools for predicting the structure of the intermolecular complex formed between two or more molecules (docking). Molecular docking was performed to obtain protein-ligand binding energy and to identify potential ligand binding sites. Docking calculations were carried out with Autodock tools. The 3D structure of clioquinol was generated by PyMol for visualizing the interaction of docked protein-ligand complex. Figure 4 shows (secondary structure) the ligand sites and polar contacts of clioquinol. Protein coloured according to secondary structure beta sheets in green, orange, yellow and helices in red, blue, green. The arrows shows the direction of the beta-sheets, which is from the N- and C- terminus. The point in opposite direction shows they are anti-parallel. Apparently, one should note high number of different proteins folds, this is due to number of amino acid sequences. Oxidoreductase as enzyme which is responsible for metabolic process and HIF-1a inhibitor that decreases the enzyme activity. The HET residuces are 1352 SO4 and 1353 SO4, they are the non-standard residuces in the entry.
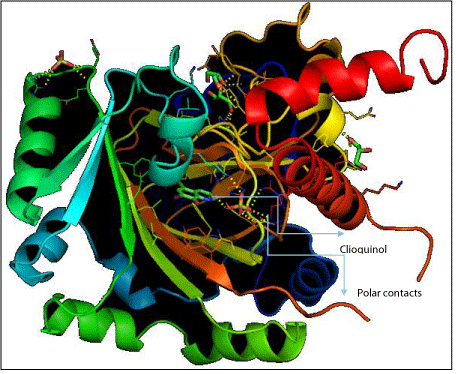
Figure 4: Secondary structure of Clioquinol.
Figure 5 shows the assessment of the Ramachandran plot (scatter plot) of clioquinol. Ramachandran plot is a way to visualize dihedral angles ψ against Ф of amino acid residuces in protein structure. The two torsion angles of the polypeptide chain describe the rotations of poplypeptide backbone around the bonds between N-Ca (Ф) and Ca-C(ψ). We tried to show the conformation of the Ф and ψ angles are possible for an amino acid residue in a protein. One can observe from the Figure 5, the darkest areas correspond to the “core” regions representing the most favourable combinations of Ф and ψ values. This “core” region guides to stereo chemical quality and thus it shows both the proline and glycine favoured and allowed regions. It is clearly being seen on the scatter plot, on the plot the region marked a is for a-helices and β is for beta sheet. Each dot on the plot provides the ψ and Ф values for an amino acid in a protein. The regions on the plot with the highest density of dots are the allowed regions (lowenergy regions).
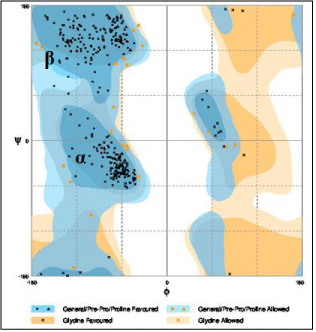
Figure 5: Ramachandran plot of Clioquinol.
Electronic Properties
The Frontier molecular orbital plays an important role in the electric and optical properties and chemical reaction [38]. Many organic molecules that containing conjugated π electrons are characterized hyperpolarizabilities and were analyzed by means of vibrational spectroscopy [39,40]. In most cases, even in the absence of inversion symmetry; the strongest bands in the Raman spectrum are weak in the IR spectrum and vice-versa. But the intramolecular charge transfer from the donor to acceptor group through a singledouble bond conjugated path can induce large variations of both the molecular dipole moment and the molecular polarizability, making IR and Raman activity strong at the same time. The analysis of the wave function indicates that the electron absorption corresponds to the transitions from the ground to the first excited state and is mainly described by one-electron excitation from the Highest Occupied Molecular Orbital (HOMO) to the Lowest Unoccupied Molecular Orbital (LUMO) Figure 6. shows the atomic orbital HOMO- LUMO composition of the frontier molecular orbital computed at the DFT (B3LYP) with 6-21G (d) basis of clioquinol. The calculations indicate that the title compound has (72) occupied molecular orbital. The positive phases are red and the negative ones are green. As seen from the Figure 6 in HOMO, the electrons are mainly localized on the chlorine and quinoline ring (donor). However, when electron transition takes place, some electron will enter into LUMO, and then the electron will mainly be localized on quinoline ring (acceptor). Namely, electron transitions are corresponding to the π→π*. The HOMO-LUMO energy gap of clioquinol was calculated at the B3LYP/6-21G (d) level reveals that the energy gap reflects the chemical activity of the molecule. HOMO energy = -5.9631 eV, LUMO energy = -1.9459 eV, HOMO-LUMO energy gap = 4.017 eV.
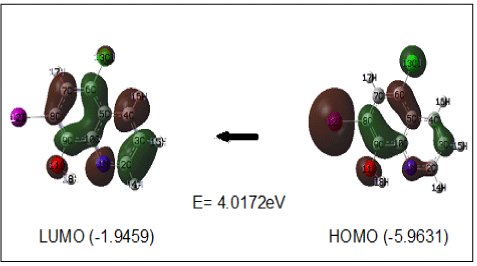
    Figure 6:  Atomic orbital HOMO – LUMO composition of the frontier molecular
orbital for Clioquinol.
Natural bond orbital analysis
Natural Bond Orbital analysis performs the analysis of a manyelectron molecular wave function in terms of localized electron-pair “bonding’ units. The analysis is based on a method for optimally transforming a given wavefunction into localized form, corresponding to the one-center (lone pair) and two-center (bond) elements of the chemist’s lewis structure picture. The second-order Fock matrix was carried out to evaluate the donor-acceptor interactions in NBO analysis. The interactions’ result is the loss of occupancy from the localized NBO of the idealized Lewis structure into an empty non- Lewis orbital. For each donor (i) and acceptor (j), the stabilization energy E (2) associated with the delocalization i→j is estimated as E2 =ΔEij=qi (F (i.j) ²/ (εj – εi)).
Where qi is the donor orbital occupancy, εj and εi are diagonal elements and F (i, j) is the off diagonal NBO Fock matrix element. The second order perturbative estimates of ‘donor-acceptor’ (bond-antibond) interactions in the NBO basis. From the Table 5, Interestingly, the NBO analysis clearly manifests the evidence of the ICT from π*(C6-C7)- π*(C5-C10) , π* to π*(N1-C2) to (C5-C10) and π* to π* (C8-C9) to (C5-C10) with large stabilization energy of 271, 137 and 262kcal/mol.
    Donor  NBO(i)
    Type
    ED/e
    Acceptor NBO(j)
    Type
    ED/e
    aE(2) Kcal/mol
    bE(j)-E(i) a.u.
    cF(i,j) a.u.


    N 1 – C 2
    p
    1,8175
    C 5 – C 10
    p*
    0.9704
    22.29
    0.37
    0.088


    C2 - C   3
    s
    1.9579
    C3 - C   4
    s*
    0.0536
    28.45
    2.21
    0.225


    C4 - C5
 s
 1.9326
 C3 - C4
 s*
 0.0536
 21.19
 2.18
 0.192


 C5 - C10
 p
 1.5871
 C8 - C9
 p*
 0.408
 25.48
 0.3
 0.079


 C6 - C7
 p
 1.7223
 C5 - C10
 p*
 0.9704
 22.75
 0.32
 0.081


 C8 - C9
 p
 1.6858
 C6 - C7
 p*
 0.569
 25.26
 0.31
 0.08


 N1 - C2
 p*
 0.2456
 C 5 - C  10
 p*
 0.9704
 137.32
 0.03
 0.091


 C5 - C10
 p*
 0.4704
 C3 - C4
 p*
 0.141
 25.04
 0.15
 0.099


 C6 - C7
 p*
 0.5695
 C5 - C10
 p*
 0.9704
 271.19
 0.02
 0.091


 C8 - C9
 p*
 0.408
 C5 - C 10
 p*
 0.9704
 262.4
 0.02
 0.096


 aE (2) means energy of hyper conjugative interaction (stabilization energy).
bEnergy difference between donor and acceptor i and j NBO orbitals.
cF (i, j) is the fock matrix element between i and j NBO orbitals.
Table 5: Second Order Perturbation Theory Analysis of Fock Matrix in NBO Basis.
Conclusion
Density functional theory calculations have been carried out on the structure and vibrational spectrum of clioquinol. The equilibrium geometry computed by B3LYP method for both the bond angles and bond lengths are performed better. The vibrational frequency analysis of some values DFT method agrees satisfactorily with experimental results. On the basis of agreement between the calculated and experimental results, assignment of all the fundamental vibrational modes of clioquinol were examined and proposed in this investigation. The PED contributions to each of the observed frequencies show the reliability and accuracy of the spectral analysis. This study demonstrates that scaled DFT/B3LYP calculations are a powerful approach for understanding the vibrational spectra of medium sized organic compounds. Further employment of molecular docking to find ligand sites of clioquinol are favourable for structure based drug design.
References
- Rohde W, Mikelens P, Jackson J, Blackman J, Whitcher J, Levinson W. Hydroxyquinolines inhibit ribonucleic acid-dependent deoxyribonucleic acid polymerase and inactivate Rous sarcoma virus and herpes simplex virus. Antimicrob Agents Chemother. 1976; 10: 234-240.
- Nguyen T, Hamby A, Massa SM. Clioquinol down-regulates mutant huntingtin expression in vitro and mitigates pathology in a Huntington's disease mouse model. Proc Natl Acad Sci USA. 2005; 102: 11840-11845.
- Ritchie CW, Bush AI, Mackinnon A, Macfarlane S, Mastwyk M, MacGregor L, et al. Metal-protein attenuation with iodochlorhydroxyquin (clioquinol) targeting Abeta amyloid deposition and toxicity in Alzheimer disease: a pilot phase 2 clinical trial. Arch Neurol. 2003; 60: 1685-1691.
- Chen D, Cui QC, Yang H, Barrea RA, Sarkar FH, Sheng S, et al. Clioquinol, a therapeutic agent for Alzheimer's disease, has proteasome-inhibitory, androgen receptor-suppressing, apoptosis-inducing, and antitumor activities in human prostate cancer cells and xenografts. Cancer Res. 2007; 67: 1636-1644.
- Ding WQ, Liu B, Vaught JL, Yamauchi H, Lind SE. Anticancer activity of the antibiotic clioquinol. Cancer Res. 2005; 65: 3389-3395.
- Ming Guo, Wei-Jun Lu, Ping-Gui Yi, Qing-Sen Yu. Study on the thermodynamic characteristics between fluoroquinolone and bovine serum albumin. J Chem Thermodyn. 2007; 39: 337-343.
- Lu Y, Wang G, Lu X, Lv J, Xu M, Zhang W. Molecular mechanism of interaction between norfloxacin and trypsin studied by molecular spectroscopy and modeling. Spectrochim Acta A Mol Biomol Spectrosc. 2010; 75: 261-266.
- Skauge T, Turel I, Sletten E. Interaction between ciprofloxacin and DNA mediated by Mg2+-ions. Inorg Chim Acta. 2002; 339: 239-247.
- Hess BA, Schaad J, Carsky P, Zahradnik R. Chem Rev. 1986; 86: 709-730.
- Pulay P, Zhon X, Fogarasi G. in NATO ASI Seris. (Ed. RFransto), Kluwer: Dordrecht C. 1993; 406: 99-100.
- Andzelm J, Wimmer E. J Chem Phys. 1992; 96: 1280-1285.
- Becke AD. J Chem phys. 1992; 96: 2155-2160.
- Onhson BJ, Gill PMW, Pople JA. Chem Phys. 1993; 98: 5612-5613.
- Nicholas C Handy, Christopher W Murray, Roger D Amos. Study of methane, acetylene, ethene, and benzene using Kohn-Sham theory. J Phys Chem. 1993; 97: 4392-4396.
- Delano P Chong, Alan V Bree. Calculated infrared intensities for the bending mode in some small linear molecules. Chem phys let. 1993; 210: 443-447.
- Berces A, Zeigler T. J chem Phys. 1993; 98: 4793-4803.
- Fiona Sim, Alain St Amant, Imre Papai, Dennis R Salahub. Gaussian density functional calculations on hydrogen-bonded systems. J Am chem Soc. 1992; 114: 4391-4400.
- Nicholas C Handy, Paul E Maslen, Roger D Amos, Jamie S Andrews, Christopher W Murray, Gregory J Laming. The harmonic frequencies of benzene. Chem phys let. 1992; 197: 506-515.
- Ramachandran KI, Deepa G, Namboori K. Computational Chemistry and Molecular Moldeling Principles and Applications, Springer-Verlag Berlin Heidelberg. 2008.
- Stephens PJ, Devlin FJ, Chavalowski CF, Frish M. Ab Initio Calculation of Vibrational Absorption and Circular Dichroism Spectra Using Density Functional Force Fields: A Comparison of Local, Nonlocal, and Hybrid Density Functionals. J phys chem. 1995; 99: 16883-16902.
- Frisch MJ, Trucks GW, Schlegel HB, Scuseria GE, Robb MA, Cheeseman JR, et al. Gaussian Inc. Waling ford, CT. 2004.
- Schlegel HB. Optimization of equilibrium geometries and transition structures. J Comput Chem. 1982; 3: 214-218.
- Sundius T. Molvib - A flexible program for force field calculations. J Mol Struct. 1990; 218: 321-326.
- Moon H, Han S, Park H, Choe J. Crystal structures of human FIH-1 in complex with quinol family inhibitors. Mol Cells. 2010; 29: 471-474.
- Casini A. X-ray Crystallograpy of the Antiepileptic Drug Zonisamide with CA II. Acta Cryst. 2005; 61: 242-243.
- Arivazhagan M, Joseph Prince J, Balachandran V. FTIR and FT-Raman spectral investigation of 2-chloro-l, 3-dibromo-5- fluorobenzene. Ind J pure and applied Physics. 2008; 46: 698-701.
- Gunasekaran S, Natarajan RK, Shyamala D, Rathika R. Normal coordinate analysis of urea meta nitro benzoic acid crystal. Ind J pure and applied Phys. 2006; 44: 315-319.
- Krishnakumar V, John Xavier R. Chem Phys. 2005; 312: 227-240.
- Chengteh Lee, Weitao Yang, Robert G Parr. Development of the Colle-Salvetti correlation-energy formula into a functional of the electron density. Phys Rev. 1988; 37: 785-786.
- Socrates G. “Infrared characteristics group frequencies”, John Wiley, NewYork. 1987.
- Sundaraganesan N, Joshua BD, Rajamoorthy M, Gangadhar CH. FT-IR, FT-Raman spectra and ab- initio DFT vibrational analysis of 2-chloro-5-aminopyridine. Ind J pure and appl Phys. 2007: 45; 969-978.
- Varghese HT, Panicker CY, Philip D, Pazdera P. Vibrational spectroscopic studies and ab initio calculations of 2-cyanophenylisocyanid dichloride. Spectrochim Acta A Mol Biomol Spectrosc. 2007; 67: 1055-1059.
- George WO, S. Mcintyre S. “Introduction to Spectroscopy” John Wiley, New York. 1987.
- Palafox MA, Rastogi VK, Mittal L. Benzonitriles: Survey of their importance and scaling of their vibrational frequencies. Int J. Quantum Chem. 2003; 94: 189-204.
- Varsanyi G. “Assignments for vibrational spectra of seven hundred Benzene Derivatives”. Wiley, New York. 1973.
- Sathyanarayana DN. “Vibrational spectroscopy-Theory and applications” New age International. New delhi. 2004.
- Ashdown A, Kletz TA. J chem Soc. 1948; 1039: 1454-1456.
- Fleming I. Frontier orbital and Organic Chemical Reactions, Wiley, London. 1976.
- Ataly Y, Avci D, Basoglu A. Struct Chem. 2008; 19: 239- 246.
- Vijayakumar T, Hubert JoeI I, Nair CPR, Jayakumar VS. Efficient p electrons delocalization in prospective push–pull non-linear optical chromophore 4-[N,N-dimethylamino]-4'-nitro stilbene (DANS): A vibrational spectroscopic study. Chem Phys. 2008; 343: 83-99.