
Research Article
Austin Chem Eng. 2015; 2(2): 1021.
Optimization of the Process Parameters for the Preparation of Activated Carbon from Low Cost Phoenix Dactylifera Using Response Surface Methodology
Devi AS, Kalavathy MH and Miranda LR*
Carbon Research and Engineering, Department of Chemical Engineering, A.C. Tech, Anna University, Chennai, India
*Corresponding author: Lima Rose Miranda, Carbon Research and Engineering, Department of Chemical Engineering, A.C. Tech, Anna University, Chennai, India
Received: November 23, 2015; Accepted: December 30, 2015; Published: December 31, 2015
Abstract
This work deals with the preparation of low-cost activated carbon from selected agricultural waste materials, by chemical activation with orthophosphoric acid. Activated carbon was prepared at various temperature, time and impregnation ratio. The effect of these preparation parameters on the yield and adsorption capacity of the prepared activated carbon was analyzed. The activation process was confirmed by the well-developed pore structure seen in SEM image and the FTIR analysis. The significant effect of three important process parameters were investigated systematically and optimized preparation condition was determined for the prepared ACDP to separate out different dyes of varying molecular weight range using Response Surface Methodology. This work showed that the effectiveness of an adsorbent lies in the way it is prepared and tuning the preparation condition directly has effect on the pore structure. The results reveal that ACDP can be recommended as a potential adsorbent for effective removal of pollutants from waste water and aqueous solutions.
Keywords: Activated carbon; Chemical activation; Characterization; Optimization; Response Surface Methodology
Abbreviations
AC Activated Carbon
ACDP Activated Carbon from date pits
CCD Central Composite Design
FTIR Fourier Transform Infrared Spectroscopy
IN Iodine Number
MB Methylene Blue
MR Methyl Red
MG Malachite green
MV Methyl Violet
MBN Methylene Blue Number
MRN Methyl Red Number
MGN Malachite green Number
MVN Methyl Violet Number
RSM Response Surface Methodology
SEM Scanning Electron microscope
TGA Thermo gravimetric analysis
Introduction
Among the various technologies available to remove toxic components such as anions, heavy metals, organic compounds and dyes from water sources, adsorption has been shown to be very effective for removal of dyes and other pollutants from aqueous solutions [1]. Activated carbon-based systems can remove a wide variety of toxic pollutants with very high removal efficiencies and has proved to be the least expensive treatment option, particularly in treating low concentrations of wastewater streams and in meeting stringent treatment levels. (Figure 1) shows the surface attraction of gases and chemicals onto activated carbon. This widely used adsorbent in industrial scale is commercially manufactured from various carbonaceous precursors like lignite and coal (42%), peat (10%), wood (33%) and coconut shell. However, the growing demand in adsorbing materials for polluted fluids treatment and increased cost of raw materials resulted in an increased research, concerning activated carbon preparation methods and sources.
In recent years, researchers have used low cost materials and waste agricultural material to reduce the cost of production. These include palm ash [2,3], chitosan/oil palm ash composite beads [4], pomelo (Citrus grandis) peel [5], salts treated beech sawdust [6], waste materials [7], natural Luffa cylindrica fibres [8], sunflower seed shells [9], algal biomass based materials [10], wheat bran [11], guava (Psidium guajava) leaf powder [12], almond shells [13], dehydrated peanut hull [14], rubber wood sawdust [15], Moringa oleifera wood [16], Agave sisalana fibre [17] and wheat shells [18]. But however, adsorption capacity and regeneration capacity for further cycle is limited. Thus, subverting the above mentioned disadvantages, porous activated carbon prepared from date pits (Phoenix dactylifera (Figure 2) by phosphoric acid activation method is being adopted in this study. Further, efficiency of the adsorption process depends on the type of precursor we use and how it is being prepared.
This work aims at reducing the heating time and chemical usage to determine the optimum preparation conditions for effectively removing a particular pollutant of particular molecular weight from an aqueous solution. The effects of the activation temperature, activation time and the impregnation ratio on the surface and chemical properties of activated carbon are studied to determine the optimum preparation conditions. Response Surface Methodology (RSM) was used to optimize preparation parameters of AC for separately removing four such dyes: Methyl red (molecular weight – 269.30), Methylene blue (molecular weight – 319.85), Malachite green (molecular weight – 36.91), Methyl violet (molecular weight – 407.98) and molecules less than 2 nm size from aqueous solution.
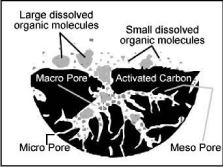
Figure 1: Structure of activated carbon.
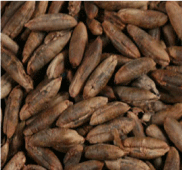
Figure 2: Raw date pits.
Materials and Methods
Materials
The Date pits were collected in bulk from small scale industries from a local village of virudhunagar district, Tamil Nadu. Phosphoric acid and hydrochloric acid were obtained from Ranbaxy Fine Chemicals Ltd, Chennai, India. Potassium iodide, iodine and sodium thiosulphate were procured from Sisco Research Laboratories, India. The dyes such as Methylene blue, Malachite green, Methyl violet and Methyl red were purchased from Sigma Aldrich Chemicals, India. All the chemicals used were of analytical grade. Distilled water was used for all the experimental purposes.
Preparation of activated carbon
The precursor was first cut into small pieces then washed with distilled water to remove undesirable impurities and dried in sunlight for 7 days and then at 80°C for 4 hours. The dried precursor was powdered and sieved through a 30 mesh sieve. The prepared precursor was then chemical activated with the use of phosphoric acid as activating agent. The precursor impregnated with 85 wt% phosphoric acid was placed in an autoclave and activated in a muffle furnace. The sample was heated in the absence of air to the activation temperature at a heating rate of 20°C/min and held at that temperature for the desired activation time. Activated carbon samples were prepared at different conditions by varying three factors namely activation time, activation temperature and the impregnation ratio. The impregnation ratio is defined as the ratio of dried weight of H3PO4 to the dried weight of precursor. These factors are varied at three levels each. After gradual cooling down to room temperature, the final activated product was repeatedly washed with hot distilled water until the wash water reaches constant pH. The washed carbon was dried in oven at 110°C for 24 hours, and finally kept in tightly closed bottles.
Characterisation of the Activated Carbon
Yield: The yield of the prepared activated carbon was calculated from the following formula,
Yield (%) = W2/W1*100 (1)
Where W1 and W2 are weights of the precursor and final activated carbon obtained respectively, both based on dry weight.
Iodine number: 1 g of the carbon samples were transferred to a clean, dry 250 mL Erlenmeyer flask. 10 mL of 5 wt % hydrochloric acid solution was pipetted into each flask. The flasks were closed and gently swirled until the carbon was completely wet. The contents of the flasks were allowed to boil gently for 30 ± 2s to remove any sulphur which may interfere with the results. The flasks were then removed from the hot plate and cooled to room temperature. To this, 100 mL of 0.1 N iodine solution was added and the flasks were shaken vigorously for 30±1 s. The contents of the flasks were filtered. 50 mL of the filtrate were taken in 250 mL Erlenmeyer flask and titrated against standardized 0.1 N sodium thiosulphate solutions until the solution turned pale yellow. 2 mL of the starch indicator was added to this solution and the titration was continued with sodium thiosulfate until the solution turned colourless. The volume of sodium thiosulphate used was recorded and the amount of iodine adsorbed per g of carbon dosage was calculated [19].
The value of iodine number can be calculated using,
where, X/M is iodine adsorbed per gram of activated carbon (mg/g), S is volume of sodium thiosulfate used (mL) and M is amount of activated carbon used (g).
A = (N1)x12693
B = (N2)x126.93
DF = (I + H)/F
N1 is the normality of iodine (N), N2 is the normality of sodium thiosulphate (N), DF is dilution factor, I is volume of iodine (mL), H is 5 % hydrochloric acid used (mL), and F is filtrate (mL).
Methylene blue, malachite green, methyl violet and methyl red number: A known weight of activated carbon was taken in four different conical flasks. 10 mL of 1500 mg/L MB dye, MG dye, MV dye and MR dye solution were added and shaken for 5 min. After the solution got decolorized, the addition of dye was continued to their respective flasks (1 mL at a time) till no further color change was observed. The decolorizing power was determined from the following equation [20].
Decolorizing power = (1.5×Vm) / M (3)
where Vm is the volume of dye solution consumed (mL), M is the amount of carbon sample taken (g).
Thermo gravimetric analysis (TGA): In order to determine general decomposition characteristics of the biomass source during the activation, the sample was subjected to thermo gravimetric analysis (Perkin Elmer Pyris TG/DTA). The volatile evolution during carbonization of the samples was monitored by TGA.
Scanning electron microscopy (SEM): In order to observe the surface morphology of the adsorbent, a scanning electron microscopic analysis of raw source and the activated sample was employed in this study. SEM images were recorded using JEOL JSM-6300F field emission.
Fourier transform infrared spectroscopy (FTIR): The surface functional groups of samples were analyzed through FTIR transmission spectra recorded using a FTIR spectrophotometer (FTIR-2000, Perkin-Elmer) in the wave number range of 4000-400 cm-1.
Experimental design – response surface methodology
Box-Behnken design: Although many techniques are available to optimize the response of interest which is influenced by several other variables, RSM is one of the simplest and the best [21,22]. The main advantage of this method is that it gives an understanding of how the desired process response is affected by the process variables, establishes all expected interactions among the process variables and depicts the combined effect of the test variables on the response. Also, when there is more than one response, it finds the compromise optimum rather than optimizing only one. It gives an understanding of how response changes in a given direction by adjusting the design variables. From literature, it was found that no studies has been conducted and reported for preparation of activated carbon from date pits by chemical activation adopting RSM as the optimization tool for optimising preparation parameters for removal of each dye.
A 3 level 3 factor Box Behnken (BBD) was performed using the software Design Expert 09.01.03 (Stat-Ease Inc. Minneapolis, USA) to find the interactive effects of the 3 factors, A (Temperature; °C), B (Time; min), C (Impregnation ratio). It is shown in (Table 1).
    Variables
    Symbol
    Coded factor levels


    -1
    0
    1


    Temperature
    A
    350
    400
    450


    Time
    B
    30
    60
    90


    Impregnation ratio
    C
    1
    2
    3
Table 1: Experimental design with factors and levels.
It requires only minimum number of experiments to be performed and also modeling is made possible by this method. In our case its only 17 runs for 3 factor 3 levels when Box Behnken method is used, instead of 27 runs using 2n factorial method.
Results and Discussion
Thermo gravimetric analysis of the raw date pits
TGA profile of date pits (Figure 3) shows two stages of weight loss. Weight loss from 57.79°C – 108.28°C showing 7.883 weight loss, can be attributed to the removal of moisture and volatile contents. The major weight loss of 46.02% observed from 283.79°C – 319.99°C shows the decomposition of hemicelluloses, cellulose and lignin. The decomposition temperatures of these fractions depend on the lignocellulosic material [23,24]. The decomposition temperature is found to be around 303.04°C which is in match with the literature value. At temperatures above 350°C, significant weight loss was not observed. Therefore, it can be stated that the temperatures above 350°C is more appropriate for activation.
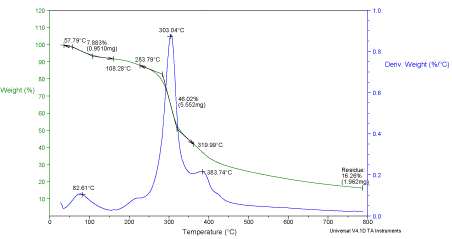
Figure 3: Thermo gravimetric analysis of date pits.
Chemical activation
Date pits source was chemically activated. As the preparation conditions vary, the surface properties and the pore structure of the prepared activated carbon will vary accordingly [25]. Hence the molecule which it can absorb varies with the preparation parameters. As already mentioned RSM was used to optimise the preparation parameters for the AC to effectively remove MB, MG, MV and MR dye and molecules of size < 2nm from the aqueous solution.
Development of regression model: As already mentioned, Box Behnken design [26,27] was used to develop a correlation between the preparation process variables and the responses - yield, iodine number (I No.), methyl red (MR No.), methylene blue (MB No.), malachite green number (MG No.) and methyl violet number (MV No.). If our aim is to prepare AC that has to separate out MB dye, then optimisation is done having yield and methylene blue number as response. Similarly for removing molecules of size < 2nm, the yield and iodine number were considered as the response. The optimisation part was done for all the adsorbents considered corresponding to the raw source.
The experimental data were analyzed using Design Expert. Three main analytical steps are
1. Analysis of variance (ANOVA)
2. Regression analysis
3. Plotting of response surface.
They were performed to establish an optimal condition for the activated carbon preparation. The highest order polynomials were chosen based on the sequential model sum of squares. The analysis suggested a quadratic model for all the responses except for methyl violet number for date pits source which fitted 2FI model. The model and factor significances were investigated using the variance analysis (ANOVA) from the F test and p-values at 95% confidence. If the value of Prob > F is less than 0.05, the model terms are considered as significant. In case if the terms are insignificant these terms can be removed from the model equation in order to increase the R2 value, so as to improve the fitting. After the insignificant terms are removed, these are the final experimental model obtained for each of the response. The responses yield, iodine number, methyl red number, methylene blue number, malachite green number and methyl violet number are named Y1, Y2, Y3, Y4, Y5 and Y6. The final experimental models in terms of coded factors for the responses are as follows:
Y1 = + 53.00- 4.80A- 5.00B- 1.91C+1.67AB+1.458A²- 1.17C² (6)
Y2 = + 979.40+ 25.51A+ 15.30B+ 6.16C- 32.60A²- 12.55B² (7)
Y3 = + 209.68 + 6.03A + 3.92B + 0.53C – 3.25AC – 1.74BC – 5.32A² (8)
Y4 = + 215.58- 1.95A+ 4.72B+ 3.94C+ 3.65AC- 19.520A²-16.66B²- 21.57C² (9)
Y5 = + 288.8+ 28.51A+ 22.19B+ 15.42C+ 15.53AB+ 8.65AC+ 9.61BC- 3.06C2 (10)
Y6 = + 313.76+ 34.91A+ 21.21B+ 15.38C+ 19.08AB+ 16.53AC+ 9.89BC (11)
Negative sign in the above equations indicate antagonistic effect, whereas positive sign indicates synergistic effect. The proximity of R2 value to unity, indicate the suitability of the model equation. The R2 values of all the responses are relatively high, indicating good agreement between experimental data and the model prediction.
The ANOVA of the models chosen corresponding to the responses Y1, Y2, Y3, Y4, Y5 and Y6 are given in (Table 2-7). ANOVA is mainly involved to examine the quality of the proposed model. From the ANOVA table, for activated carbon yield (Table 2), an F-value of 195.52 and Prob > F of less than 0.0001 prove the significance of the model. Also the model terms A, B and C and their interaction terms shown in Table had Prob > F values less than 0.05 indicating that all are significant. Also the higher values of R² (0.92) and R²adj (0.944) confirms that the postulated model is suitable to be used within the range of factors analyzed.
    ANOVA for Response Surface    Reduced Quadratic model


    Analysis of variance table    [Partial sum of squares - Type III]


    Sum of

    Mean
    F
    p-value


    Source
    Squares
    df
    Square
    Value
    Prob    > F


    Model
    14015.12
    7
    2002.16
    195.52
    < 0.0001
    significant


    A-temperature
    6500.34
    1
    6500.34
    634.79
    < 0.0001


    B-time
    3938.24
    1
    3938.24
    384.59
    < 0.0001


    C-impregnation ratio
    1902.83
    1
    1902.83
    185.82
    < 0.0001


    AB
    965.31
    1
    965.31
    94.27
    < 0.0001


    AC
    299.12
    1
    299.12
    29.21
    0.0004


    BC
    369.6
    1
    369.6
    36.09
    0.0002


    C^2
    39.68
    1
    39.68
    3.88
    0.0805


    Residual
    92.16
    9
    10.24


    Lack of Fit
    91
    5
    18.2
    62.73
    0.0007
    significant


    Pure Error
    1.16
    4
    0.29


    Corrected Total
    14107.28
    16
Table 2:  Analysis of variance (ANOVA) for response surface quadratic model for
activated carbon yield.
    ANOVA for Response Surface    Reduced Quadratic model


    Analysis of variance table    [Partial sum of squares - Type III]


    Sum of

    Mean
    F
    p-value


    Source
    Squares
    df
    Square
    Value
    Prob    > F


    Model
    13653.43
    9
    1517.05
    115.31
    < 0.0001
    significant


    A-temperature
    5799.32
    1
    5799.32
    440.81
    < 0.0001


    B-time
    4519.44
    1
    4519.44
    343.53
    < 0.0001


    C-impregnation ratio
    1902.83
    1
    1902.83
    144.64
    < 0.0001


    A^2
    64.68
    1
    64.68
    4.92
    0.0261


    B^2
    1.32
    1
    1.32
    0.1
    0.034


    Residual
    92.09
    7
    13.16


    Lack of Fit
    90.93
    3
    3.31
    14.46
    0.0703
    not significant


    Pure Error
    1.16
    4
    0.29


    Corrected Total
    13745.52
    16
Table 3:  Analysis of variance (ANOVA) for response surface quadratic model for
Iodine Number.
    ANOVA for Response Surface    Reduced Quadratic model


    Analysis of variance table    [Partial sum of squares - Type III]


    Sum of

    Mean
    F
    p-value


    Source
    Squares
    df
    Square
    Value
    Prob    > F


    Model
    362.21
    9
    40.25
    15.63
    0.0008
    significant


    A-temperature
    32.4
    1
    32.4
    12.59
    0.0094


    B-time
    47.06
    1
    47.06
    18.28
    0.0037


    C-impregnation ratio
    99.67
    1
    99.67
    38.72
    0.0004


    AC
    0.16
    1
    0.16
    0.064
    0.008


    BC
    17.78
    1
    17.78
    6.91
    0.034


    A^2
    36.99
    1
    36.99
    14.37
    0.0068


    Residual
    18.02
    7
    2.57


    Lack of Fit
    14.43
    3
    4.81
    5.36
    0.0693
    not significant


    Pure Error
    3.59
    4
    0.9


    Corrected Total
    380.23
    16
Table 4:  Analysis of variance (ANOVA) for response surface quadratic model for
Methyl Red Number.
    ANOVA for Response Surface    Reduced Quadratic model


    Analysis of variance table    [Partial sum of squares - Type III]


    Sum of

    Mean
    F
    p-value


    Source
    Squares
    df
    Square
    Value
    Prob    > F


    Model
    5751.87
    7
    821.7
    57.76
    < 0.0001
    significant


    A-Temperature
    30.3
    1
    30.3
    2.13
    0.1785


    B-Time
    178.3
    1
    178.3
    12.53
    0.0063


    C-Impregnation ratio
    124.49
    1
    124.49
    8.75
    0.016


    AC
    53.3
    1
    53.3
    3.75
    0.0849


    A^2
    1629.63
    1
    1629.63
    114.55
    < 0.0001


    B^2
    1190.54
    1
    1190.54
    83.69
    < 0.0001


    C^2
    1988.23
    1
    1988.23
    139.76
    < 0.0001


    Residual
    128.03
    9
    14.23


    Lack of Fit
    112.47
    5
    22.49
    5.78
    0.057
    not significant


    Pure Error
    15.56
    4
    3.89


    Corrected Total
    5879.91
    16
Table 5:  Analysis of variance (ANOVA) for response surface quadratic model for
Methylene Blue Number.
    ANOVA for Response Surface    Reduced Quadratic model


    Analysis of variance table    [Partial sum of squares - Type III]


    Sum of

    Mean
    F
    p-value


    Source
    Squares
    df
    Square
    Value
    Prob    > F


    Model
    14015.12
    7
    2002.16
    195.52
    < 0.0001
    significant


    A-Temperature
    6500.34
    1
    6500.34
    634.79
    < 0.0001


    B-Time
    3938.24
    1
    3938.24
    384.59
    < 0.0001


    C-Impregnation ratio
    1902.83
    1
    1902.83
    185.82
    < 0.0001


    AB
    965.31
    1
    965.31
    94.27
    < 0.0001


    AC
    299.12
    1
    299.12
    29.21
    0.0004


    BC
    369.6
    1
    369.6
    36.09
    0.0002


    C^2
    39.68
    1
    39.68
    3.88
    0.0805


    Residual
    92.16
    9
    10.24


    Lack of Fit
    91
    5
    18.2
    62.73
    0.0007
    significant


    Pure Error
    1.16
    4
    0.29


    Corrected Total
    14107.28
    16
Table 6:  Analysis of variance (ANOVA) for response surface quadratic model for
Malachite Green Number.
    ANOVA for Response Surface    Reduced Quadratic model


    Analysis of variance table    [Partial sum of squares - Type III]


    Sum of

    Mean
    F
    p-value


    Source
    Squares
    df
    Square
    Value
    Prob    > F


    Model
    13395.73
    6
    2232.62
    210.14
    < 0.0001
    significant


    A-Temperature
    4962.07
    1
    4962.07
    467.05
    < 0.0001


    B-Time
    3598.91
    1
    3598.91
    338.74
    < 0.0001


    C-Impregnation ratio
    1893.59
    1
    1893.59
    178.23
    < 0.0001


    AB
    1456.95
    1
    1456.95
    137.13
    < 0.0001


    AC
    1092.96
    1
    1092.96
    102.87
    < 0.0001


    BC
    391.25
    1
    391.25
    36.83
    0.0001


    Residual
    106.24
    10
    10.62


    Lack of Fit
    94.08
    6
    15.68
    5.15
    0.0672
    not significant


    Pure Error
    12.17
    4
    3.04


    Corrected Total
    13501.97
    16
Table 7:  Analysis of variance (ANOVA) for response surface quadratic model for
Methyl Violet Number.
Similarly, the ANOVA tables obtained for the rest of the responses (Table 3-7) F values were found to be 115.31, 15.63, 57.76, 195.52, 210.14 and Prob > F were also less than 0.0001. These statistical test results show the validity of the chosen model. The predicted yield and adsorption capacity values from the above equations are given in (Table 8, Figure 4) shows the comparison between the adsorption capacities obtained through experiments and that predicted by Eq. (6) to (11). The final model can be used to create graphical representations of the parameter dependencies, e.g., as contour plots, to see the relative influence of the parameters and to find an optimum parameter combination. The predicted values got from RSM model were then compared with the actual values to examine if they are close enough to test the compatibility of the model.
    Run order
    (A)
    (B)
    (C)
    Yield
    I N
    MRN
    MBN
    MGN
    MVN


    Actual value
    Predicted value
    Actual value
    Predicted value
    Actual value
    Predicted value
    Actual value
    Predicted value
    Actual value
    Predicted value
    Actual value
    Predicted value


    1
    400
    60
    2
    59.57
    58.52
    980.1
    979.4
    210.3
    209.68
    212.47
    215.58
    288.56
    288.89
    314.56
    313.76


    2
    400
    60
    2
    58.92
    58.52
    981.8
    979.4
    210.8
    209.68
    215.12
    215.58
    288.57
    288.89
    313.21
    313.76


    3
    350
    30
    2
    56.76
    57.18
    909.2
    905.99
    195.2
    194.4
    172
    176.63
    251.53
    253.74
    284.65
    286.73


    4
    400
    60
    2
    58.07
    58.52
    981.2
    979.4
    210.9
    209.68
    216.08
    215.58
    288.62
    288.89
    314.59
    313.76


    5
    350
    60
    1
    55.86
    53.67
    910.6
    902.58
    195.6
    194.55
    177.89
    176.14
    255.86
    250.55
    286.85
    290


    6
    400
    60
    2
    57.83
    58.52
    982.7
    979.4
    209.7
    209.68
    216.76
    215.58
    288.49
    288.89
    316.85
    313.76


    7
    400
    90
    3
    43.65
    43.51
    999.5
    988.3
    212.3
    212.39
    185.56
    186.01
    331.56
    333.05
    356
    360.25


    8
    400
    30
    1
    55.39
    56.68
    939.6
    945.39
    201.6
    203.48
    172.65
    168.68
    254.85
    257.84
    290.56
    287.06


    9
    450
    30
    2
    51.78
    52.03
    961.5
    957.01
    207.4
    206.47
    175.68
    172.74
    279.79
    279.68
    298.25
    298.37


    10
    450
    60
    3
    40.25
    40.33
    965.3
    965.92
    206.6
    207.68
    178.39
    180.14
    337.58
    338.41
    369.56
    370.58


    11
    400
    60
    2
    58.21
    58.52
    981.2
    979.4
    210.2
    209.68
    217.46
    215.58
    288.76
    288.89
    316.5
    313.76


    12
    450
    90
    2
    40.86
    40.44
    982.5
    987.61
    215.4
    214.32
    185.47
    182.18
    357.56
    355.12
    382.5
    378.96


    13
    450
    60
    1
    45.12
    45.21
    954.6
    953.61
    212
    213.11
    160.47
    164.95
    293.26
    290.27
    301.64
    306.75


    14
    350
    90
    2
    52.45
    52.2
    923.5
    936.59
    199.2
    202.25
    184.47
    186.07
    267.17
    267.04
    292.56
    290.98


    15
    400
    90
    1
    47.59
    48.4
    972.5
    975.99
    214.8
    214.82
    176.89
    178.12
    277.67
    282.98
    309.54
    309.7


    16
    350
    60
    3
    46.76
    48.78
    916.5
    914.89
    203.2
    202.1
    181.21
    176.73
    265.59
    264.1
    288.65
    287.71


    17
    400
    30
    3
    53.76
    51.8
    945.2
    957.7
    206.1
    208.03
    174.29
    176.57
    270.29
    269.46
    297.46
    298.05
Table 8: Actual and model predicted values of yield, IN, MRN, MBN, MGN and MVN by Box Behnken design.
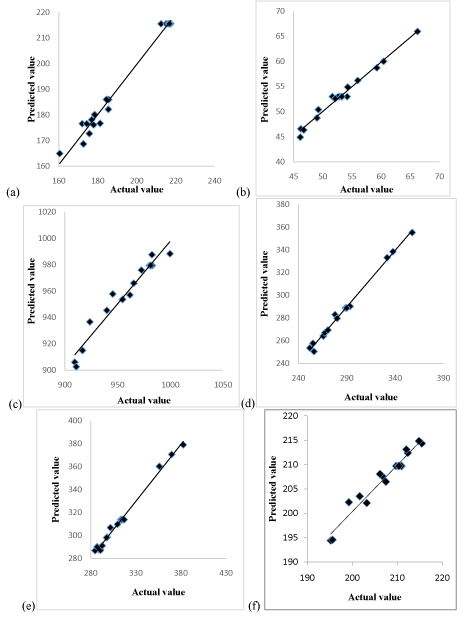
    Figure 4:  Comparison plot between the experimental and model predicted (a)
Yield (b) IN (c) MBN (d) MGN (e) MVN (f) MRN.
Interaction effects of the preparation parameters on the yield: The yield and adsorption capacities of the prepared activated carbon (ACDP) over different combinations of independent variables were visualized through three-dimensional view of response surface plots (Figure 5 (a), (b) and 6 (a) to 5 (h)). The plots were represented as a function of two factors at a time, holding other factors at a fixed level.
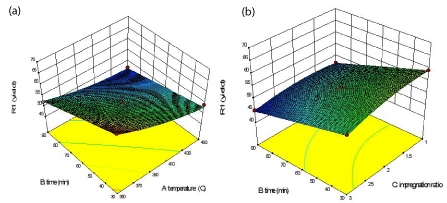
    Figure 5:  3D response surface: (a) Interactive effects of temperature and
time on yield (b) Interactive effects of time and impregnation ratio on yield.
Effect of AC preparation variables on the AC yield is shown in the (Figure 5 (a) and (b) which represent the effect of activation temperature and time on the yield, with impregnation ratio fixed at zero level (i.e., IR = 2) and the effect of time and impregnation ratio on the yield, with temperature fixed at zero level (i.e., T = 400°C). The carbon yield was found to decrease with increasing activation temperature, activation time and IR. From the (Figure 5(a)), as the time and temperature was increased from 30 min to 90 min and 350°C to 450°C respectively, yield decreased. From both figures, it can be seen that activation temperature was more influential than the other two variables. However, the maximum yield was observed when all these factors were set to the minimum value in the range studied. This result was found to be in agreement with the work done by Ahmad et al. and Islay et al., [2,23] which found that activation temperature plays a crucial role on the yield of activated carbon prepared by rattan sawdust and grape stalk whereas activation time did not show much effect on the carbon yield. Overall weight loss was found to increase with increasing temperature, resulting in decreasing yield of activated carbon at high temperature. As a result of removal of volatile matters during the dehydration and elimination reactions and increased rate of CO2 formation reaction, the overall weight loss was found to increase with increasing temperature thus lowering the yield. Coming to impregnation ratio, (Figure 5(b)) shows that increased impregnation ratio results in increased carbon burn-off and decreased yield. This can be attributed to the increased breakage of carbon bonds with increased amount of oxidising agent thus promoting more of coal decomposition during pyrolysis.
Referring to (Table 3), all the three factors were found to be significantly influencing the response for activated carbon yield, with activation temperature imposing the greatest effect on it, while the other two showed almost similar and moderate effect on this response. However, the interaction effects between the variables were all less significant. Similarly, (Figure 5(a) and (b)) shows the influence of time on the yield, indicating that the increased activation time causes decrease in yield as well.
Interaction effects of the preparation parameters on the adsorption characteristics: MB / MG / MV / MR number: The effect of various preparation parameters on the adsorption characteristics of the prepared AC was investigated and the results are shown in (Figure 6(a) to (h)). It was observed that the pore size and hence the surface area of the samples significantly increased with raise in the activation temperature holding the other factors constant. Similar results were observed when the activation time and impregnation ratio was increased maintaining the other factors constant. It can be well said that most of the organic substances have got degraded and discharged both as gas and liquid tars hence leaving high purity carbon with high porosity at higher levels of these parameters. With this investigation of the influence of the factors, the next step of optimisation was carried out.
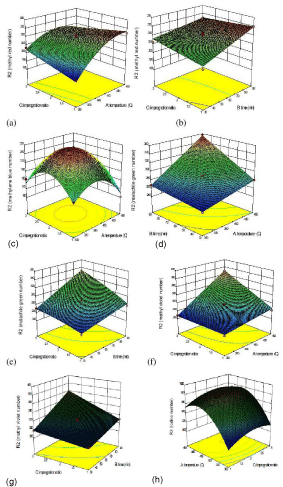
    Figure 6:  3D response surface: (a) Interactive effects of impregnation ratio
and temperature on MRN. (b) Interactive effects of impregnation ratio
and time on MRN. (c) Interactive effects of temperature and impregnation
ratio on MBN (d) Interactive effects of time and temperature on MGN. (e)
Interactive effects of time and impregnation ratio on MGN. (f) Interactive
effects of temperature and impregnation ratio on MVN. (g) Interactive effects
of impregnation ratio and time on MVN. (h) Interactive effects of temperature
and impregnation ratio on IN.
Optimization of preparation parameters: Optimization was carried out after observing all the interaction effects between the preparation variables [28]. A set of solutions were generated by the Design-Expert software, to determine the optimum conditions of the process. The optimization study was performed by considering the range of variables used in the experiment (i.e., activation temperature 350°C - 450°C; adsorption time 30-90 min; impregnation ratio 1-3) for the maximum response. Initially, the optimization was started at any random value of the individual variables by fixing the target of maximum adsorption capacity and obtaining the optimum values of the variables for the preparation process.
The experiment was conducted at the optimized conditions (Table 9) and a comparison between the experimental values and model predicted results was found to be good, as in (Table 10).
    Source
    Adsorbate
    Molecular weight
      (g/mol)
    Activation temperature    (◦C)
    Activation time
      (min)
    Impregnation ratio


    Date pits
    IN
    253.81
    416.05
    90
    2.00687


    MR
    269.3
    360.67◦C
    33.95
    2.474


    MB
    319.85
    370.284
    48.29
    1.93


    MG
    364.91
    420.117
    52.78
    2.03


    MV
    407.98
    449.37
    68.991
    2.959
Table 9: Optimum preparation conditions for different molecular size.
    Adsorbate
    Yield
    Adsorptive capacity


    Predicted
    Experimental
    Predicted
    Experimental


    IN
    46.633
    47.286
    999.57
    998.24


    MR
    62.3627
    60.548
    200.415
    198.29


    MB
    59.102
    57.989
    205.174
    204.648


    MG
    50.695
    50.241
    309.04
    306.463


    MV
    43.44
    45.175
    383.619
    380.214
Table 10:  Comparison of predicted and experimental response values for the AC
prepared at optimum conditions.
Scanning electron microscopy (SEM)
Scanning electron micrographs shown in (Figure 7) shows the surface morphology of the raw date pits source. SEM images are observed to be irregular clumps and not much pores were observed. The surface of the date pits is moderately smooth, has less cracks and voids than the activated carbon prepared.
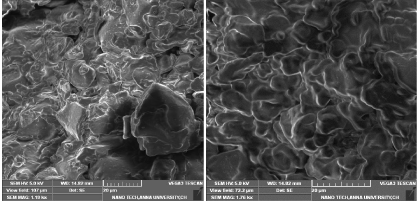
Figure 7: SEM image of raw date pits (RDP).
SEM image of ACDP prepared at optimum conditions for MB removal is shown in the (Figure 8). The thick wall in the raw material opened and wider porosity was created by the activation. It can be confirmed that the activated carbon prepared has porous surface with cracks, channels, large holes and well pronounced array of structures. The surface morphology of the activated carbon samples prepared for the removal of other dyes is similar to that obtained for MB removal.
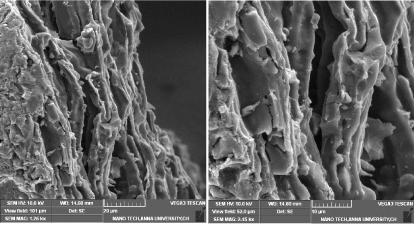
    Figure 8:  SEM image of ACDP prepared at optimum conditions for MB
removal.
Fourier transform infrared spectroscopy (FTIR)
The surface chemistry of samples was analyzed through FTIR transmission spectra (Figure 9) recorded using a FTIR spectrophotometer in the wave number range of 4000 - 400 cm-1. In the FTIR spectrum obtained for the precursor, the band at about 3736 and 3432 cm-1 was attributed to vibrations in hydroxyl groups. The vibrational peak at 2926 and 2855 cm-1 can be due to the C-H stretching vibrations. The band located around 2344 and 2359 cm-1 corresponds to atmospheric carbon dioxide. The peaks observed at 1751, 1602, 1252, 1165, 1115, 813, 670 cm-1 are due to the C=O, C-C, C-N, alkyl halides, =C-H bending vibration and N-H/alkene/alkyne stretching vibrations respectively.
Similar groups were found in the activated carbon sample prepared for MB removal when compared with RDP. Not much peaks were observed in the FTIR spectrum of ACDP which may be due to the hydrolysis effect of H3PO4 resulting in the decomposition of these groups and subsequent release of their byproducts as volatile matter. The surface functional groups of the other activated carbon samples were also analysed and the peaks obtained are similar to that of ACDP for MB removal.
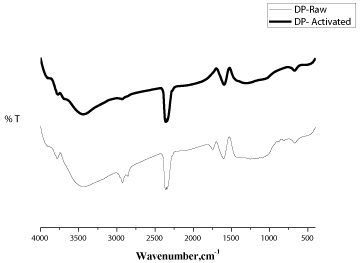
Figure 9: FTIR spectra of RDP and ACDP.
Conclusion
Date pits, a waste biomass can be picked to be a better precursor for preparing activated carbon by chemical activation with phosphoric acid. As the preparation parameters were found to directly influence the surface properties, the activated carbon can be tailor-made to suit the need. The activation process was confirmed by the well developed pore structure seen in SEM image and the FTIR analysis. The significant effect of three important process parameters were investigated systematically and optimised preparation condition was determined for the prepared ACDP to separate out different dyes of varying molecular weight range using RSM. This work showed that the effectiveness of an adsorbent lies in the way it is prepared and tuning the preparation condition directly has effect on the pore structure. Hence depending upon the size of the molecule we can use the particular preparation condition which is generalised for that molecular size range for a specific source.
References
- Ayhan Demirba, Biomass resource facilities and biomass conversion processing for fuels and chemicals, 2001; 42: 1357-1378.
- Jon Van Gerpen, Biodiesel processing and production, University of Idaho, Moscow, ID 83844, USA, Fuel Processing Technology, 2005; 86: 1097–1107.
- L D Klass, Biomass for Renewable Energy, Fuels and Chemicals, Academic Press New York 1998; 1-2.
- Md A Hossain, Shabab M Chowdhury, YaminRekhu, Khandakar S. Faraz, and MonzurUl Islam, Biodiesel from Coconut Oil: A Renewable Alternative Fuel for Diesel Engine, World Academy of Science, Engineering and Technology, 2012; 68: 1289-1293.
- M Thirumarimurugan, V M Sivakumar, A Merly Xavier, D Prabhakaran, and T Kannadasan, Preparation of Biodiesel from Sunflower Oil by Transesterification, International Journal of Bioscience, Biochemistry and Bioinformatics, 2012; 2:441-444.
- P V Rao, Effect of properties of Karanja methyl ester on combustion and NOx emissions of a diesel engine, Journal of Petroleum Technology and Alternative Fuels 2011; 2: 63-75.
- TitipongIssariyakul, Mangesh G Kulkarni, Ajay K Dalai, Narendra N Bakhshi, Production of biodiesel from waste fryer grease using mixed methanol/ethanol system, Fuel Processing Technology 2007; 88: 429-436.
- S.P. Singh, Dipti Singh, Biodiesel production through the use of different sources and characterization of oils and their esters as the substitute of diesel: A review, J. of Renewable and Sustainable Energy Reviews 2010; 14: 200–216.
- D P Deshpande , Y D Urunkar and P D, Thakare P D, Production of Biodiesel from Castor Oil using acid and Base catalysts, Research Journal of Chemical Sciences 2012; 2: 51-56.
- D Prafulla, Patil, Veera Gnaneswar Gude, Harvind K Reddy, TapaswyMuppaneni, and Shuguang Deng, Biodiesel Production from Waste Cooking Oil Using Sulfuric Acid and Microwave Irradiation Processes, Journal of Environmental Protection 2012; 3: 107-113.
- M A Olutoye and B H Hameed, Production of biodiesel fuel by transesterification of different vegetable oils with methanol using Al2O3 modified MgZnO catalyst, Bioresource Technology 2013; 132: 103-108.
- Xia ohu Fan, Xi Wang, and Feng Chen, Biodiesel Production from Crude Cottonseed Oil: An Optimization Process Using Response Surface Methodology, The Open Fuels & Energy Science Journal 2011; 4: 1-8.
- Hem Chandra Joshi, Joe Toler, Terry Walker, Optimization of Cottonseed Oil Ethanolysis to Produce Biodiesel High in Gossypol Content,Journal of Oil and Fat Industries, 2008;85: 357-363.
- LyesTarabet, KhaledLoubar, Mohand Said Lounici, Samir Hanchi, and Mohand Tazerout, Biodiesel as an Alternative to Diesel Fuel: Preparation and Tests on DI Diesel Engine, Hindawi Publishing Corporation Journal of Biomedicine and Biotechnology, 2012; 3: 144-149.
- Rajarshi Kar, Oindrila Gupta, and Mukundu Kumar Das, Biodiesel production and process optimization, International Journal of Scientific and Research Publications 2012; 2: 2250-3153.
- Zayed Al-Hamamre, JehadYamin, Parametric study of the alkali catalyzed transesterification of waste frying oil for Biodiesel production, Energy conversion and management 2014; 79: 246-254.
- K Ajaygiri, G A Goswami, Usmani, Study of Process Parameters of Biodisel Production from Cottonseed Oil, IPCBEE, 2014; 66: 102-105.
- Anikeev, E Yu Yakovleva, Biodiesel synthesis from vegetable oils with supercritical methanol, 2013; 77: 100–102.
- Xiaohu Fan, Rachel Burton and Greg Austic, Preparation and Characterization of Biodiesel Produced from Recycled Canola Oil, The Open Fuels & Energy Science Journal 2009; 2: 113-118.
- Oguntola J Alamu, Opeoluwa Dehinbo, and Adedoyin M Sulaiman, Production and Testing of Coconut Oil Biodiesel Fuel and its Blend,Leonardo Journal of Sciences, 2010; 16: 95-104.
- Ch Satyanarayana and P V Rao, Influence of Key Properties of Pongamia Biodiesel on Performance Combustion and Emission Characteristics of a DI Diesel Engine, WSEAS Trans. on Heat and Mass Transfer 2009; 4: 34-44.
- Yomi Watanabe, Yuji Shimada, Akio Sugihara, Hideo Noda, Hideki Fukuda, and Yoshio Tominaga, Continuous Production of Biodiesel Fuel from Vegetable Oil Using Immobilized Candida Antarctica Lipase, JAOCS 2012; 77: 10-14.
- P V Rao, Experimental Investigations on the Influence of Properties of Jatropha Biodiesel on Performance, Combustion, and Emission Characteristics of a DI-CI Engine, World academy of science, engineering and technology 2011;75: 855-868.
- Edward Crabbe, CiriloNolasco-Hipolito, Genta Kobayashi, Kenji Sonomoto, AyaakiIshizaki, Biodiesel production from crude palm oil and evaluation of butanol extraction and fuel properties, J. of Process Biochemistry 2001; 37: 65–77.