
Research Article
Austin Chem Eng. 2016; 3(4): 1039.
Experimental Investigation on Pem Fuel Cell with Different Membrane Electrode Assemblies (Mea’s) and Different Flow Geometry
Sasidhar DY*, Sarma AJN and Naidu SV
Department of Chemical Engineering, Andhra University, Visakhapatnam, India
*Corresponding author: D Yogendra Sasidhar, Department of Chemical Engineering, Andhra University, Visakhapatnam, India
Received: July 28, 2016; Accepted: August 22, 2016; Published: August 24, 2016
Abstract
Fuel cell is an electrochemical device which converts chemical energy directly into electricity over the past decades; much attention has been focused upon the research and development of PEM fuel cells as power sources for stationary and portable applications because of their high energy conversion efficiency and near zero pollutant emission.
The performance of single cell Proton Exchange Membrane (PEM) fuel cell having 50cm2 area with three types of Membrane Electrode Assembly (MEA) consisting the platinum loading of 10%, 20% and 40% has been studied. In this study, a significant number of experimental tests to PEM fuel cell were conducted to investigate the effect of various parameters such as cell temperature, anode & cathode gas flow rates and flow field plates. The experimental results are presented in the form of polarization and power curves which shows the effect of various operating parameters on cell performance.
Keywords: Proton Exchange Membrane; Membrane electrode assembly; Fuel cell; Proton exchange membrane fuel cell
Introduction
Fuel cell is one of the device which can convert chemical energy into electrical energy directly and hence has higher energy conversion efficiency, In Fuel cell proton exchange membrane fuel cell (PEMFC) having high power density, easy maintenance, low operating temperature and main advantage of fuel cell was higher energy efficiency and zero emission pollutants.
The performance of single cell Proton Exchange Membrane (PEM) fuel cell having 50cm2 area with three types of Membrane Electrode Assembly (MEA) consisting the platinum loading of 10%, 20% and 40% has been studied. In this study, a significant number of experimental tests to PEM fuel cell were conducted to investigate the effect of various parameters such as cell temperature, anode & cathode gas flow rates and flow field plates. The experimental results are presented in the form of polarization and power curves which shows the effect of various operating parameters on cell performance.
Description of Experimental Setup
The experimental setup contains a single PEM fuel cell with an active surface area of 50cm2. The fuel cell contains a Membrane Electrode Assembly (MEA) sandwiched it was placed between flow field plates, current collector plates and end plates. The experimental setup also consists of three storage cylinders containing high-purity (99%) hydrogen, nitrogen and oxygen respectively, for using in fuel cell apparatus. The experimental setup also consists of a fuel cell test station containing instruments to measure voltage, current, power and resistance. Hydrogen and oxygen are humidify with humidification chambers (bottles or tanks) before they enter the fuel cell. This will ensure that the membrane used in the membrane electrode assembly does not dehydrate and crack under stress (Figure 1).
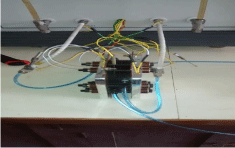
Figure 1: Photograph of Single PEM Fuel Cell Experimental Setup.
Operating procedure for the fuel cell test station:
- Connect the Fuel Cell Test Station and Gas Management Unit to 230V AC mains.
- Connected the H2, O2 and N2 gas cylinders to the Gas Management Unit using polyurethane tubes of 6mm diameter.
- Cylinder pressure was adjusted for each of the gas cylinders to optimum level using the regulator knobs.
- Humidifiers inside the Gas Management Unit were filled with 75% distilled water capacity and humidification temperature was adjusted.
- Switch on the power supply to the Gas Management Unit and the Fuel Cell Test Station. All control parameters like O2 humidifier temperature, H2 humidifier temperature, Fuel Cell temperature, Water temperature, O2 inlet pressure and H2 inlet pressure were set using the appropriate controllers.
- Gas connections and power supply connections were rechecked.
- Switch on the power supply to the Fuel Cell Test Station.
- Change to Auto / Manual and used Normal mode to operate.
- Switch on the DC electronic load bank, set the voltage at 0.3V, then press the load ON button and note down the current reading at 0.3V. Similarly, repeat the procedure for the voltage values changing from 0.3 to 0.8 V.
- Change the basic parameters of fuel cell specification like cell temperature, anode gas flow rate (H2), cathode gas flow rate (O2).
Experimental Results
The results are obtained by considering three types of MEAs based on catalyst loading with the same NAFION 115 membrane. The Membrane Electrode Assembly consisting of 10% Pt loading will be considered as MEA-I. Similarly the Membrane Electrode Assembly consisting of 20% Pt loading will be considered as MEA-II and the Membrane Electrode Assembly consisting of 40% Pt loading will be called as MEA-III in our presentation. The experimental results are obtained by using these three MEAs by considering the variables as shown in below table 1.
    Cell operating temperature (oC    )
    303 & 313K


    Hydrogen flow rates (lpm)
    0.3 & 0.5 lpm


    Oxygen flow rates (lpm)
    0.3 & 0.5 lpm


    Type of flow field plate
    Serpentine, Inter-digitated ,
      and 2-Serpentine
Table 1: Parameter Range.
Results and Discussions
Membrane Electrode Assembly with Pt/C Loading of 10% - (MEA-I).
Effect of cell operating temperature
Temperature has a strong influence on transport phenomena inside the fuel cell and open circuit voltage. Experimental results are obtained by varying the cell operating temperatures from 303K to 313K. During the experiments, the mass flow rates of both hydrogen and oxygen are maintained at 0.3 lpm and platinum catalyst loading at 10%.
Figure 2 shows that the performance of the fuel cell increases with an increase in cell temperature from 303 K to 313 K. It can be observed from Figure 2 that the exchange current density increases with an increase in fuel cell operating temperature, which reduces activation losses. This is because at low current densities the membrane material in the catalyst layer may not be fully hydrated causing a decrease in the active surface area of the catalyst; so with the increase of current density, the water production rate increases ensuring better hydration of the membrane material in the catalyst layer, which increases the active surface area of the catalyst layer and leads to improvement of fuel cell performance. The polarization and power curves are shown in Figure 2 and Figure 3.
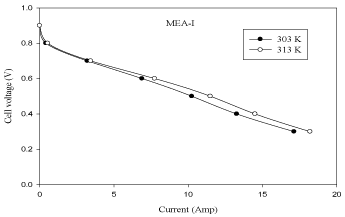
Figure 2: Effect of temperature in MEA with 10% pt loading (V-I curve).
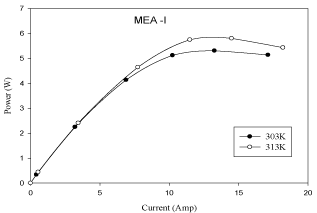
Figure 3: Effect of temperature in MEA with 10% pt loading (P-I Curve).
Effect of anode gas flow rate (H2)
Experimental results are obtained by changing the anode gas flow rates (H2) between 0.3 lpm and 0.5 lpm respectively while the other operating parameters are kept constant (cell operating temperature = 313K, platinum catalyst loading (Pt) = 10% and cathode gas flow rate = 0.3 lpm). The effect of anode gas flow rate on cell performance is studied with the flow geometry of serpentine flow field.
The effect of anode gas flow rate on cell performance is shown cell increases with the increase in anode gas flow rate from 0.3 lpm to 0.5 lpm. It is observed from figure 5 that one can increase the limiting current and power by increasing the flow rate of hydrogen. A sudden drop in the voltage indicates zero concentration of hydrogen on the catalyst surface. The current corresponding to this point of zero concentration of H2 is called limiting current. A fuel cell cannot produce more than the limiting current because no reactants exist at the catalyst surface beyond the point of zero concentration. The polarization and power curves are shown in Figures 4 and Figure 5.
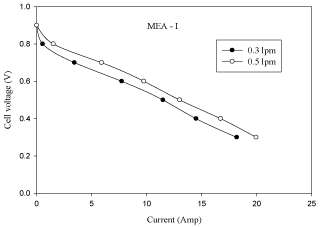
    Figure 4:  Effect of anode gas flow rate in MEA with 10% pt loading (V-I
curve).
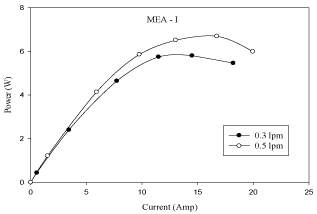
    Figure 5:  Effect of anode gas flow rate in MEA with 10% pt loading (P-I
curve).
Effect of cathode gas flow rate (O2)
Experimental results are obtained by varying the cathode gas flow rate (O2) between 0.3 lpm and 0.5 lpm respectively while the other operating parameters are kept constant (cell operating temperature = 313K, platinum catalyst loading (Pt) = 10% and anode gas flow rate = 0.3 lpm). The effect of cathode gas flow rate on cell performance is studied with the flow geometry of serpentine flow field.
The effect of cathode gas flow rate on cell performance is shown in figure 6. From the figure 6 it is observed that the performance of fuel cell increases with the increase of cathode gas flow rate from 0.3 lpm to 0.5 lpm. It is observed from figure 6 that as the oxygen flow rate is increased, there is an increase in cell voltage. The reason attributed to this phenomenon is that by increasing oxygen flow at the cathode catalyst layer, there is a high carryover of water by oxygen. The polarization and power curves are shown in figures 6 and Figure 7.
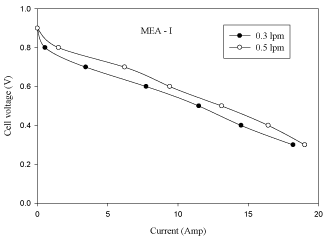
    Figure 6:  Effect of anode gas flow rate in MEA with 10% pt loading (V-I
curve).
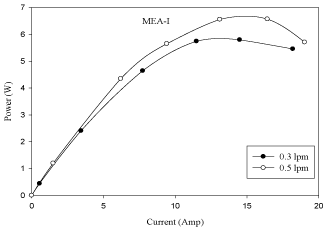
    Figure 7:  of anode gas flow rate in MEA with 10% pt loading (P-I
curve).
Effect of flow field plates
Flow field plate design also plays an important role on cell performance of a PEMFC. The experimental results are obtained for three different flow fields namely, single-serpentine (1-serpentine), double-serpentine (2-serpentine) and inter-digitated at a cell operating temperature of 313K, anode and cathode gas flow rates of 0.5 lpm and 0.5 lpm and platinum catalyst loading of 10%. From Figure 8 and Figure 9 it is observed that inter-digitated flow field gives the better performance than single-serpentine and double-serpentine flow field plates. This is due to the presence of dead ends (availability of gas concentrations is more at the respective sides), the active transport of reactants in close vicinity to the electrode. Therefore, the diffusion of gas is more in inter-digitated flow field than in 1-serpentine and 2-serpentine flow fields.
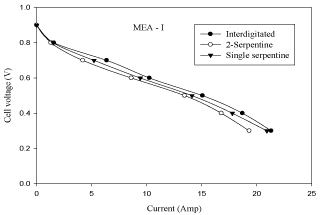
Figure 8: Effect of flow field plate in MEA with 10% pt loading (V-I curve).
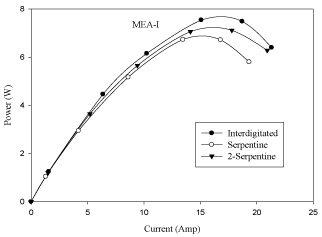
Figure 9: Effect of flow field plate in MEA with 10% pt loading (P-I curve).
Conclusion
- The fuel cell performance is enhanced as the cell operating temperature increases from 303K to 313K. This is due to increase of membrane conductivity, gas diffusivity and the exchange current density at higher temperature.
- The performance of fuel cell increases with an increase in anode gas flow rate (H2) from 0.3 lpm to 0.5 lpm and the maximum current obtained at 0.5 lpm is 23.82 amps for MEA-III (40% Ptloading) at 0.3 V.
- The performance of fuel cell increases with an increase in cathode gas flow rate (O2) from 0.3 lpm to 0.5 lpm due to sufficient oxygen being maintained on the cathode catalyst layer and carryover of water by cathode gas (O2).
- At same operating conditions, inter-digitated flow field geometry gives better cell performance than the single-serpentine, double-serpentine flow field geometries. This is due to the presence of dead ends (availability of gas concentrations is more at the respective sides) and active transport of reactants in close vicinity to the electrode.
- B Sreenivasulu, G vasu, V Dharma rao, SV Naidu. Effect of Back Pressure and Flow Geometry on PEM Fuel Cell Performance - An Experimental Study. International Journal of Applied Science and Engineering. 2013; 1: 1-11.
- B Sreenivasulu, G Vasu, V Dharma Rao and S V Naidu. Performance Study of a PEM Fuel Cell with 4-serpentine Flow Fields – An Experimental Study. International Journal of Engineering Science & Advanced Technology. 2012; 2: 291 – 296.
- Zhong Zhenzhong, Chen Junxun and Zhuang Pingji. Enhancement of Proton Exchange Membrane Fuel Cell Performance using a Novel Tapered Gas Channel. Chinese Journal of Chemical Engineering. 2009; 17: 286-297.
- Jeon DH, S Greenway, S Shimpalee and JW Van Zee. The Effect of Serpentine Flow-Field Designs on PEM Fuel Cell Performance. International Journal of Hydrogen Energy. 2008; 33: 1052-1066.
References