
Research Article
Austin Chem Eng. 2017; 4(1): 1046.
Kinetics of Alkaline Hydrolysis of Ethyl Acetate by Conductometric Measurement Approach Over Temperature Ranges (298.15-343.15K)
Mukhtar A¹*, Shafiq U¹, Qazi MO², Qadir HA¹, Qizilbash M² and Awan BA¹
¹Department of Chemical Engineering, NFC IE & FR Faisalabad, Pakistan
²Department of Chemical Engineering, Universitat Politecnica de Catalunya-UPC, Spain
³Institute of Chemical Engineering and Technology, University of the Punjab, Lahore, Pakistan
*Corresponding author: Ahmad Mukhtar, Department of Chemical Engineering, NFC IE & FR Faisalabad, Pakistan
Received: December 21, 2016; Accepted: January 30,2017; Published: February 01, 2017
Abstract
Industrial significance of the reaction product sodium acetate and ethanol demands for the process improvements in terms of maximum conversion and economical & environmental friendly usage of raw material. This research aims the kinetic study of ethyl acetate hydrolysis with sodium hydroxide at different temperatures and development of mathematical model for holding time in batch reactor. For this purpose the experiment is carried out in a batch type stirred tank reactor over different temperatures and change in concentrations (in terms of electrical conductivity) measured with time. Detail kinetic study has been investigated and concluded that this reaction is shifting order and cannot be expressed as 2nd order reaction kinetics also it has been found that the reaction is exothermic in nature and low reaction temperature favors the high conversion and high reaction rate. The average values of rate constant and activation energy are found to be 4.409 KJ/mole and 0.0243μs 0.3118s-1 respectively which are agreed well with those of previous studies.
Keywords: Hydrolysis; Reaction Kinetics; Order of Reaction; Rate Constant; Conversion; Activation Energy
Introduction
The chemical reactions taking place in a chemical reactor are considering the heart of a chemical process. Reaction kinetics is the translation of our understanding about chemical process into a mathematical rate expression that can be used in reactor design and rating. Because of the importance of the development of performance models to stimulate the reactor fundamental parameters, comprehensive reactor design chemical kinetics is a key aspect of research and development (R&D) in chemical process industries [1]. Chemical Kinetics is actually a part of physical chemistry deals with the study of reaction rates. Reaction rate can be defined as the changes in the number of molecules of reacting species per unit volume per unit time or how fast a reaction takes place [2]. The rate of chemical reactions is affected by a number of factors like greater the surface area of solid reactants greater will be the rate of reaction, high concentration of reactants high will be the rate of reaction, in case of gaseous reactants and products the rate of reactions directly proportional to the pressure, catalysts also increase the rate of reaction however negative catalysts can decrease the rate of chemical reactions, and high temperature usually favors high rate of reaction Saponification is the hydrolysis of carboxylic acid under alkaline conditions. Hydrolysis is the chemical decomposition involving the breaking of ester bond and releasing the fatty acid and glycerol in the presence of an alkali. Commercial importance of the reaction product sodium acetate which is not used specifically for cleaning purposes but has a wide range of industrial applications such as in pharmaceutical, paint and dying industry, as food additive, in electroplating industry, as meat preservative, photography and purification of glucose etc. whereas ethanol as a by-product can be used as a bio fuel. Despite the commercial importance of no study has been found on the process improvements in terms of maximum conversion and economical & environmental friendly usage of raw material for this saponification reaction [3-6]. Saponification of ethyl acetate with sodium hydroxide proceeds through the direct attack of nucleophile (OH-1) on carbon atom of ethyl acetate [7-12]. Saponification of ethyl acetate with sodium hydroxide is the 2nd order overall, 1st order with respect to reactants furthermore reaction order decreases and become sequential rather than 2nd order when equimolecular concentrations of both reactants are used. This is a non-catalytic, homogeneous phase (liquid/liquid) and constant density system reaction. This reaction is mild exothermic in nature.
CH3COOC2H5 + NaOH → CH3COONa + C2H5OH
The hydrolysis of ethyl acetate with sodium hydroxide is one of the most well-known reactions in chemistry and it is represented as a model example of the 2nd order reaction in the literature dealing with chemical kinetics [13-15].
Previous research shows that equimolecular concentration of both reactants yield high conversion this can be also seen from the reaction stoichiometry. The addition of products actually retarded the overall reaction rate, but it is too much small to illustrate the deviation from 2nd order kinetics. Experimentally the deviation is more remarkable when the concentrations of ester and base are close. All the previous study shows that in continuous process increase in reactant flow rates cause decrease in residence time and due to which overall conversion decrease. On the other hand rate constant initially increase and then shows decline with the reactant flow rate. The dramatically decrease in conductivity can be observed with stirrer rate and results in achieving higher conversion as reaction proceeds. Therefore agitation is necessary to provide efficient mixing and uniform temperature distribution in reactor. The reaction conversion increases from 50.2% to 58.8% corresponding to a temperature change from 25°C to 30°C but for a reaction temperature more than 30°C a more sluggish behavior of change in reaction conversion can be observed [16-19]. As the previous research shows that the hydrolysis of ethyl acetate under alkaline conditions is 2nd order reaction, however during the experiments, we found that saponification of ethyl acetate with sodium hydroxide does not satisfy the 2nd order reaction kinetics. It was necessary to analyze the reaction more carefully. The previous works on this reaction did not analyze the reaction rate in details. Usually only the mean initial rate constant has been obtained. The deviation from the 2nd order rate equation has never been analyzed in detail kinetically. Therefore we study the kinetics and reaction rate of this reaction at different temperature careful in order to analyze the reaction kinetics.
This reaction has been studied by several researchers at different temperatures using a variety of measurement techniques in order to estimate the reaction order and activation energies [14,20]. Daniels et al [21]. And Levenson [22] use a volumetric titration method independently in which the composition of reaction mixture is analyses by withdrawal of samples after equal interval of time. The main disadvantages are the errors associated with the titration using color indicators. The 2nd technique is reported by Walker [15] based upon the composition measurement at any time using Conductometric measurement method. These measurements are carried out manually. However the accuracy of results strongly depends upon the response time in Conductometric measurement. Another technique reported by Stead et al [23]. This is based upon the continuous flow systems and usually for large volumes of fluids. In this method the reactants are fed continuously to a stirred tank reactor at constant temperature. Jensen et al [24]. Used high frequency titrimetry. This method does not need the introduction of any electrodes or external indicator in the reaction vessel. But the precaution about the calibration of the equipment must be taken for the nonlinearity of the equipment. This method involves a number of manual operations in methodology as compared with the proposed method. Shui-Yuan et al. and Ge-Li et al. [25,26] used acidometry and micro calorimetry techniques respectively in order to estimate the rate constant of saponification of ester. However these latest techniques are not so simple as compared to proposed methods. Zhanjun et al. and Young-Tao et al. [27,28] focused their attention to online data using a Conductometric measurement technique in order to make the methodology much simpler.
Experimental Work
For the batch experimentation equimolecular amounts of both reactants 0.1M of ethyl acetate (CH3COOC2H5) purchased from E. Merck KG and 0.1M of sodium hydroxide (NaOH) purchased from RdH Chemicals are introduced in a batch type stirred tank reactor. Agitation is provided with the help of a magnetic stirrer with a speed of (438rpm). Both reactants should be as close to same temperature as possible before starting the experiment. As the reaction proceeds to the forward direction hydroxide ions (OH-1) are consumed and acetate ions (CH3COO-1) are produced. This change in ion concentration results in a conductivity change in the solution that is continuously measured by a conductivity meter and by the measurement of this conductivity we could ascertain the degree of hydrolysis. Note the conductivity of the reaction mixture after equal interval of times until the conductivity becomes constant. Repeat the experiment at different temperatures from (25°C-70°C). Heating is providing with the hot water circulation. The data obtained on the basis of key Component (NaOH) from the experiments are given in Table 1. The experimental setup is shown in Figure 1.
    Temperatures ( oC)


    25 oC
    30 oC
    35 oC
    40 oC
    45 oC
    50 oC
    55 oC
    60 oC
    65 oC
    70 oC


    Time (min.)
    Conductivity (µs)


    0
    1001
    974
    1830
    1743
    1776
    2010
    2040
    2110
    1741
    2030


    1
    480
    529
    1044
    891
    908
    1019
    1047
    1045
    809
    947


    2
    443
    486
    1011
    849
    885
    987
    1037
    1019
    793
    933


    3
    417
    473
    991
    838
    869
    978
    1026
    1011
    784
    927


    4
    398
    463
    979
    833
    860
    973
    1020
    1008
    779
    924


    5
    383
    455
    969
    829
    852
    969
    1015
    1005
    774
    921


    6
    366
    450
    961
    826
    849
    965
    1013
    1002
    771
    920


    7
    356
    445
    955
    824
    846
    963
    1011
    999
    768
    918


    8
    350
    442
    949
    822
    845
    961
    1009
    998
    768
    916


    9
    346
    441
    928
    820
    845
    959
    1008
    998
    768
    916


    10
    325
    441
    919
    820
    845
    953
    1007
    998
    768
    916
Table 1: Temperature vs. Concentration Data at Different Temperatures.
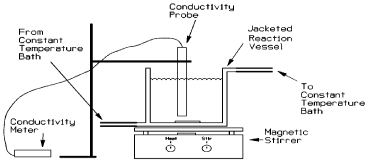
Figure 1: Experimental Setup.
Results and Discussions
Overall and instantaneous conversion
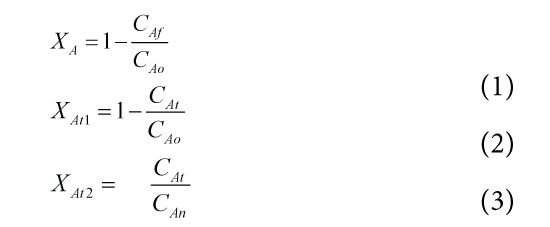
The Conversion of a chemical reaction is defined as in multi pass system the percentage transformation of reactants in to products in a single pass. The conversion is separated into instantaneous conversion and overall conversion. For the continuous processes both have same meaning but for batch and semi-batch processes they have significant differences. The overall conversion, Instantaneous conversion based upon initial concentration, and Instantaneous conversion based upon variable concentration can be calculated by following equations. The results are tabulated in Table 2, Table 3, and Table 4.
    Temperatures ( oC)


    25 oC
    30 oC
    35 oC
    40 oC
    45 oC
    50 oC
    55 oC
    60 oC
    65 oC
    70 oC


    Time (min.)
    Instantaneous Conversion based upon Initial    Concentration (Xat1)


    0
    0
    0
    0
    0
    0
    0
    0
    0
    0
    0


    1
    0.52
    0.45
    0.42
    0.48
    0.48
    0.49
    0.48
    0.5
    0.53
    0.53


    2
    0.55
    0.5
    0.44
    0.52
    0.5
    0.5
    0.49
    0.51
    0.54
    0.54


    3
    0.58
    0.51
    0.45
    0.52
    0.51
    0.51
    0.49
    0.52
    0.54
    0.54


    4
    0.6
    0.52
    0.46
    0.53
    0.51
    0.51
    0.5
    0.52
    0.55
    0.54


    5
    0.61
    0.53
    0.47
    0.52
    0.52
    0.51
    0.5
    0.52
    0.55
    0.54


    6
    0.63
    0.53
    0.47
    0.52
    0.52
    0.51
    0.5
    0.52
    0.55
    0.54


    7
    0.64
    0.54
    0.47
    0.52
    0.52
    0.52
    0.5
    0.52
    0.55
    0.54


    8
    0.65
    0.54
    0.48
    0.52
    0.52
    0.52
    0.5
    0.52
    0.55
    0.54


    9
    0.65
    0.54
    0.49
    0.53
    0
    0.52
    0.5
    0.52
    0.55
    0.54


    10
    0.67
    0.54
    0.49
    0.53
    0
    0.52
    0.5
    0.52
    0.55
    0.54
Table 2: Instantaneous Conversion based upon Initial Concentration.
    Temperatures ( oC)


    25 oC
    30 oC
    35 oC
    40 oC
    45 oC
    50 oC
    55 oC
    60 oC
    65 oC
    70 oC


    Time (min.)
    Instantaneous Conversion based upon Variable    Concentration (Xat2)


    0
    0
    0
    0
    0
    0
    0
    0
    0
    0
    0


    1
    0.52
    0.45
    0.42
    0.48
    0.48
    0.49
    0.48
    0.5
    0.53
    0.53


    2
    0.07
    0.08
    0.03
    0.04
    0.02
    0.03
    0.009
    0.02
    0.01
    0.01


    3
    0.05
    0.02
    0.01
    0.01
    0.01
    0.009
    0.01
    0.007
    0.01
    0.006


    4
    0.04
    0.02
    0.01
    0.005
    0.01
    0.005
    0.005
    0.002
    0.006
    0.003


    5
    0.03
    0.01
    0.01
    0.004
    0.009
    0.004
    0.004
    0.002
    0.006
    0.003


    6
    0.04
    0.01
    0.008
    0.003
    0.003
    0.004
    0.001
    0.002
    0.003
    0.001


    7
    0.02
    0.01
    0.006
    0.002
    0.003
    0.002
    0.001
    0.002
    0.003
    0.002


    8
    0.01
    0.006
    0.006
    0.002
    0.001
    0.002
    0.001
    0.002
    0
    0.002


    9
    0.01
    0.002
    0.02
    0.002
    0
    0.002
    0.0009
    0.002
    0
    0


    10
    0.006
    0
    0.009
    0.002
    0
    0.006
    0.0009
    0.002
    0
    0
Table 3a: Instantaneous Conversion based upon Variable Concentration.
    Sr. No.
    Temperature (oC)
    Overall Conversion (XA)


    1
    25
    67.53


    2
    30
    54.72


    3
    35
    49.78


    4
    40
    52.95


    5
    45
    52.42


    6
    50
    52.28


    7
    55
    50.63


    8
    60
    52.7


    9
    65
    55.88


    10
    70
    54.87
Table 3b: Overall Reaction Conversion.
The effect of temperature on the overall conversion of reaction has been plotted shown in Graph 1: this shows that low temperature (25°C) favors the higher conversion (67.53%) and that is agreed well those of previous studies.
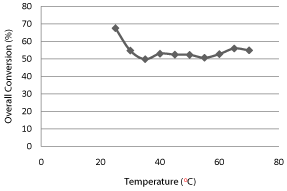
Graph 1: Effect of Temperature on Overall Conversion.
Order of reaction
In chemical kinetics, the order of reaction with respect to a given substance (such as reactant, catalyst or product) is defined as the index, or exponent, to which its concentration term in the rate equation is raised. Order of reaction is a relationship between the concentrations of reactants, products, and rate of reaction. It gives detail about the stoichiometry of the rate determining step in the whole reaction. A reaction can have more than one order depending upon their different concentrations of reactants but order of reaction must be within a range of (+3,-3). It indicates that to what extent the concentration of reactants affects the rate of reaction as well as which component has highest effect. Let us plan to use the Fractional Life Method in order to estimate the Order of Reaction. The basic equation of Fractional Life Method is given by.

The calculation and data is tabulated in Table 04: for the calculation of the reaction order using fractional Life method. A Graph 2: is plotted between (ln CAo) and (log tF) in order to estimate the order of reaction using Fractional Life Method. By comparing the equation (5) with the straight line equation obtained from the graph we found that the order of reaction is 1.3118. The previous research shows that this reaction follows the 2nd order reaction kinetics but we found the order of reaction 1.3118 so this reaction does not satisfactory expressed as a 2nd order reaction kinetics. Furthermore we will make the shifting order analyses in order to check that either 1.3118 is correct or not.
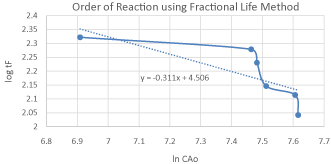
Graph 2: Concentration vs. Time Graph for Order of Reaction.
Rate constant, frequency factor, and activation energy
The rate equation shows the effect of changing concentrations of reactants on the rate of reaction. What about all the other things like temperature, pressure, and catalysts effect which also change the rate of reaction? Where do these fit into the rate equation? These are all included in the so-called rate constant. If you change the concentrations of reactants the rate constant will remains constant. But if you change the temperature, pressure, and catalysts the rate constants will be change. The activation energy is the minimum amount of energy required by the reactant molecule in to make an effective collision for the occurrence of reaction. A couple of reasons are that in order to react. The 1st reason is that the molecules need energy to distort or stretch their bonds so that they break and now can forms new bonds, and the 2nd reason is that the molecules need energy to overcome the steric and electron repulsive forces as they come close together. Frequency factor is a pre-exponential factor in the Arrhenius Equation which includes factors like the frequency of collision, and their orientation. It varies slightly with temperature although not much; it is often takes as constant across small temperature ranges.
When the mechanism of reaction is not known we often attempt to fit the data with a nth order rate equation in the form given below.
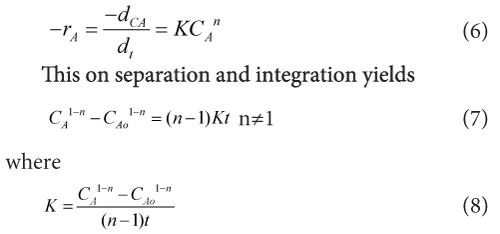
As we found that the order of reaction is (n=1.3118) so above equation can be modified in to this form given below.

Above equation is used to calculate the rate constant at each temperature and concentration the results are tabulated in Table 5. Average values of rate constant at different temperatures and Arrhenius Parameters data is tabulated in Table 6.
    Sr. No.
    CAo
    F (%)
    CA = XACAo
    tF (sec.)
    log tF
    ln CAo


    1
    1001
    67.53
    675.9753
    210
    2.32221
    6.90875


    2
    974
    54.72
    532.9728
    190
    2.27875
    6.88141


    3
    1830
    49.78
    910.974
    170
    2.23044
    7.51207


    4
    1743
    52.95
    922.9185
    140
    2.14612
    7.46336


    5
    1776
    52.42
    930.9792
    130
    2.11394
    7.48211


    6
    2010
    52.28
    1050.828
    110
    2.04139
    7.60589


    7
    2040
    50.63
    1032.852
    70
    1.84509
    7.6207


    8
    2110
    52.7
    1111.97
    60
    1.77815
    7.65444


    9
    1741
    55.88
    972.8708
    60
    1.77815
    7.46221


    10
    2030
    54.87
    1113.861
    40
    1.60205
    7.61579
Table 4: Fractional Life Method Data.
    Temperatures ( oC)


    25 oC
    30 oC
    35 oC
    40 oC
    45 oC
    50 oC


    Time (min.)
    Rate Constants (K)


    0
    0
    0
    0
    0
    0
    0


    1
    0.0958
    0.0789
    0.0775
    0.073
    0.0724
    0.0707


    2
    0.0538
    0.0455
    0.0417
    0.0394
    0.0377
    0.0372


    3
    0.0389
    0.0316
    0.0283
    0.0268
    0.0259
    0.0251


    4
    0.0292
    0.0245
    0.0214
    0.0203
    0.0197
    0.019


    5
    0.0247
    0.0201
    0.0172
    0.0163
    0.016
    0.0153


    6
    0.0216
    0.0168
    0.0143
    0.0136
    0.0133
    0.0128


    7
    0.0195
    0.0148
    0.0124
    0.0117
    0.0115
    0.011
Table 5: Rate Constants at Different Temperatures.
The Arrhenius Equation is given by
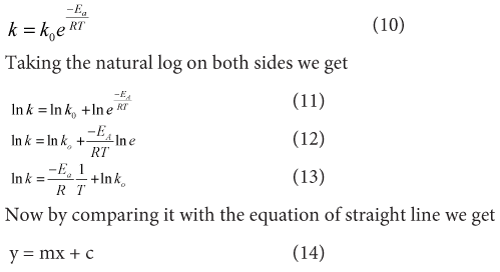
The graphical representation of the Arrhenius Equation is plotted in below Graph 3:
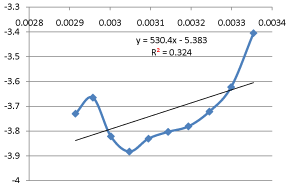
Graph 3: Graphical Representation of Arrhenius Equation.
The results shows that

Compare the above equation with the equation (13), (14), and (15) we found that the value of activation energy is 4.409KJ/mole and the value of frequency factor is 0.00459. The values of rate constant and activation energies are agreed well with that of previous studies. This finding leads to a general rule on the influence of activation energy. A high temperature favors the reaction with high activation energy and reaction will be more temperature sensitive while a low temperature favors the reaction with low activation energy and reaction will be less temperature sensitive.
Equilibrium conversion and adiabatic reaction temperature
The highest conversion that can be achieved in a reversible reaction is the equilibrium conversion. For the endothermic reactions, the equilibrium conversion increases with increasing temperature up to a 1.0 and for exothermic reactions, the equilibrium conversion decreases with increasing temperature. The thermodynamic equilibrium constant is independent of pressure of system, presence or absence of inerts, kinetics of reaction, but dependent on temperature of system. Tough the thermodynamic equilibrium constant is unaffected by the pressure of system, presence or absence of inerts, kinetics of reaction, but the equilibrium concentration of reactants and equilibrium conversion of reactants can be influenced by these variables.
To determine the maximum conversion that can be achieved in an exothermic reaction carried out adiabatically, we find the intersection of the equilibrium conversion as a function of temperature with temperature-conversion chart from the energy balance.
In order to find out the adiabatic reaction temperature and equilibrium reaction conversion it is need to be finding out the heat of reaction along with energy balance on the reaction and then precede the calculations as follows. The reaction is given by CH3COOC2H5 + NaOH →CH3COONa + C2H5OH
The values of enthalpy and Gibbs free energy of reactants and products are given in Table 7. The heat of reaction and Gibbs energy of the whole reaction is found given below.

    Sr. No.
    Temperature (oC)
    Temperature (K)
    1/T
    Kavg.
    ln(K)


    1
    25
    298.15
    0.003354
    0.0332
    -3.4052


    2
    30
    303.15
    0.0032986
    0.0267
    -3.623


    3
    35
    308.15
    0.0032451
    0.0242
    -3.7214


    4
    40
    313.15
    0.0031933
    0.0228
    -3.7809


    5
    45
    318.15
    0.0031431
    0.0223
    -3.8031


    6
    50
    323.15
    0.0030945
    0.0217
    -3.8304


    7
    55
    328.15
    0.0030473
    0.0206
    -3.8824


    8
    60
    333.15
    0.0030016
    0.0219
    -3.8212


    9
    65
    338.15
    0.0029572
    0.0256
    -3.6651


    10
    70
    343.15
    0.0029141
    0.024
    -3.7297
Table 6:  Average Values of Rate Constant at Different Temperatures and
Arrhenius Parameters Data.
Now for K298, K, equilibrium conversion XAe, and adiabatic equilibrium conversion we have following equations (18-22).
After that an energy balance is made on this reaction. For this reaction carried out adiabatically, the energy balance for key component reduces to.
The solid phase heat capacity values of key component sodium hydroxide (NaOH) are calculated from the Shomate Equation (22) and the values of Shomate constant are found from National Institute of Standard and Technology (NIST) and presented in Table 09.
Where temperature is in T/1000 (kelvin) and the values of equilibrium conversion and adiabatic equilibrium conversion are tabulated in Table 8 and its graphical presentation shows in Graph 4. From this graph is has been clearly seen that both lines are far away and not intersect each other so from this finding it has been proved that reaction is purely irreversible and it is not possible to find out the equilibrium conversion and temperature because it is only for reversible reactions.
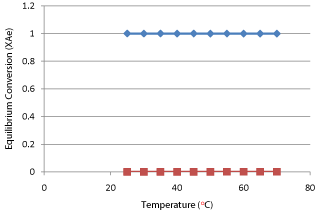
Graph 4: Equilibrium Conversion and Equilibrium Reaction Temperature.
    Components
    Enthalpies
    Gibbs Free Energy


    CH3COOC2H5
    -480
    -332.7


    NaOH
    -470
    -419.2


    CH3COONa
    -709.32
    -607.7


    C2H5OH
    -277.6
    -168.3
Table 7: Enthalpies and Gibbs Free Energies of Components.
Shifting order analysis
In searching for a kinetic equation it may be found that the data are well fitted by one reaction order at high concentrations but by another reaction order at low concentrations. Consider the reaction rate equation for such case.
In order to make a shifting order analyses it is necessary to convert the concentration values in terms of conductivity into molarity units. For this purpose a batch experiment is separately performed and by using molarity-volume relationship equation (28) conductivity curve for key component sodium hydroxide (NaOH) is obtained and then by using the equation straight line required conductivity values are converted in to molarity units. The data of conductivitymolarity values of batch experiment are presented in Table 10 and it is graphically presented in Graph 5.
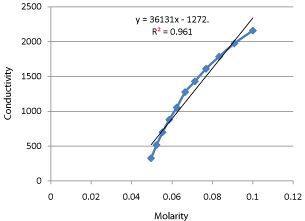
Graph 5: Standard Curve for Key Component (NaOH).
Temperature (K)
K298
K
XAe
XEB
298.15
-0.00581
16670.29
0.99994
0
303.15
-0.2514
13040.11
0.999923
8.07E-06
308.15
-0.4891
10280.18
0.999927
0.000163
313.15
-0.7192
8167.467
0.999877
0.000245
318.15
-0.9421
6535.986
0.999847
0.000329
323.15
-1.158
5266.683
0.99981
0.000413
328.15
-1.3674
4270.692
0.999765
0.000496
333.15
-1.5705
3485.971
0.999713
0.000581
338.15
-1.7676
2862.219
0.99965
0.000668
343.15
-1.9589
2364.223
0.999577
0.000753
Table 8: Equilibrium Conversion Data.
    Constants
    Values


    A
    419.4837


    B
    -1717.75


    C
    2953.573


    D
    -1597.22


    E
    -6.04688
Table 9:  values of Shomate Constants for Sodium Hydroxide (NaOH) over
Temperature Range of (298K-572K).
The shifting order is confirm by proving the equation (26) by a straight line graph when it is plotted. The shifting order analyses calculations for different temperatures and their graphical presentation are shown in Tables 11-15 and Graphs 6-15 and only those values of concentrations are plotted when there is change in concentration is observed with time and excluded when concentrations becomes constant with time.
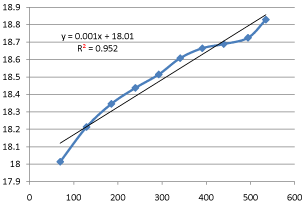
Graph 6: Shifting Order Analysis at 25°C.
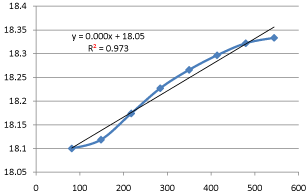
Graph 7: Shifting Order Analysis at 30°C.
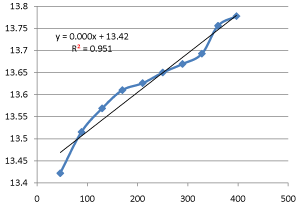
Graph 8: Shifting Order Analysis at 35°C.
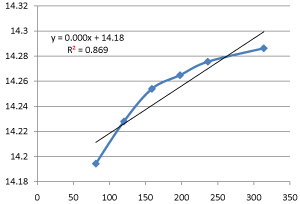
Graph 9: Shifting Order Analysis at 40°C.
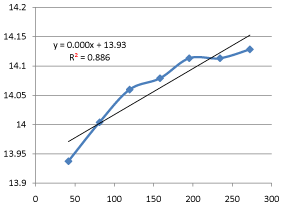
Graph 10: Shifting Order Analysis at 45°C.
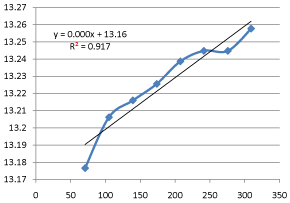
Graph 11: Shifting Order Analysis at 50°C.
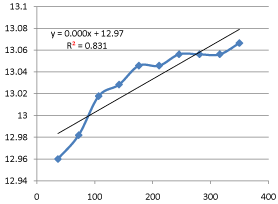
Graph 12: Shifting Order Analysis at 55°C.
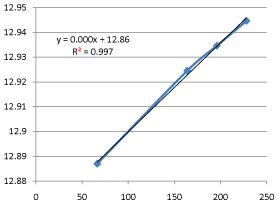
Graph 13: Shifting Order Analysis at 60°C.
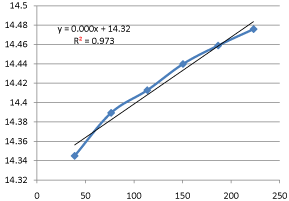
Graph 14: Shifting Order Analysis at 65°C.
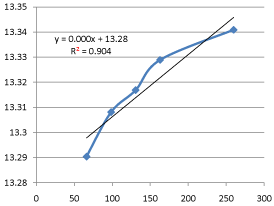
Graph 15: Shifting Order Analysis at 70°C.
    Volume
    Conductivity
    Molarity


    200
    2160
    0.1


    220
    1975
    0.0909


    240
    1785
    0.0833


    260
    1610
    0.0768


    280
    1430
    0.0713


    300
    1275
    0.0665


    320
    1055
    0.0623


    340
    880
    0.0586


    360
    700
    0.0553


    380
    515
    0.0523


    400
    325
    0.0496
Table 10: Standard Curve Data for Key Component (NaOH).
Shifting Order Analysis at 25oC
Shifting Order Analysis at 30oC
Time
C
M
t/CAo-CA
ln(CAo/CA)/CAo-CA
C
M
t/CAo-CA
ln(CAo/CA)/CAo-CA
0
1001
0.063
8
8
974
0.0622
8
8
1
480
0.0486
69.4444
18.0138
529
0.0499
81.3008
18.0999
2
443
0.0475
129.0322
18.2129
486
0.0487
148.1481
18.1185
3
417
0.0468
185.1851
18.3456
473
0.0484
217.3913
18.1739
4
398
0.0463
239.5209
18.4371
463
0.0481
283.6879
18.2269
5
383
0.0459
292.3976
18.5146
455
0.0479
349.6503
18.2657
6
366
0.0454
340.909
18.6079
450
0.0477
413.7931
18.2965
7
356
0.0451
391.0614
18.6684
445
0.0476
479.452
18.3219
8
350
0.045
439.5604
18.6888
442
0.0475
544.2176
18.3333
9
346
0.0448
494.5054
18.7252
441
0.0475
612.2448
18.3333
10
325
0.0443
534.7593
18.8288
441
0.0475
680.2721
18.3333
Table 11: Shifting Order Calculation Data at 25°C and 30°C.
    Shifting Order Analysis at 35oC
    Shifting Order Analysis at 40oC


    Time
    C
    M
    t/CAo-C-A
    ln(CAo/CA)/CAo-CA
    C
    M
    t/CAo-C-A
    ln(CAo/CA)/CAo-CA


    0
    1830
    0.0859
    8
    8
    1743
    0.0835
    8
    8


    1
    1044
    0.0641
    45.8715
    13.422
    891
    0.0599
    42.3728
    14.072


    2
    1011
    0.0632
    88.1057
    13.5154
    549
    0.0588
    80.9716
    14.1943


    3
    991
    0.0627
    129.3103
    13.5689
    838
    0.0585
    120
    14.228


    4
    979
    0.0623
    169.4915
    13.6101
    833
    0.0583
    158.73
    14.2539


    5
    969
    0.0621
    210.084
    13.626
    829
    0.0582
    197.628
    14.2648


    6
    961
    0.0619
    250
    13.65
    826
    0.0581
    236.22
    14.2755


    7
    955
    0.0617
    289.2561
    13.6694
    824
    0.0581
    275.59
    14.2755


    8
    949
    0.0615
    327.8688
    13.6926
    822
    0.058
    313.725
    14.2862


    9
    928
    0.0609
    360
    13.756
    820
    0.058
    352.941
    14.2862


    10
    919
    0.0607
    396.8253
    13.7777
    820
    0.058
    392.1568
    14.2862
Table 12: Shifting Order Calculation Data at 35°C and 40°C.
    Shifting Order Analysis at 45oC
    Shifting Order Analysis at 50oC


    Time
    C
    M
    t/CAo-C-A
    ln(CAo/CA)/CAo-C-A
    C
    M
    t/CAo-C-A
    ln(CAo/CA)/CAo-CA


    0
    1776
    0.0844
    8
    8
    2010
    0.0909
    8
    8


    1
    908
    0.0604
    41.6661
    13.9375
    1019
    0.0635
    36.4963
    13.0875


    2
    885
    0.0598
    81.3008
    14.004
    987
    0.0626
    70.6713
    13.1766


    3
    869
    0.0593
    119.5219
    14.0597
    978
    0.0623
    104.8951
    13.2062


    4
    860
    0.0591
    158.1027
    14.079
    973
    0.0622
    139.3728
    13.216


    5
    852
    0.0588
    195.3125
    14.1132
    969
    0.0621
    173.6111
    13.2256


    6
    849
    0.0588
    234.375
    14.1132
    965
    0.062
    207.6124
    13.2387


    7
    846
    0.0587
    272.3735
    14.1284
    963
    0.0619
    241.3793
    13.2448


    8
    845
    0.0586
    310.0775
    14.1356
    961
    0.0619
    275.862
    13.2448


    9
    845
    0.0586
    348.8372
    14.1356
    959
    0.0618
    309.2783
    13.2577


    10
    845
    0.0586
    387.5968
    14.1356
    953
    0.0616
    343.6426
    13.3676
Table 13: Shifting Order Calculation Data at 45°C and 50°C.
    Shifting Order Analysis at 55oC
    Shifting Order Analysis at 60oC


    Time
    C
    M
    t/CAo-C-A
    ln(CAo/CA)/CAo-C-A
    C
    M
    t/CAo-C-A
    ln(CAo/CA)/CAo-C-A


    0
    2040
    0.0917
    8
    8
    2110
    0.0936
    8
    8


    1
    1047
    0.0642
    36.3636
    12.96
    1045
    0.0642
    40.1606
    12.8197


    2
    1037
    0.064
    72.2021
    12.9819
    1019
    0.0635
    66.4451
    12.887


    3
    1026
    0.0636
    106.7615
    13.0177
    1011
    0.0632
    98.6842
    12.9177


    4
    1020
    0.0635
    141.8439
    13.0283
    1008
    0.0632
    131.5789
    12.9177


    5
    1015
    0.0633
    176.0563
    13.0457
    1005
    0.0631
    163.9344
    12.9245


    6
    1013
    0.0633
    211.2676
    13.0457
    1002
    0.063
    196.0784
    12.9346


    7
    1011
    0.0632
    245.614
    13.0561
    999
    0.0629
    228.013
    12.9446


    8
    1009
    0.0632
    280.7017
    13.0561
    998
    0.0629
    260.5863
    12.9446


    9
    1008
    0.0632
    315.7894
    13.0561
    998
    0.0629
    293.1596
    12.9446


    10
    1007
    0.0631
    349.6503
    13.0664
    998
    0.0629
    325.7328
    12.9446
Table 14: Shifting Order Calculation Data at 55°C and 60°C.
The results shows that all graphs are almost straight line and hence it is proved that this reaction is shifting order whose order is shifted from 2 to 1.3118 and cannot be expressed as a 2nd order reaction specifically when equimolecular concentrations of both reactants are used.
Temperature effect on rate of reaction
The rate of reaction at each temperature and each concentration has been calculated using equation (27) using the value of m is 2 and the value of n is 1.3118 as reaction order shifts from 2 to 1.3118. The results are presented in Table 16 and graphically are Graph 16. We found that rate of reaction increases with increasing temperature and go to a peak value at a temperature of 70°C. A temperature effect on the temperature sensitivity of the reaction has been already explained in previous section, the determination of Arrhenius Parameters.
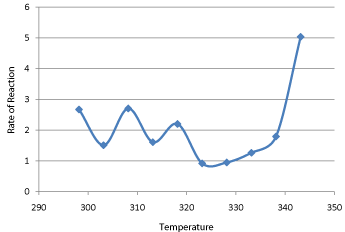
Graph 16: Temperature Effect of Rate of Reaction .
Mathematical model for holding time
Here we tried to develop a mathematical model for the holding time in a batch reactor for this reaction. The reaction is given by.
CH3COOC2H5 + NaOH → CH3COONa + C2H5OH
Whereas NaOH is the key component and also limiting reactant the material balance on this key component in the batch reactor is.
As all the data we collect from experimental runs at different temperatures are based upon the key component and 2nd component involvement in this study is ignored therefore above rate model is written in the form of key component only. The concentration of NaOH can be expressed in the terms of fractional conversion and the stoichiometry of the reaction is shown in Table 17. From the stoichiometry we have.
Shifting Order Analysis at 65oC
Shifting Order Analysis at 70oC
Time
C
M
t/CAo-CA
ln(CAo/CA)/CAo-C-A
C
M
t/CAo-CA
ln(CAo/CA)/CAo-C-A
0
1741
0.0834
8
8
2030
0.0914
8
8
1
809
0.0576
38.7596
14.3449
947
0.0615
33.4448
13.2474
2
793
0.0572
76.3358
14.3893
933
0.0611
66.0066
13.2904
3
784
0.057
113.6363
14.4128
927
0.0609
98.3606
13.3081
4
779
0.0568
150.3759
14.4398
924
0.0608
130.7189
13.3169
5
771
0.0566
186.5671
14.4589
921
0.0607
162.8664
13.3289
6
768
0.0565
223.0483
14.4758
920
0.0607
195.4397
13.3289
7
768
0.0565
260.223
14.4758
918
0.0607
228.013
13.3289
8
768
0.0565
297.3977
14.4758
916
0.0606
259.742
13.3409
9
768
0.0565
334.5724
14.4758
916
0.0606
292.2077
13.3409
10
768
0.0565
371.7472
14.4758
916
0.0606
324.6753
13.3409
Table 15: Shifting Order Calculation Data at 65°C and 70°C.
    Temperature
    Rate of Reaction


    298.15
    2.6702 × 10⁻⁶


    303.15
    1.5094 × 10⁻⁶


    308.15
    2.7045 × 10⁻⁶


    313.15
    1.0679 × 10⁻⁶


    318.15
    2.2015 × 10⁻⁶


    323.15
    0.9180 × 10⁻⁶


    328.15
    0.9496 × 10⁻⁶


    333.15
    1.2649 × 10⁻⁶


    338.15
    1.7930 × 10⁻⁶


    343.15
    5.0339 × 10⁻⁶
Table 16: Temperature Effect on Rate of Reaction.
    Component
    A


    At Time t = 0
    CAo


    At Time t = t
    CA


    Amount Reacted
    CAo-CA
Table 17: Stoichiometry of the Reaction.
The value of n=1.3118 used as we previously find that this reaction is shifting order with order 1.3118 not 2nd order. Upon the rearranging and applying the integral sign and limits on equation (37) we get the form.
This is the final form of the mathematical model that can be used for the holding time calculations under these conditions as described in this research.
Conclusion
It has been concluded that the alkaline hydrolysis of ethyl acetate has an overall reaction order 1.3118 and cannot be expressed satisfactorily as a 2nd order reaction specially when equimolecular concentrations of both reactants are used. The low reaction temperature favors the high overall conversion, low energy barrier for reactant molecules to make an effective collision and less temperature sensitive. The reaction has no change in equilibrium conversion as well as adiabatic equilibrium conversion that shows that the reaction is irreversible and exothermic in nature (-ve heat of reaction) the rate of reaction increases with increasing temperature so at high temperature (70°C) the reaction has high reaction rate.
Symbols
A, B, C, D, E: Shomate Constants; CAo: Initial Concentration; CAf: Final Concentration; CPA: Heat Capacity; E: Activation Energy; F: Fraction; G: Gibbs free energy; HR: Heat of Reaction; ko: Frequency Factor; K: Rate Constant; m, n: Reaction Orders; M: Molarity; –rA: Rate of Reaction; R: General Gas Constant; t: Time; T: Temperature; V: Volume; XA: Overall Conversion; XAE: Equilibrium Conversion; XEB: Adiabatic Equilibrium Conversion
Acknowledgement
The authors would like to acknowledge the efforts of Prof. Dr. Shahid Raza Malik, Director, NFC IE & FR Faisalabad, PAKISTAN and Dr. Waqar Ali Khan, Head, Department of Chemical Engineering, NFC IE & FR Faisalabad, PAKISTAN for sharing their pearl of wisdom during the course of this research and also establishing the research culture at Department of Chemical Engineering, NFC IE&FR Faisalabad, PAKISTAN. This research is self-funded.
References
- Berger RJ, Hugh Stitt E, Freek Kapteijn, Moulijn JA, Eurokin. Chemical Reaction Kinetics in Practice, CATTECH. 2001; 51: 30-60.
- Ikhazuangbe, Prosper Monday Ohien and Oni, AisosaBabalola, Reaction Rate and Rate Constant of Hydrolysis of Ethyl Acetate with Sodium Hydroxide. American Journal of Scientific and Industrial Research. 2015; 6: 1-4.
- Malik SR, Awan BA, Shafiq U, Mukhtar A. Investigation of the Agitation Effect on the Conversion of Saponification Reaction in a Batch Reactor at STP Conditions. International Journal of Applied Sciences and Engineering Research. 2015; 4: 461-466.
- Mukhtar A, Shafiq U, Khan FA, Qadir HA, Qizilbash M. Estimation of Parameters of Arrhenius Equations for Ethyl Acetate Saponification Reaction. Research Journal of Chemical Sciences. 2015; 5: 46-50.
- Ahmad A, Ahmad M I, Younas M, Khan H, Shah M H. A Comparative Study of Alkaline Hydrolysis of Ethyl Acetate using Design of Experiments. Iranian Journal of Chemistry and Chemical Engineering. 2013; 32: 33-47.
- Ullah I, Ahmad MI. Optimization of Saponification Reaction in a Continuous Stirred Tank Reactor. IEFR Journal of Engineering and Scientific Research. 2015; 2: 73-77.
- Mata-Segreda J. F. Hydroxide as General Base in the Saponification of Ethyl Acetate. Journal of American Chemical Society. 2002; 124: 2259.
- Ortiz M. I, Romero A, Irabien A. Integral Kinetic Analysis from Temperature Programmed Reaction Data: Alkaline Hydrolysis of Ethyl Acetate as Test Reaction. ThermochimicaActa.1989; 141: 169-180.
- Balland L, Estel L, Cosmao J M, Mouhab N. A Genetic Algorthim with Decimal Coding for the Estimation of Kinetic and Energetic parameters. Chemometrics and Intelligent Laboratory Systems. 2000; 50: 121.
- Graw M D, Nougues J M, Puigjaner L. Comparative Study of Two Chemical Reactions with Different Behavior in Batch and Semi-Batch Reactors. Chemical Engineering Journal. 2002; 88: 225.
- Krupska A, Konarski J, Fiedorow R, Adamiec J. Determination of the Rate Constants from Phase Delay Effect in Chemical Reactions. Kinetics and Catalysis. 2002; 43: 295.
- Kim YW, Barid JK. Reaction Kinetics and Critical Phenomenon: Saponification of Ethyl Acetate at the Consolute Point of 2-Butoxyethanol + Water, International Journal of Thermophysics. 2004; 25: 1025.
- Wijayarathne UPL, Wasalathilake KC. Aspen Plus Simulation of Saponification of Ethyl Acetate in the Presence of Sodium Hydroxide in a Plug Flow Reactor, Journal of Chemical Engineering and Process Technology. 2014: 5: 1062-1069.
- HirooTsujikawa, HakuaiInone, The Reaction Rates of Alkaline Hydrolysis of Ethyl Acetate, Bulletin of Chemical Society of Japan. 1966; 39: 1837-1842.
- Walker J. A Method for Determining the Velocities of Saponification, Proceedings of the Royal Society of London. 1906; 78: 157-160.
- Das k, Sahoo P, Sai Baba M, Murali N, Swaminathan P. Kinetic Studies on Saponification of Ethyl Acetate using an Innovative Conductivity-Monitoring Instrument with a Pulsating Sensor, International Journal of Chemical Kinetics. 2011; 1-9.
- Danish M, Al Mesfer M, Rashid M. Effect of Operating Conditions on CSTR Performance: An Experimental Study, International Journal of Engineering Research and Applications. 2015; 5: 74-78.
- Glasstone S. Textbook of Physical Chemistry, 2nd Edition, McMillan: New Delhi. India.1984: 1058.
- Kapoor K L. Textbook of Physical Chemistry, McMillan: New Delhi. India. 2004; 5: 116.
- Schneider MA, Stoessel F. Determination of the Kinetic Parameters of Fast Exothermal Reactions using a Novel-Micro Reactor Based Calorimeter, Chemical Engineering Journal. 2005; 115: 73-83.
- Daniels F, Matthews J, Williams J. Experimental Physical Chemistry, McGraw-Hill, New York. 1941; 167-169.
- Hilton AS, Levenson HS. Kinetics of Saponification of Ethyl Esters of Normal Aliphatic Acids. Journal of American Chemical Society.1939; 61: 1172-1175.
- Stead B, Page FM, Denbigh KG. Experimental Technique. An Experimental Method to use in Chemical Kinetics and in the Study of Transient Intermediates, Discuss Faraday Society. 1947; 2: 263-270.
- Jensen FW, Watson GM, Beckham JB, Study of Saponification Reaction Rate of Ethyl Acetate by High Frequency Titrimetry, Analytical Chemistry. 1951; 23: 1770-1773.
- Shui-Yuan, Xiang-Rong S, Li-Xia L, Lu-Yao PM. Xi’an Keji Xueyuan Xuebao. 2004; 24: 196-198.
- Ge-Li, Wan-Ying K, Li-Li H, Daxue Xuebao MJ. ZiranKexueban (Jinan, China). 2007; 21: 361-364.
- Zhanjun, Wenwei Y, Qingyun Z, Liaoning R, Xuebao SD, ZiranKexueban. 2006; 29: 511-514.
- Yong-Tao, Wen-Qing W, Ruo-Bing Z, Xiang-Hui H, Fang Y, Guangxi F, et al. ZiranKexueban. 2001; 19: 50-54.