
Research Article
Austin Chem Eng. 2019; 6(2): 1068.
Effect of Increasing Streptomicin Loading Rates on the Removal of Toxicity in Sequential Anaerobic ABR/ Aerobic CSTR Reactor System
Tuzun S* and Sponza DT
1Faculty of Engineering Dokuz Eylul University, Turkey
*Corresponding author: Tuzun S, Faculty of Engineering Dokuz Eylul University, Buca- Izmir Turkey
Received: March 25, 2019; Accepted: May 20, 2019; Published: May 25, 2019
Abstract
In this study, the anaerobic treatability of streptomycin was investigated in a sequential Anaerobic Baffled Reactor (ABR)/Completely Stirred Tank Reactor (CSTR) system. The ABR reactor was operated continuously through 83days using glucose as primary substrate with constant streptomycin concentration of 200mg/L. 200mg/L streptomycin gives an additional COD concentration to total COD thought continuous operation. 200mg/l of streptomycin gave approximately a COD of 131.38mg/L. The effects of decreasing Hydraulic Retention Times (HRT) (38.4-19.2-12.8-9.60-7.68 days) on COD, antibiotic removal efficiencies and gas productions in anaerobic baffled (ABR) reactor were investigated at constant streptomycin concentration of 200mg/L. Moreover, the effects of decreasing HRT on the change of, Volatile Fatty Acid (VFA) accumulation were investigated in the effluent and in the compartments of ABR reactor.
In this study, to toxic effect of streptomycin concentration on methane Archaea was investigated using Anaerobic Toxicity (ATA) test under batch conditions in the beginning of the study in order to determine in the IC50 (the streptomycin concentration which caused 50% decreases in the methanogenic activity) value of the streptomycin. The IC50 value for streptomycin was found as 292.06mg/L. In the continuous operation of APR reactor, for maximum COD efficiency (E=90%) and methane percentage (58%) the optimum streptomycin concentration and streptomycin loading rate were found as 200mg/L and 0.180kg/L day, respectively. The total COD removal efficiencies changed between 81% and 95% at different HRTs (38.4-19.2-12.8-9.60-7.68 days) in anaerobic/aerobic reactor system. The maximum COD removal efficiencies at constant streptomycin (200mg/L) concentration were obtained as 89% and 95% in the ABR and CSTR reactor effluents at a HRT of 19.2 days. Maximum total gas, methane gas productions and methane percentage were found as 504 l/day, 446.4 l/day and 58%, respectively at a HRT of 9.60 days. Before a HRT of 9.60 days, the daily total gas, ethane gas productions and methane percentage decreased through HRT. Maximum total gas, methane gas productions and methane percentage were found as 504L/day, 446.4L/day and 58%, respectively, at a HRT of 9.60 days. 259.2L/day total gas, 187L/day methane gas and 42% methane percentage were obtained at a HRT as long as 38.4 days. This indicated the inhibition effect of HRT on methane Archeae. In the continuous operation of APR reactor, for the Total Volatile Fatty Acids (TVFA) values in the effluent of the ABR reactor were found as zero when the HRTs decreased from 38.4 days to 7.68 days. TVFA concentration was higher in the first compartment that other compartments in ABR. TFVA concentration decreased from 608mg/l to 26mg/L in the first compartment when the HRT decreased from 38.4 days to 19.2 days. The effluent TVFA concentrations were approximately zero at all HRTs. Bic.Alk. Concentrations were lower in the first compartment than that the others compartments. This indicates the utilization of alkalinity to buffer the (TVFA) and CO2 produced from the anaerobic co-metabolism of streptomycin and COD. In anaerobic reactor system the TVFA/Bic.Alk. Ratio gives necessary information to determine the stability of the anaerobic reactor. If the TVFA/Bic.Alk. Ratio is lower than 0.4, the reactor is stable [1]. The TVFA/Bic.Alk. Ratio varied between 0.099 and 0.005 in effluent as the HRTs were decreased from 38.4 days to 7.68 days. The antibiotic removal efficiencies at constant streptomycin (200mg/L) concentration were obtained as 66% and 74% in the ABR and CSTR reactor effluents at a HRT of 12.8 days. The total maximum streptomycin removal efficiency was 74% in the sequential reactor system at an influent streptomycine concentration of 179.57mg/L at a HRT of 12.8 days. In this study, it was found that the “streptomycin” antibiotic was mainly degraded (59.79mg/L) in anaerobic ABR reactor while the remaining part of this antibiotic (47.54mg/L) was removed in the aerobic CSTR reactor. In this study, the acute toxic effect of synthetic wastewater containing streptomycin was investigated, separately, through anaerobic/aerobic degradation at decreased HRTs (38.4-19.2-12.8-9.60-7.68 days) using Daphnia magna test. The acute toxicity test results performed with Daphnia magna showed that the EC50 values decreased from influent 400mg/L to 132mg/L, and to 20mg/L in the effluents of ABR and aerobic reactor at a HRT of 38.4 days. The total acute toxicity reduction in sequential ABR CSTR reactor effluent was 95%.
Keywords: Aerobic Continuous Stirred Tank Reactor System (CSTR); Anaerobic Baffled Reactor (ABR); Daphnia magna; Streptomycin; Toxicity
Introduction
Antibiotics are an important group of pharmaceuticals in today’s medicine. In addition to the treatment of human infections, they are also used in veterinary medicine such as streptomycin. Bacteria that are resistant to antibiotics are present in surface water [2]. Antibiotics are found in ground water at concentrations below than 10µg/L. The source of antibiotics in ground water originating from the leaching the fertilized fields with animal slurry and from the waters passing through the sediments [2].
The anaerobic treatability studies concerning the pharmaceuticals and antibiotics are limited with few studies: The performance of an Upflow Anaerobic Filter (UAF) treating a chemical synthesis-based pharmaceutical wastewater was evaluated under various operating conditions [3].The performance of an Up-flow Anaerobic Stage Reactor (UASR) treating pharmaceutical wastewater containing macrolide antibiotics was investigated [4].The performance of a lab-scale hybrid Up-flow Anaerobic Sludge Blanket (UASB) reactor, treating a chemical synthesis-based pharmaceutical wastewater, was evaluated under different operating conditions. This study consisted of two experimental stages: first, acclimation to the Pharmaceutical wastewater and second determination of maximum loading rate (OLR) 1kg COD/m3d [5]. A four-compartment Periodic Anaerobic Baffled Reactor (PABR) was run in a ‘clockwise sequential’ switching manner continuously fed on Chinese traditional medicine industrial wastewater [6].
The Anaerobic Baffled Reactor (ABR) is high rate anaerobic reactor offering two-phase separation with a single vessel. The literature survey shows that there is a lack on the anaerobic treatment of streptomycin and chloramphenicole by ABR. In other words, no study was found in the literature for the ABR reactor treating the wastewaters containing streptomycin.
Streptomycin is an antibiotic drug, the first of a class of drugs called amino glycosides to be discovered, and was the first antibiotic remedy for tuberculosis. Streptomycin was first isolated on October 19, 1943 by Albert Schatz, a graduate student, in the laboratory of Selman Abraham Waksman at Rutgers University. The chemical identities of the streptomycin and physical and chemical characteristics of the streptomycin, in Tables 1,2, respectively [7].
It has been known for more than six decades that certain fungi and bacteria are capable of producing chemical substances, which have the capacity to inhibit the growth of, and even to destroy, pathogenic organisms. Only within the last twelve or thirteen years, however, have antibiotics begun to find extensive application as chemotherapeutic agents. Among these, penicillin and streptomycin have occupied a prominent place. Penicillin is largely active against gram-positive bacteria, gram-negative cocci, anaerobic bacteria, spirochetes and actinomycetes; streptomycin is active against a variety of gram-negative and acid-fast bacteria, as well as against gram-positive organisms, which have become resistant to penicillin.
Since the discovery of streptomycin, the production and clinical application of this antibiotic have had a phenomenal rise. The streptomycin producing strain of Streptomycin griseus was isolated in September 1943, and the first public announcement of the antibiotic was made in January 1944. Before the end of that year, streptomycin was already being submitted to clinical trial. Within 2 years, the practical potentialities of streptomycin for disease control were definitely established.
Material and Methods
Experimental setup
A schematic of the lab-scale sequential ABR and CSTR reactors used in this study are presented in Figure 1. The effluent of the anaerobic ABR reactor was used as the influent of aerobic CSTR reactor. The ABR reactor was rectangular box having the dimensions 20cm wide, 60cm long and 40cm high. The ABR reactor with the active reactor volume (38.4L) was divided into four equal compartments by vertical baffles. Each compartment was further divided into two by slanted edge (45°C) baffles to encourage mixing within each compartment. Therefore, down-comer and up-comer regions were created. The liquid flow is alternatively upwards and downwards between compartment partitions. This provided effective mixing and contact between the wastewater and biomass at the base of each upcomer. In other words, during upflow, the waste flow contact with the active biomass and it is retained within the reactor providing a homogenous distribution of wastewater. An additional mixing was not supplied to the compartments of the reactor. The width of the downcomer was 4cm and the width of the up-comer was 11cm. The passage of the liquid from each compartment to another was through an opening with size 40 mm ×10 mm that located about 80mm from the top of each compartment. The liquid sampling ports were located at 40mm back of the effluent opening of each compartment. The sludge sampling ports were also located in the center of the compartments and 80mm above from the bottom of the each compartment. The influent feed was pumped using a peristaltic pump. The outlet of the ABR was connected to a glass U-tube for controlling the level of wastewater. The produced gas was collected via porthole in the top of the reactor. The operating temperature of the reactor was maintained constant at 37±1°C by placing the ABR reactor on a heater. A digital temperature probe located in the middle part of the second compartment provided the constant operation temperature. This provided a homogenous temperature in whole compartments of ABR reactor. The aerobic CSTR reactor consisted of an aerobic (effective volume=9L) and a settling compartment (effective volume=1.32L).
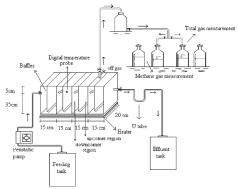
    Figure 1: Schematic configuration of lab-scale anaerobic (ABR)/aerobic
(CSTR) sequential reactor system.
Seed of the reactors
Partially granulated anaerobic sludge was used as seed in the ABR reactor. The seed sludge was obtained from an anaerobic upflow anaerobic sludge blanket reactor containing acidogenic and methanogenic partially granulated biomass taken from the Pakmaya Yeast Beaker Factory in Izmir, Turkey. Activated sludge culture was used as seed for the aerobic CSTR reactor and it was taken from the activated sludge reactor of Pakmaya Yeast Beaker Factory in Izmir. The Volatile Suspended Solid (VSS) concentration of seed sludge in ABR reactor was adjusted as 25g/L. The Mixed Liquor Solids Concentration (MLSS) in the CSTR were adjusted between 3000 and 4000 mg/L.
Composition of synthetic wastewater
Streptomycin concentration varying between 25 and 400 mg/L was used through continuous operation of the ABR reactor. Glucose was used as primary substrate giving a COD concentration of 3000 ± 100 mg/L. Vanderbilt mineral medium was used in synthetic wastewater as mineral source. This mineral medium consisted of the following inorganic composition (in mg/l): NH4Cl, 400; MgSO4.7H2O, 400; KCl, 400; Na2S.9H2O, 300; (NH4)2HPO4, 80; CaCl2.2H2O, 50; FeCl3.4H2O, 40; CoCl2.6H2O, 10; KI, 10; (NaPO3)6, 10; L-cysteine, 10; AlCl3.6H2O, 0.5; MnCl2.4H2O, 0.5; CuCl2, 0.5; ZnCl2,0.5; NH4VO3, 0.5; NaMoO4.2H2O, 0.5; H3BO3, 0.5; NiCl2.6H2O, 0.5; NaWO4.2H2O, 0.5; Na2SeO3, 0.5 [8]. The anaerobic conditions were maintained by adding 667mg/l of Sodium Thioglycollate (0.067%) which is proposed between 0,01-0,2% (w/w) for maintaining the strick anaerobic conditions [8]. The alkalinity and neutral pH were adjusted by addition of 5000mg /L NaHCO3.
Analytical methods
The dissolved COD was measured calorimetrically by using closed reflux method [9]. Firstly, the samples were centrifuged 10.0min at 7000rpm. Secondly, 2.5ml samples were mixed with 1.5ml 10216mg/l K2Cr2O7, 33.3g/l HgSO4 and 3.5ml 18M H2SO4 containing 0.55% (w/w) Ag2SO4. Thirdly, the closed sample tubes were stored in a heater with a temperature of 148°C for two hours. Finally, after cooling, the samples were measured at a wavelength of 60nm with a Pharmacia LKB NovaPec II model spectrophotometer.
Gas productions were measured with liquid displacement method. The total gas was measured by passing it through a liquid containing 2% (v/v) H2SO4 and 10% (w/v) NaCl [10]. Methane gas was detected by using a liquid containing 3% NaOH to scrub out the carbon dioxide from the biogas [11]. The methane gas percentage in biogas was also determined by Dräger Pac®Ex methane gas analyzer. The H2S gas was measured using Dräger (Stuttgart, Germany) kits in a Dräger H2S meter. H2 gas was measured using (Dräger Pac®Ex) H2 meter. N2 gas was measured by discarding of the sum of CH4 + H2S + H2 gases from the total gas.
Biomass was measured as Total Suspended Solid (TSS) and Volatile Suspended Solid (VSS) in anaerobic reactors. Biomass in aerobic tank was measured as Mixed Liquor Suspended Solids (MLSS) and Mixed Liquor Volatile Suspended Solids (MLVSS). Assays were performed according to Standard Methods for Examination of Water and Wastewater [9].
Bicarbonate alkalinity (Bic.Alk.) and Total Volatile Fatty Acid (TVFA) concentrations were measured simultaneously using titrimetric method proposed by Anderson & Yang. The test was carried out as follows: firstly the pH of the sample was measured, secondly the sample was titrated with standard sulphuric acid (0.1 N) through two stages (first to pH=5.1, then from 5.1 to 3.5), and finally the VFA and Bic.Alk. Concentrations were calculated with a computer program by solved the Eqs (1) and (2).
where A1 and A2 are the molar equivalent of the standard acid consumed to the first and second end points; [HCO3-] the bicarbonate concentration; [VA] the volatile fatty acid ion concentration; [H]1,2,3 the hydrogen ion concentrations of the original sample and at the first and the second end points; Kc is the conditional dissociation constant of carbonic acid; KVA is the combined dissociation constant of the volatile fatty acids (C2-C6), this pair of constants was assumed, being 6.6×10⁻⁷ for bicarbonate and 2.4×10⁻⁵ for volatile acids.
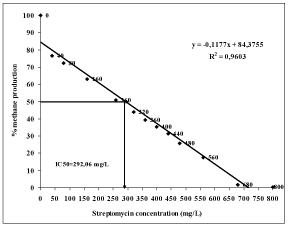
Figure 2: IC50 value for Streptomycin in anaerobic sludge (IC50= 292,06 mgL-1).
ATA test was performed at 35°C using serum bottles with a capacity of 150ml as described by [12,13]. Serum bottles were filled with 2000mg VSS/L of biomass, 3000mg /l of glucose-COD, suitable volume from the Vanderbilt mineral medium, 667mg /l of sodium thioglycollate providing the reductive conditions and 5000mg /l of NaHCO3 for maintaining the neutral pH. Before ATA test, the serum bottles were batch operated until the variation in daily gas production was less than 15% at least for 7 consecutive days. After observing the steady-state conditions, increasing concentration streptomycin and chloramphenicole were administered to serum bottles asmslug-doses from concentrated stock solutions of these chemicals. The effects of Streptomycin and Chloramphenicole on methane gas production were compared with the control samples. Inhibition was defined as a decrease in cumulative methane compared to the control sample. IC50 value indicates the 50% inhibition of methane gas production in serum bottles containing toxicant. This value shows the presence of toxicity. This value shows the toxicant concentration caused 50% inhibition in the methane gas production.
The SMA test was conducted in 150ml serum bottles at 35°C under anaerobic conditions. Serum bottles were filled with 3000mg/l of glucose-COD, with suitable amount of Vanderbilt mineral medium, 667mg/l of sodium thioglycollate for to provide the reductive conditions and 5000mg/l of NaHCO3 for maintaining the neutral pH and 2000mg VSS/L of biomass. Maximum specific methanogenic activity was calculated from the total methane production through 3 days with the method proposed by [12] as follows:
Toxicity was tested using 24h born Daphnia magna as described in [14]. Test animals were obtained from the Science Faculty in Aegean University in Izmir. After preparing the test solution, experiments were carried out using 5 or 10 Daphnids introduced into test vessel. These vessels were controlled with 100ml of effective volume at 7-8 pH, providing minimum dissolved oxygen concentration of 6 mg/l at an ambient temperature of 20-25°C. Young Daphnia magna are used in the test (in first start ≤ 24 h old). A 24h exposure is generally accepted for a Daphnia acute toxicity test. Results were expressed as mortality percentage of the Daphnias. The immobile animals, which were not able to move, were determined as the death of Daphnias.
Antibiotics measurements
Streptomycin measurement: Preparation of 1000mg/L Streptomycin stock standard; 0,5g streptomycin is weighted in a beaker, it was put into a 500 ml of volumetric flask and it was filled with HPLC grade deionized water. 5, 50, 100, 150, 300 mg/L standard Streptomycin solutions were prepared from the 1000 mg/L of Streptomycin Stock Standard.
HPLC conditions for streptomycin analysis: A C-18 250×4,6 mm. (id), column (ACE) was used The mobile phase consisted of the HPLC grade Acetonitrile at pH=3, Sodium Phosphate Buffer + Sodium 1-Hexanesulphonic Acid ratio was (8:92), The flow rate was 1ml/min, the column temperature was 20°C, the wave length was 195nm (UV) and the injection volume was 10microliter.
1L sample was centrifuged using a filter with a pore size of 0,20 micrometer. The vials was filled with 2ml of centifuged sample and it was injected into sampling portes of the HPLC [15].
Operation conditions: The adaptation period is very important since the bacterial population used as seed is going to be exposed to the Streptomycin in an anaerobic environment of the ABR reactor. In order to acclimation the partially granulated biomass in the ABR reactor, the anaerobic reactor was operated with synthetic wastewater through 92 and 12 days without streptomycin for reach to steady-state conditions. HRT and OLR were 19,2 days and 156,25 kg COD/ m3 days, respectively.
Sludge retention time (SRT, θC) is the total quantity of active biomass in the reactor divided by the total quantity of active biomass withdrawn daily. Since no sludge wasting was applied for granule formation in the ABR reactor, SRT in this reactor was determined using equations (3) and (4) [16]
Qw and Xw were defined as flow rate and microorganism concentrations, respectively in wasted sludge stream. The term Qw*Xw only makes sense if there is a waste sludge stream. Since no sludge wasting was applied in the ABR reactor, SRT can be expressed as follows:
The sludge wasting in a conventional CSTR reactor occurred from the settling tank and the solids in the effluent (Xe) were taken into consideration. Therefore, SRT in this reactor was calculated by using equation (6) with rearranged equation (5).
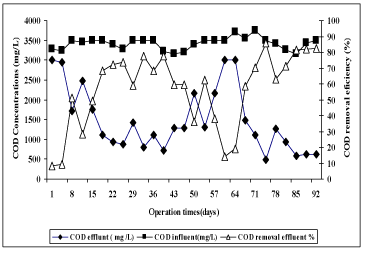
Figure 3: COD removal efficiencies in the ABR during the start-up period in ABR.
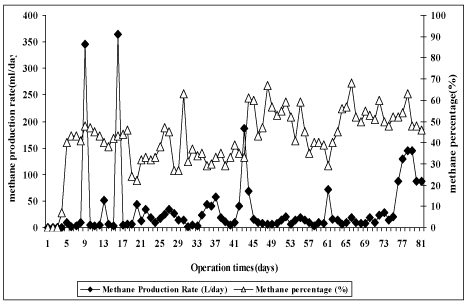
Figure 4: Methane gas production and methane percentages in the ABR during the start-up period in ABR.
Vr and Xr are effective volume of reactor and microorganism concentration in the aeration tank. Qe and Xe were defined as flow rate and microorganism concentration measured in the settling tank. Qw and Xw are the flow rate and microorganism concentration wasted from the reactor. The CSTRs used in this study are recycled reactors. In other words, the sludge was recycled 100% from the settling tank to the aeration tank. If the concentration of microorganism in the effluent of the settling tank is low, Xe is negligible [16]. In this study, the activated sludge was withdrawn from the inside of the aeration stage, the microorganism concentration in the reactor (Xr) was equal to the wasted microorganism concentration (Xw). Therefore, in this study the SRT in CSTR was calculated using equation (6).
In this study, SRT (qc) in the CSTR reactor was adjusted as 20 days by discarding a certain amount of sludge volume from the aeration stage of the CSTR reactor. HRT in anaerobic reactors and CSTR were calculated using equation (7).
Vr and Q were defined as reactor volume (l) and influent flowrate (L/day), respectively.
In the first step study OLR, HRT, streptomycin and chloramphenicole concentrations were 0,156 kg COD/m3 days, 19,2 days, 25-400 mg/L and 50-340 mg/L, respectively.
In the second step study OLR, HRT, streptomycin and chloramphenicole concentration were 0,078- 0,156 - 0,234 - 0,312 - 0,391 kg COD/m3 days, 38,4 - 19,2 - 12,8 - 9,60 - 7,68 days, 200mg/L and 130mg/L, respectively.
Results and Discussion
Anaerobic Toxicity Assay (ATA) Results for Streptomycin
This batch test provided for the information on the continuous potential loading capacity of the ABR. The streptomycin concentrations caused 50% decreases in the methanogenic activity (decrease of methane gas production) were calculated as IC50 value. The IC50 value for streptomycin was found to be 292.06mg/L as shown in the Figures 2.
Start-up of Period of the Abr: The ABR reactor was operated through 92 days without streptomycin under steady-state conditions to acclimate the granular sludge to ABR reactor. Figure 3 shows the COD removal efficiencies in the ABR during the start-up period. The COD removal efficiency was 10% on day 4 days while it reached 70% after 71 days. The COD removal efficiencies remained stable 82% after an operation period of 85 days. Figure 4 shows the methane gas percentages in the ABR during the start-up period. The methane gas production and methane percentage reached 69,12L/day and 45%, respectively after 44days at an organic loading rate of 0,16Kg COD/m3 day. The daily methane gas production and methane percentage remained stable at 96 L/day and 56%, respectively, after 64days of the start-up period. Figure 5 shows the total gas percentages in the ABR during the start-up period. The total gas production and methane percentage reached 100,8 L/day and 45%, respectively at operation time of 44 days. The daily total gas production and methane percentage remained stable at 187,2L/day and 56%, respectively, after 64 days of the start-up period.
Effect of increasing streptomycin concentration on the cod removal efficiencies in abr reactor: In this study, the effect of increasing streptomycin concentrations on COD removal efficiencies was investigated in ABR. The operation of the ABR with streptomycin was started at an influent streptomycin concentration of 25mg/L, and then streptomycin concentration was subsequently increased from 25, 50, 75, 100, 150, 175, 200, 240, 280, 320, to 400mg/L (At OLRs from 0.188 to 0,156 kg COD/m3 day). The effect of streptomycin concentration on the COD removal efficiencies in ABR was shown in Figure 6. Although the influent COD concentration was kept constant at 3000mg/L with glucose, the influent COD concentrations increased with increasing streptomycin concentration since streptomycin give additional COD to synthetic wastewater. The influent COD concentration was 366mg/L at a streptomycin concentration of 25mg/L while it was measured as 2990mg/L at a streptomycin concentration of 400mg/L. The COD removal efficiency was 90,72% at an initial streptomycin concentration of 25mg/L introduced to ABR. In a study performed by [6]. The COD removal efficiency was found as 82.47% at an organic loading rate of (ORL) 2 kg COD/m3*day in Chinese traditional medicine industrial wastewater. The COD removal efficiency found in this study is comparable higher than that aforementioned study. The COD removal efficiency was measured approximately as 81,96 % at a streptomycin concentration of 320mg/L. The maximum COD removal efficiency was between 89-95% at streptomycin are concentration of 100-150 mg/L. When the streptomycin concentration was increased to 400 mg/L the COD removal efficiency was measured as 67,55 % (Figure 6).
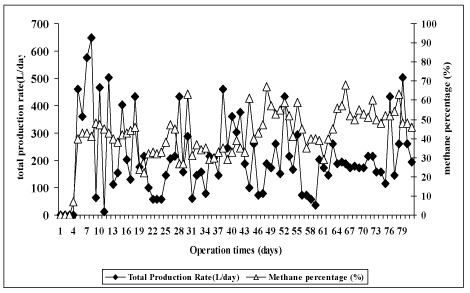
    Figure 5: Total gas production and methane percentages in the ABR during
the start-up period in ABR.
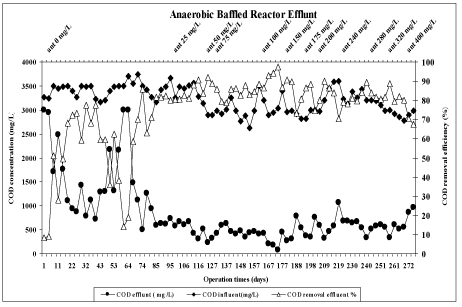
    Figure 6: Effect of streptomycin concentration on COD removal efficiencies
in ABR reactor.
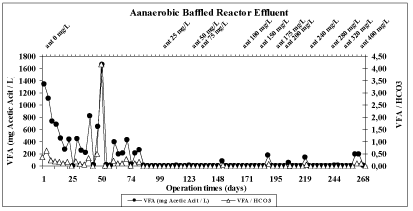
    Figure 7: The variations of VFA in ABR at increasing streptomycin
concentrations.
Effect of increasing streptomycin concentration on the vfa, bicarbonate alkalinity (bic.alk.) Concentrations and vfa/bic.alk. Ratio in abr reactor: Figure 7 shows the variations in VFA concentrations and VFA/Bic.Alk. Ratios in the ABR reactor at increasing streptomycin concentrations. As the streptomycin concentrations increased from 25mg/L to 400 mg/L the VFA concentration increased from 0mg/L to 191mg/L. Figure 8 shows the variations of Bic.Alk. Concentrations through 268 days of operation period. Their concentrations were approximately 3600-1900 mg/l in the effluent. The Bic.Alk. Concentrations decreased in the effluent, gradually. VFA/ BIc.Alk. Ratios varied between 0,368 and 0,005 in the effluent of ABR reactor at increasing streptomycin concentration (from 0mg/L up to 40mg/L).This showed that the ABR reactor operated under steady-state conditions since the VFA/ BIc.Alk. Ratios were lower than 0.5 [1]. The HCO3 alkalinity also remained between 1250 and 2500 mg/L indicating the buffer capacity of the ABR reactor for methanogenesis [8]
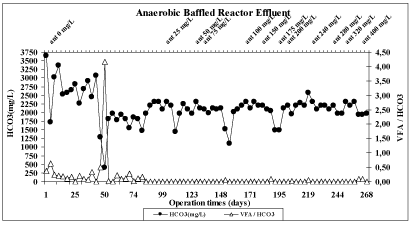
Figure 8: The variations of HCO3 in ABR at increasing streptomycin concentrations.
The variations of COD removal efficiency in compartments of the ABR reactor at increasing streptomycin concentrations: In this study, the effect of increasing streptomycin concentrations on COD removal efficiencies was investigated in four compartments of the ABR reactor. COD removal efficiencies were high (98%) in compartment IV compared to the other compartments. The COD removal efficiency increased from 8,5% to 96,9% until a streptomycin concentration of 200mg/L. Then the COD removal efficiency decreased from 96,9% to 82% after 200mg/L at compartment IV (see Figure 9d). As shown in Figure 9a, the COD removal efficiency values in the compartment I was lower than the other compartments. The COD removal efficiency values in the first compartment varied between 8,29% and 32,69% at all streptomycin concentrations. The COD removal efficiency values increased to 67, 10 and to 88,10 in compartments II and III. (Figures 9b,c), shows the COD removal efficiencies in the compartment II ( varied between 8,29% and 68,85% ) and compartment III (varied between 8,29% and 80,72%).
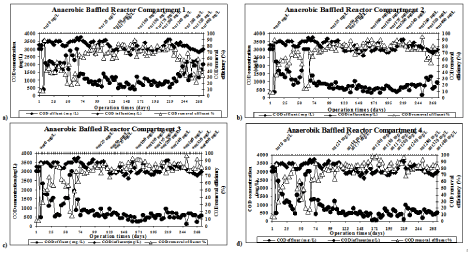
Figure 9: Effect of streptomycin concentration on COD removal efficiencies in all compartments. (a- compartment 1, b-compartment 2, c-compartment 3, dcompartment 4).
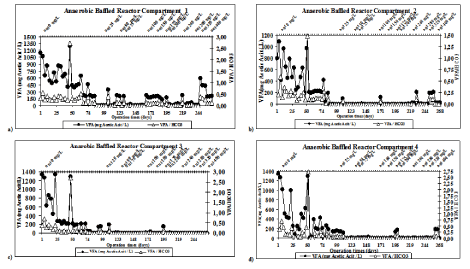
Figure 10: The variations of VFA in ABR at increasing streptomycin concentrations in the all compartments. (a- compartment 1, b-compartment 2, c-compartment 3 d- compartment 4).
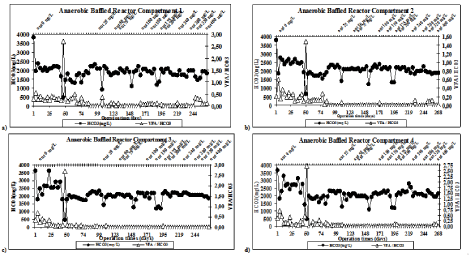
Figure 11: The variations of HCO3 in ABR at increasing streptomycin concentrations in the all compartments. (a- compartment 1, b-compartment 2, c-compartment 3 d- compartment 4).
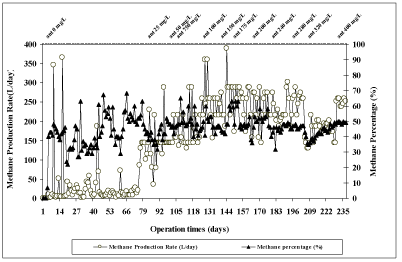
    Figure 12: The variations of methane gas production and methane
percentage in ABR at increasing streptomycin concentrations.
The variations of vfa, bicarbonate alkalinity (bic.alk.) And vfa/bic.alk. Ratio in compartments of the abr reactor at increasing streptomycin concentrations: Figure 10 shows the VFA, VFA/Bic.Alk. Ratio variations in the ABR reactor at increasing streptomycin concentrations from 0mg/L up to 400mg/L. VFA concentrations were high in the compartment I compared to the other compartments, because in compartment I the activity of acidogens was a maximum rate (See Figure 10a). VFA concentrations decreased from 1200mg/l to 208mg/l as the streptomycin concentrations increased from 25mg/L up to 400mg/L in first compartment. VFA concentrations decreased in compartments II, III and IV. VFA concentrations decreased from 1341mg/L to 157mg/L until a streptomycin concentration of 25mg/L while the VFA concentration was zero until a streptomycin concentration of 400mg/L in compartment IV. The VFA concentrations zero at a streptomycin concentration of 400mg/L in compartment III (See Figure 10c).The VFA concentrations decreased from 794mg/L to 191mg/L until a streptomycin concentration of 25mg/L while the VFA concentrations were zero in compartment II at all streptomycin concentration (See Figure 10b). VFA concentrations decreased from 1341mg/L to 112mg/L until a streptomycin concentration of 25mg/L and the VFA concentration were zero until a streptomycin concentration of 400mg/L in compartment IV. The VFA concentrations decreased from 191mg/l to 0mg/l at a streptomycin concentration of 400mg/L in compartment IV (See Figure 10d).
The Bicarbonate Alkalinity (HCO3) and VFA/Bic.Alk. Ratio variations in all compartments of the ABR reactor at increasing streptomycin concentrations (from 0mg/L up to 400mg/L) were shown in Figure 11. (Figure 11a) indicates a low concentration of HCO3 concentration from 3803mg/L down to 1817mg/L was present in the compartment I when the ABR reactor was operated at streptomycin concentration in the range 0 mg/L - 400 mg/L. However, in compartment IV, the HCO3 alkalinity concentrations increased to 1931mg/L at a streptomycin concentration 400mg/L (see Figure 11d). HCO3 concentrations decreased from 3771mg/L to 1858mg/L at a streptomycin concentration of 400mg/L in compartment II. After that HCO3 concentrations decreased from 3648mg/L to 1858mg/L at a streptomycin concentration of 400mg/L in compartment III. The HCO3 concentrations in the compartment IV is higher than the others compartments in the ABR reactor.
Generally it was found that in the first compartment of ABR reactor the acidogenesis is the major step of the anaerobic treatment. The third and fourth compartments are the major removal steps for methanogenesis. Therefore the VFA concentrations were high in while the HCO3 alkalinities were low in the first compartment of ABR.
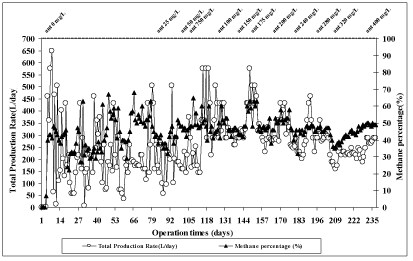
    Figure 13: The variations of total gas production and methane percentage in
ABR at increasing streptomycin concentrations.
Effect of increasing antibiotic dose on gas production and methane percentage in anaerobic abr reactor: Biogas production was monitored through the operation of the ABR reactor, particularly for detection the methanogenic activity. From Figure 12 it can be seen that the methane gas production rates increased from 0L/day to 144L/day at a streptomycin concentration of zero. Then methane gas production rates increased from 144L/day to 259,2L/day, respectively. As the streptomycin concentration was increased from 0mg/L to 280mg/L, the methane gas production decreased from 259L/day to 172,8L/day. The methane percentages of biogas increased from 0% up to 53% until a streptomycin concentration of 200mg/L. The methane percentages of biogas were decreased to 48%, when the streptomycin concentration increased from 200mg/L to 40mg/L. In a study performed by [6] methane gas production was found as 12L/day (OLR=1.04 kg COD/m3*day), 30 L/day (OLR=2.01 kg COD/m3*day) and 66 L/day (OLR=6.17 kg COD/m3*day) for firth, second and third compartments, in ABR reactor respectively. In this study the methane percentages are comparable higher than that aforementioned study.
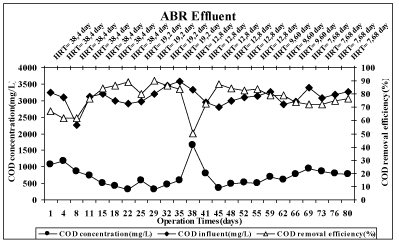
Figure 14: The effect of HRTs on COD removal efficiencies in ABR.
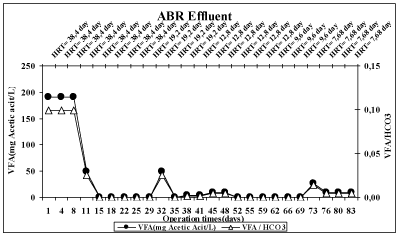
    Figure 15: The variations of VFA and VFA/Bic.Alk. Ratio in the effluent of
ABR at decreased HRTs.
From Figure 13 it can be seen that the total gas production rates increased from 0L/day to 259,2L/day in the operation of ABR without streptomycin. After that the total gas production rates increased from 259,2L/day to 504L/day, respectively as the streptomycin concentration increased from 0mg/L to 175mg/L. The total gas production also, decreased from 504mg/L to 208,8mg/L. The methane percentages of biogas were increased from 0% up to 53% until a streptomycin concentration at 200mg/L then the methane percentages of biogas decreased to 48%, when the streptomycin concentration increased from 200mg/L to 400mg/L.
Effect of hydraulic retention time (hrt) on the performance of abr reactor: Effect of HRTs on the COD Removal Efficiency in ABR Reactor. The effect of Hydraulic Retention Times (HRTs) on the COD removal efficiency was shown in Figure 14.The influent streptomycin concentration was kept constant as 200mg/L. As shown in Figure 14, the influent COD concentration was approximately 3600-2900mg/L since 200mg/L streptomycin gives an additional COD concentration to total COD thought continuous operation. 200mg/L of streptomycin gave approximately a COD of 131,3mg/L. 90% COD removal efficiency was obtained at a HRT of 19,2 days in ABR reactor. When the HRT was decreased from 12,8 days to 7,68 days, the COD removal efficiency decreased from 89% to 76%, respectively [17]. Investigated the performance of an anaerobic baffled reactor treated a whisky distillery wastewater at different four HRTs (10, 7, 4 and 2 days). The maximum COD removal efficiency was observed at a HRT of 4 days (E=93%) [5]. investigated the performance of anaerobic sludge blanket reactor treated a chemical synthesis - based pharmaceutical wastewater at two HRTs (1and 3 days). COD removal efficiency increased from 58% to 78% with the HRT was increased from 1 to 3 days [18]. found that as the HRT decreased from 10,38 days to 2,5 days the COD removal efficiencies in the anaerobic and anaerobic/aerobic reactor effluents decreased from 94% to 92% and from 98% to 97%, respectively.
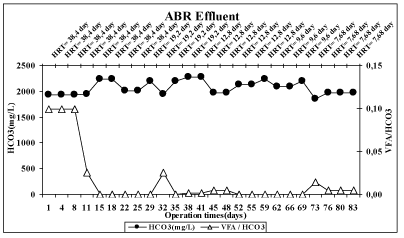
    Figure 16: The variations of Bic.Alk. And VFA/Bic.Alk. Ratio in the effluent of
ABR at decreased HRTs.
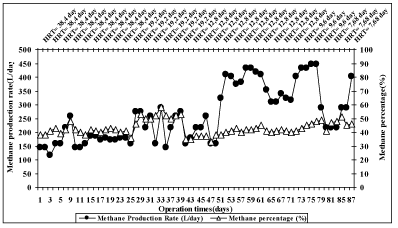
    Figure 17: Methane gas production and methane percentage in ABR at
decreased HRTs.
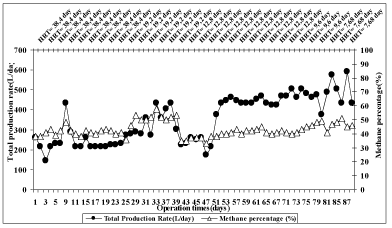
    Figure 18: Total gas production and methane percentage in ABR at
decreased HRTs.
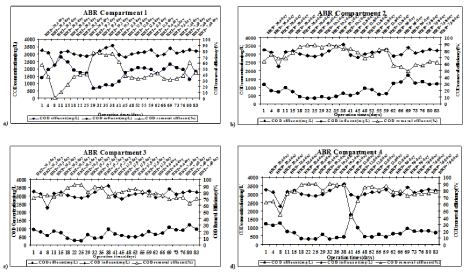
Figure 19: The variations of COD in ABR at decreased HRTs in the all compartments. (a- compartment 1, b-compartment 2, c-compartment 3 d- compartment 4).
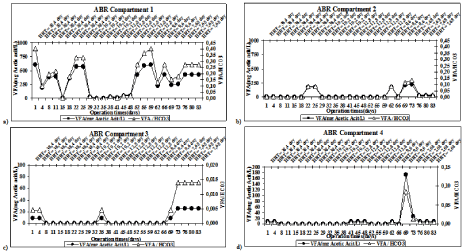
Figure 20: The variations of VFA in ABR at decreased HRTs in the all compartments. (a- compartment 1, b-compartment 2, c-compartment 3 d- compartment 4).
Effect of hrts on total volatile fatty acid (tvfa), bicarbonate alkalinity (bic. Alk.) And tvfa/bic.alk. Ratio variations in abr reactor: Figure 15 shows the TVFA in the effluent of ABR at decreased HRTs. The highest VFA concentration (191mg/L) was found at a HRT of 38,4 days. After this HRT, TVFA concentration in the effluent decreased and was measured as 9mg/L at a HRT of 7,68 days. From Figure 15, it can be seen that Bic.Alk. concentrations in effluent decreased from 191 to 9 mg/l since the HRT were decreased [19,20]. investigated the performance of an anaerobic baffled reactor treated dilute wastewater the HRT decreased from 18 h to 9 h, and the final concentration of effluent VFAs increased from 8mg/L to 22mg/L, respectively.
From Figure 16, it can be seen that Bic.Alk. Concentrations increased from 1931mg/L up to 2199mg/L when HRT decreased from 38,4 to 9,60 days. After that Bic. Alk. Concentrations decreased to 1972 mg/L a HRT of 7,68 days.
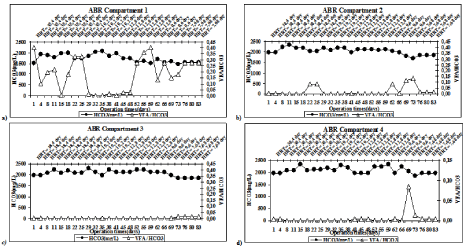
Figure 21: The variations of HCO3 in ABR at decreased HRTs in the all compartments. (a- compartment 1, b-compartment 2, c-compartment 3 d- compartment 4).
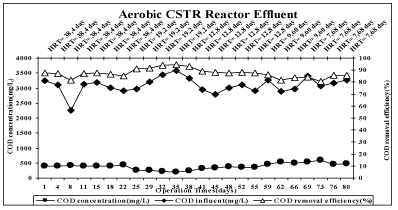
    Figure 22: The overall COD removal efficiency in aerobic (CSTR) reactor
system.
In anaerobic reactor system TVFA/Bic.Alk. Ratio gives necessary information to determine the stability of the anaerobic reactor. If the TVFA/Bic.Alk. Ratio is lower than 0.4, the reactor is stable. When the TVFA/Bic.Alk. Ratio is lower than 0.8, the reactor system is moderately stable or unstable [1]. As shown in Figure 15. The TVFA/Bic.Alk. Ratio varied between 0.099 and 0.005 in effluent as the HRTs were decreased from 38,4 days to 7,68 days. ABR reactor was stable as reported by [1] since the TVFA/Bic.Alk. Ratios in the effluent were lower than 0.4.
Effect of HRTs on gas productions and methane percentage in anaerobic abr reactor: From Figure 17 it can be seen that the methane gas production increased from 144L/day up to 446,4L/day as the HRT decreased from 38,4 to 9,60 days as the streptomycin concentration constant at a 200mg/L. the maximum methane percentages (58%) has obtained at a HRT of 19,2 days. However, the methane gas production decreased from 446,4L/day to 288L/day at a HRT of 7,68 days. Maximum methane gas production (446,4L/day) was obtained at 9,6 days of HRT.
From Figure 18 it can be seen that the total gas production increased from 259,2L/day up to 504L/day as the HRT decreased from 38,4 to 9,60 days as the streptomycin concentration constant at a 200mg/L. But total gas production decreased from 504L/day to 432L/day at a HRT of 7,68 days. Maximum total gas production (504L/day) was obtained at 9,60 days of HRT.
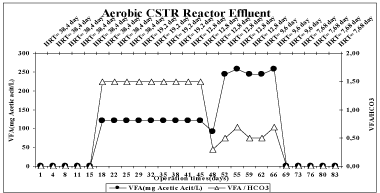
Figure 23: The overall VFA and VFA/Bic.Alk. Ratio in aerobic (CSTR) reactor.
The methane percentages of the biogas were approximately 38-40% at a HRT of 38,4 days. After that methane percentages increased from 36% up to 53% at a HRT of 19,2 days. However the methane percentages increased from 35% up to 46% as the HRT decreased from 19,2 to 7,68 days. When the ABR system reached to a stabilized state under the OLR of 6.0 kg COD/m3d and HRT of 39,5 days, the total amounts of biogas in the four compartments were 73.2 L/d, 30.8 L/d, 8.6 L/d, and 1.3 L/d, respectively [21].
Effect of compartments of ABR on COD removal efficiencies at different HRTs: In this study, the effect of decreases in HRTs on COD removal efficiencies was investigated in four compartments of the ABR reactor. Figure 19 shows the effect of compartmentalization on COD removal efficiencies at different HRTs. As shown in the Figure 19 a), in compartment I the COD removal efficiencies were approximately 77% at a HRT of 19,2 days. The COD removal efficiency was low at a HRT of 7,68 in the compartment I. Figure 19b,c), shows the COD removal efficiencies in the compartment II (varied between 64,23% and 78,08% )and compartment III (varied between 71,61% and 86,02% ) (see Figure 19b,c). COD removal efficiency increased from 64,23% to 87,19% in the second compartment when HRTs decreased from 38,4 days to 19,2 days. However the COD removal efficiency decreased from 87,19% to 62,50% in compartment II when the HRT decreased from 19,2 to 7,68 days (see Figure 19b). COD removal efficiency increased from 71,61% to 88,10% in the initial compartment when the HRT decreased from 38,4 days to 19,2 days. However COD removal efficiency decreased from 88,10% to 70,44% in compartment III when the HRT decreased from 19,2 to 7,68 days ( see Figure 19c). In compartment IV the COD removal efficiencies were high (89,89%) at a HRT of 19,2 days compared to the other HRTs. The COD removal efficiency increased from 62,49 % to 89,89% as the HRT decreased from 38,4 days to 19,2 days. Then the COD removal efficiency decreased from 89,89 % to 78,59 % when the HRT decreased from 19,2 days to 7,68 days in compartment IV (see Figure 19d). Therefore for the maximum COD removal efficiency the optimum HRT was found to be 19,2 days.
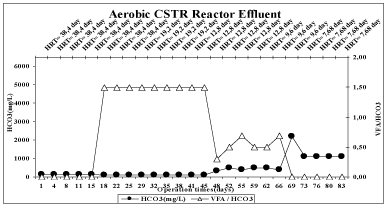
Figure 24: The overall HCO3 and VFA/Bic.Alk. Ratio in aerobic (CSTR) reactor.
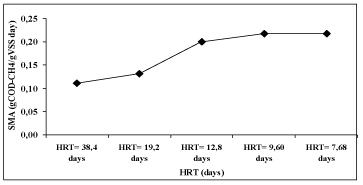
Figure 25: SMA values in ABR at different HRTs.
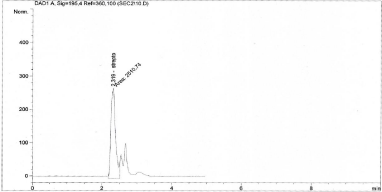
Figure 26: HPLC chromatogram in the influent of ABR at 12,8 days of HRT.
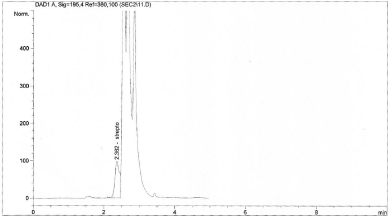
Figure 27: HPLC chromatogram in the effluent of ABR at 12,8 days of HRT.
In a study at soybean protein processing wastewater of [21]. at a HRT of 39,5 days. After the acclimatization of the anaerobic activated sludge in 24 days, the ABR was subjected to a steady-state operation and the removal of total COD from the wastewater was remarkable (above 92%); At the second stage, the COD removal increased continually when the volume loading rate enhancing, basically about 94%. However, at the third stage, when an influent 8000mg COD/L was applied to the ABR, acidification phenomenon happened during the initial period (65-67 days) because of increasing volume-loading rate that resulted in the declination of COD removal to 80%. Four days later, the COD removal was improved to 94% without adopting any measurement (influent COD concentration 8000mg/L). The COD removal in the last stage was similar to the third stage, when increased volume loading rate further, the total COD removal efficiencies in the ABR system remained as 97% and the effluent COD concentration was under 300mg/L.
Effect of compartments of ABR on VFA, bic. Alk. and vfa/bic. Alk. Ratio at different HRTs: Figure 20 shows the TVFA and TVFA/Bic.Alk. ratio variations in all compartments on decreased HRTs. In the compartment I at the VFA decreased from 608mg Acetic acid /L to 26mg Acetic acid /L when HRT decreased from 38,4 days to 19,2 days. But VFA increased from 26mg Acetic acid/L to 425mg Acetic acid /L when the HRT decreased from 12,8 to 7,68 days (see Figure 20a). In the compartments II and III at the VFA nearly zero mg/L firths four HRTs (38,4 - 19,2 - 12,8 - 9,60 days ), but VFA was found 26 mg/L at a HRT of 7,68 days ( see Figure 20b,c). (Figure 20d) shows the VFA in the compartment IV, the VFA almost 9mg/L at all HRTs, who studied synthetic medium-strength wastewater, found that the VFA concentration of 913mg/L, 1154mg/L and 1258mg/L were achieved at HRTs of 24h, 16h and 8h, respectively, in compartment I. In compartment II the VFA concentrations were found as 371mg/L, 458mg/L and 959mg/L at HRTs of 24h, 16h and 8h, respectively. VFA concentration of 223 and 228 mg/L were achieved at HRTs of 24 and 16h. Decreasing of HRT to 8h gave a VFA concentration of 458 mg/L in compartment III of multistage anaerobic biofilm reactor. For all HRTs the VFA production in the first compartment was significantly greater than that in other compartments and it decreased from input to output.
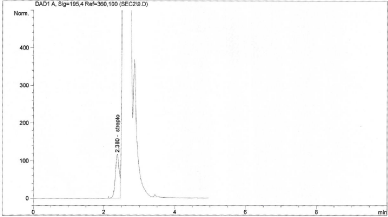
Figure 28: HPLC chromatogram in the effluent of CSTR at 12,8 days of HRT.
Figure 21 shows the Bic.Alk. and TVFA/Bic.Alk. ratio variations in all compartments on decreased HRTs. In compartment I, when the HRT decreased from 38,4 days to 19,2 days, the HCO3 concentrations increased from 1509mg/L up to 1972mg/L. When the HRT decreased from 38,4 days to 19,2 days, the HCO3 concentrations decreased. When the HRT decreased from 19,2 days to 7,68 days the HCO3 concentrations decreased from 1972mg/L to 1550mg/L (see Figure 21a). Similar results were found for Compartments II, III and VI. The HCO3 concentrations increased from 1972mg/L up to 2045mg/L when the HRT decreased from 38,4 days to 9,60 days in compartments II and IV. The HCO3 concentrations increased from 1972mg/L up to 2126mg/L when the HRT decreased 38,4 days to 9,60 days in compartment III. However the VFA concentrations decreased to 1858 mg/L and to 1972mg/L in compartments II - III and at a HRT of 7,68, respectively (see Figure 21b,c,d).
In anaerobic reactor system TVFA/Bic.Alk. ratio gives necessary information to determine the stability of the anaerobic reactor. If the TVFA/Bic.Alk. ratio is lower than 0.4, the reactor is stable. When the TVFA/Bic.Alk. ratio is lower than 0.8, the reactor system is moderately stable or unstable [1]. As shown in Figure 20,21. The TVFA/Bic.Alk. ratio varied between 0.403 and 0.274 in compartment I, as the HRTs were decreased from 38,4 days to 7,68 days. The TVFA/Bic.Alk. ratio varied between 0.005 and 0.014 in compartments II, III and IV as the HRTs were decreased from 38,4 days to 7,68 days.ABR reactor was stable as reported by [1] since the TVFA/Bic.Alk. ratios in the all compartments were lower than 0.4.
Kinetic Studies
Streptomycine utilization rates and specific growth rates at increasing STR concentrations of 25, 50, 75, 100, 150, 175, 200, 240, 280, 320, to 400 mg/L were used to determine biokinetic parameters from the regression of data for each experiment. Streptomycine utilization rate (r, mg STR/L. day was determined from the difference between reactor influent and effluent STR concentrations according to the following mass balance equation:
r = Q(STR inf - STR eff) / V
Where STR inf is the influent srt concentration (mg/l), STR eff is the effluent STR concentration (mg /L, Q is the flowrate m3/day.
Removal efficiencies in aerobic cstr reactor system: Figure 22 shows the COD removal efficiencies of aerobic CSTR reactor. The COD removal efficiency in this reactor system were up to 94,52% until a HRT of 19,2 days. After that COD removal efficiency of the reactor decreased from 94,52% to 85,70% when the HRT were decreased from 19,2 days to 7,68 days in. For maximum COD removal efficiency (E=94,52%) the optimum HRT was found as 19,2 days.
Figure 23 shows the overall VFA and VFA/Bic.Alk. ratio of aerobic reactor. Although the VFA and HCO3 alkalinity were the key parameters in the anaerobic reactors in this study it was aimed to monitor their concentrations in the aerobic CSTR reactor since the effluent of anaerobic ABR reactor it was used as the feed of the aerobic CSTR reactor. In aerobic CSTR reactor the VFA concentrations increased from 0 mg /L to 258 mg Acetic acid /L when the HRT were decreased from 38,4 days to 9,60 days. However the VFA concentrations decreased from 258mg/L to 0mg/L when the HRT decreased from 9,60 days to 7,68 days. For the lowest VFA concentrations (258mg/L) the optimum HRT was found as 9,60 days.
Figure 24 shows the Bic.Alk. and VFA/Bic.Alk. ratios of aerobic reactor system. In aerobic CSTR reactor system the HCO3 concentrations decreased from 123mg /L to 81mg /L when the HRT decreased from 38,4 days to 19,2 days. However, the HCO3 concentrations increased from 81mg /L to 1087mg /L when the HRT decreased from 19,2 days to 7,68 days. The best HCO3 concentrations was found to be 1087mg/L, for the maximum growth of methanogen in the anaerobic conditions at a HRT of 7,68 days.
Specific methanogenic activity (SMA) in ABR at different HRTs: Figure 25 shows the SMA values of mixed sludge taken from the all compartments of ABR during continuous operation of ABR at different HRTs. The SMA is an indicator of methanogenic activity in anaerobic systems. As shown in Figure 25, the SMA values increased from 0.111 to 0.218 g COD-CH4/ gVSS when the HRT decreased from 38.4 days to 7.68 days. In other words the maximum SMA was found to be 0.218 g COD-CH4/ gVSS day for HRTs between 7.68 and 9.60 days. This could be explained by the high flow rates in the ABR reactor resulting in increases in the activity of the methanogenes.
Assessment of toxicity of sequential anaerobic ABR/aerobic CSTR reactor system: Daphnia magna test is accepted as acute toxicity test. Results were expressed as mortality percentage of the Daphnids. After the test samples continuing streptomycin was diluted, the experiments were carried out using 10 Daphnids. The Daphnids was added to into every one test vessel at the beginning time (t=0). After 24 h of incubation time, EC50 value (the concentration inhibited 50% of Daphnia magna) was found.
The acute toxicity test results performed with Daphnia magna showed that the EC50 values decreased from influent 400mg/L to 132mg/L, and to 20mg/L in the effluents of ABR, in aerobic reactor effluent at a HRT of 38.4 days. (See in a Table 4). The total acute toxicity reduction in sequential ABR CSTR reactor effluent was 95%. At a HRT of 19,2 days EC50 values decreased from influent 400mg/L to 120mg/l , and to 61,2mg/L in the effluents of ABR , in aerobic reactor effluent. The total acute toxicity reduction in sequential ABR CSTR reactor effluent was 85%. At a HRT of 12,8 days EC50 values decreased from influent 400mg/L to 82mg/L , and to 46mg/l in the effluents of ABR, in aerobic reactor effluent. The total acute toxicity reduction in sequential ABR CSTR reactor effluent was 89%. At a HRT of 9,60 days EC50 values decreased from influent 400mg/L to 82mg/L , and to 42mg/L in the effluents of ABR , in aerobic reactor effluent. The total acute toxicity reduction in sequential ABR CSTR reactor effluent was 90%. After that the EC50 values decreased from influent 400mg/L to 114mg/L, and to 78mg/L in the effluents of ABR , in aerobic reactor effluent at a HRT of 7,68 days. The total acute toxicity reduction in sequential ABR CSTR reactor effluent was 80%. The maximum acute toxicity removal was found at the maximum HRT of 38.4 days studied during the operation of anaerobic ABR reactor. This could be attributed to high HRT which is enough for toxicity removals of 200mg/L streptomycin antibiotic. During this HRT the microorganisms have enough time to contact and to acclimate to 200mg/L streptomycin antibiotic in ABR.
Variations of streptomycin removal efficiency in the ABR reactor at increasing HRTs: Figures 26-28 shows the HPLC chromatogram of the samples taken from the anaerobic reactor influent, effluent and aerobic CSTR effluent at a constant influent streptomycin concentration of 200mg/L at a HRT of 12,8 days. A Streptomycin peak was 59,79 mg/L in HPLC chromatogram of the effluent of ABR reactor samples. This showed that streptomycin was biodegraded with removal efficiencies of 66%- 74% in ABR and CSTR reactors at a HRTs of 12,8 days. (See Table 4). In Figure 26 the chromatogram of streptomycin showed that the peak was appeared after 2.319 min, in HPLC analysis. This corresponded to a streptomycin concentration of 179,57 mg/L. As seen in Figure 27, the streptomycin concentration was measured as 59,79 mg/L in the effluent of the ABR. The streptomycin removal efficiency was 66% at a HRT of 12,8 days. The streptomycin concentration was measured as 47,54 mg/L in the aerobic CSTR effluent corresponding a removal efficiency 74%. In this study it was found that the “streptomycin” antibiotic was mainly degraded (179,57mg/L) in anaerobic ABR reactor while the remaining small part of this antibiotic (47,54 mg/L) was removed in the aerobic CSTR reactor [22-27].
Conclusions
The streptomycin and chloramphenicole concentrations caused 50% decreases in the methanogenic activity (decrease of methane gas production) (IC50) were calculated as 292,06 mg/L and 252,49 mg/L, respectively.
ABR reactor reached to steady-state conditions after an operation period of 92 days at a streptomycin concentration of 25 mg/L. The COD removal efficiency was found as 84% after 92 days of the start-up period. The daily methane gas production, total gas production and methane percentage remained stable at 69,12 L/day, 100,8 L/day and 45%, respectively.
ABR reactor reached to steady-state conditions after an operation period of 12 days at a chloramphenicole concentration of 50 mg/L. The COD removal efficiency was found as 82% after 12 days of the start-up period. The daily methane gas production, total gas production and methane percentage remained stable at 439,2 L/day and 48%, respectively.
The removal of Streptomycin in ABR and ABR/CSTR Reactor System
The COD removal efficiency was 67,55% at a streptomycin concentration of 400 mg/L. The maximum COD removal efficiency was 89,27% at a streptomycin concentration of 200 mg/L. The ABR reactor exhibited high COD (E=94-95%) removal efficiencies until a HRT of 19,2 days.
The maximum total, methane gas and methane percentage were found as 432 L/day, 288 L/day and 58%, respectively, for the streptomycin concentration of 200 mg/L. The total gas and methane gas production rates increased from 259,2 to 504 L/day and from 144 to 446,4 L/day, respectively as the HRT decreased from 38,4 days to 9,60 days. The methane percentages of the biogas were approximately 38-40% at a HRT of 38,4 days. The methane percentages increased from 36% up to 53% at a HRT of 19,2 days. The methane percentages increased from 35% up to 46% as the HRT decreased from 19,2 to 7,68 days.
The highest VFA concentration (191 mg/L) was found at a HRT of 38,4 days. The VFA concentrations in the effluent decreased to 9 mg/L at a HRT of 7,68 days. VFA was 0 mg/L at all streptomycin concentrations until a streptomycin concentration of 400 mg/L. TVFA/Bic.Alk. ratios in the effluent and in the compartments of ABR were lower than 0.4. These results indicated the stability of ABR reactor at increasing streptomycin concentrations and decreasing HRTs.
The COD removal efficiency in sequential anaerobic ABR/aerobic CSTR reactor system was 94,52% at a HRT of 19,2 days. After that, the COD removal efficiency of the total reactor performance decreased from 94,52% to 85,70% when the HRT was decreased from 19,2 days to 7,68 days in sequential anaerobic ABR/aerobic CSTR reactor. For maximum COD removal efficiency (E=94,52%) the optimum HRT was found as 19,2 days.
In Daphnia magna acute toxicity test the wastewater containing 200 mg/L of streptomycin concentration was found to be toxic (% inhibition = 100%) in the influent of anaerobic ABR/aerobic CSTR reactor system. The acute toxicity reduction in sequential ABR/ CSTR reactor system effluent was 95% at a HRT of 38,4 days. The acute toxicity removal decreased from 95% to 80% as the HRTs decreased from 38,4 days to 7,68 days.
In this study it was found that the “streptomycin” antibiotic was mainly degraded (179,57 mg/L) in anaerobic ABR reactor while the remaining small part of this antibiotic (47,54 mg/L) was removed in the aerobic CSTR reactor. The streptomycin removal efficiency was 66% at a HRT of 12,8 days in the anaerobic ABR effluent. The streptomycin concentration was measured as 47,54 mg/L in the aerobic CSTR effluent corresponding a removal efficiency 74%.
References
- Behling E, Diaz A, Colina G, Herrera M, Gutierrez E, Chacin E, et al. Domestic wastewater treatment using a UASB reactor. Biores. Technol. 1997; 61: 239- 245.
- Kümmerer K. Antibiotics in the aquatic environment - A review - Part II. Chemosphere. 2009; 75: 435-441.
- B Kasapgil Ince, A Selcuk and O Ince. 2002.
- Shreeshivadasan Chelliapan, Thomas Wilby, Paul J. Sallis. 2006.
- Oktem Y, Ince O, Sallis P, Donnelly T, Ince KB. Anaerobic treatment of a chemical synthesis- based pharmaceutical wastewater in a hybrid upflow anaerobic sludge blanket reactor. Bioresource Technology. 2007; 99: 1089-1096.
- Liu X, Nangi R, Yuan Y. Performance of a periodic anaerobic baffled reactor fed on chinese traditional medicine industrial wastewater. Bioresource Technology. 2009; 100: 104-110.
- Wikipedia. (n.d.).Streptomycin, Retrieved August. 2009.
- Speece RE. Anaerobic biotechnology for industrial wastewater. Tennessee: Archae Press, 5840 R.E. Lee, Dr. Nashville. 1996; 37215.
- APHA-AWWA. Standard Methods for the Examination of Water and Wastewater, 17th edition. American Public Health Association/American Water Works Association/Water Environment Federation. Washington DC, USA. 1992.
- Razo-Flores E, Luijten M, Donlon BA, Lettinga G, Field JA. Biodegradation of selected azo dye under methanogenic conditions. Water Science Technology. 1997; 36: 65-72.
- Beydilli MI, Pavlosathis SG, Tincher WC. Decolorization and toxicity screening of selected reactive azo dyes under methanogenic conditions. Water Scienc. and Technology. 1998; 38: 225-232.
- Owen WF, Stuckey DC, Healy JB, Young JR. LY, McCarty PL. Bioassay for monitoring biochemical methane potential and anaerobic toxicity, Water Research. 1979; 13: 485-492.
- Donlon B, Razo-Flores E, Lettinga G, Field, AJ. Continuous detoxification, transformation and degradation of nitrophenols in Upflow Anaerobic Sludge Blanket (UASB) reactors. Biotechnoogyl. and Bioeng. 1996; 51: 439-449.
- Standart Methot. 2005.
- Kurosawa N, Kuribayashi S, Owada E, Ito K, Nioka M, Arakawa M, Fukuda R, J. Chromatogr. Biomed. Appl. 1985; 44: 379-385.
- Metcalf, Eddy. Wastewater Engineering: treatment, Disposal and Reuse. Mc Graw.Hill.Inc. 1991.
- Akunna JC, Clark M. Performance of a granular-bed anaerobic baffled reactor (GRABBR) treating whisky distillery wastewater. Bioresource Technology. 2000: 74: 257-261.
- Kuscu OS, Sponza DT. Effects of nitrobenzene concentration and hydraulic retention time on the treatment of nitrobenzene in sequential anaerobic baffled reactor (ABR)/ Continuously Stirred Tank Reactor (CSTR) system Bioresource Technology. 2009; 100: 2162-2170.
- Feng H, Hu L, Shan D, Fang C, He Y, Shen D. Effects of operatonal factors on soluble microbial products in a carrier anaerobic baffled reactor treating dilute wastewater. Journal of Environmental Sciences. 2008; 20: 690-695.
- Feng HJ, Fang HU, Shan D, Fang CR, Shen DS. Effects of Temperature and Hydraulic Residence Time (HRT) on Treatment of Dilute Wastewater in a Carrier Anaerobic Baffled Reactor. Biomedical and Environmental Sciences. 2008; 21: 460-466.
- Zhu GF, Li JZ, Wu P, Jin HZ, Wang Z. The performance and phase separated characteristics of an anaerobic baffled reactor treating soybean protein processing wastewater. Bioresource Technology. 2008; 99: 8027-8033.
- Halling S. Algal toxicity of antibacterial agents used in intensive farming. Chemosphere. 2000; 40: 731-739.
- Ubay G. Kinetic modelling of UASBR’s. MSc thesis. Faculty of Science, Istanbul Technical University, (in Turkish). 1989.
- Uyanik S, Sallis PJ, Anderson GK. The effect of polymer addition on granulation in an anaerobic baffled reactor (ABR). Part I: process performance. Wat. Res. 2002; 36: 933-943.
- Vossoughi M, Shakeri M, Alemzadeh I. Performance of anaerobic baffled reactor treating synthetic wasterwater influenced by decreasing COD/SO4 rations. Chem. Eng and Process. 2003; 42: 811-816.
- Wang J, Huang Y, Zhao X. Performance and characteristics of an anaerobic baffled reactor. Bioresource Technology. 2004; 93: 205-208.
- Weifen W, Hong L, Changhu X, Jamil K. Elimination of chloramphenicol, sulphamethoxazole and OXYtetacycline in shrimp, Penaeus chinensis following medicated-feed treatment. Environment International. 2004; 30: 367-373.